Preface
I believe that many senior and middle-level students in JAVA will often encounter an interview question during the interview.
How do you tune and locate JVM problems in your work?
In fact, if the number of users is small and your code is normal, how can we accumulate experience in this field unless we really encounter few problems related to JVM in our work, and even if we encounter problems that are solved by some of the company's big cattle? Now let's practice JVM tuning by the pot.
Note that what we usually call JVM tuning generally refers to Java heap, Java virtual machine stack parameter tuning
Java heap overflow
Let's start with a code example. Note that I'm using IDEA tools. I need to configure VM options as - Xms20m -Xmx20m -XX:+HeapDumpOnOutOfMemoryError. If you don't know how Baidu configures the JVM running parameters of Idea.
package com.example.demo.jvm;

import java.util.ArrayList;
import java.util.List;

/**
 * @Author: Wang Chong
 * @Date: 2019/9/22 9:37
 * @Version: V1.0
 */
public class HeapOutMemoryTest {
    static class ChongGuo {

    }
    public static void main(String[] args) {
        List<ChongGuo> chongGuos = new ArrayList<>();
        while (true) {
            chongGuos.add(new ChongGuo());
        }
    }
}
The results are as follows:
java.lang.OutOfMemoryError: Java heap space
Dumping heap to java_pid9352.hprof ...
Heap dump file created [28701160 bytes in 0.122 secs]
Exception in thread "main" java.lang.OutOfMemoryError: Java heap space
    at java.util.Arrays.copyOf(Arrays.java:3210)
    at java.util.Arrays.copyOf(Arrays.java:3181)
    at java.util.ArrayList.grow(ArrayList.java:261)
    at java.util.ArrayList.ensureExplicitCapacity(ArrayList.java:235)
    at java.util.ArrayList.ensureCapacityInternal(ArrayList.java:227)
    at java.util.ArrayList.add(ArrayList.java:458)
    at com.example.demo.jvm.HeapOutMemoryTest.main(HeapOutMemoryTest.java:18)
Disconnected from the target VM, address: '127.0.0.1:54599', transport: 'socket'
You can see the error of java.lang.OutOfMemoryError: Java heap space in the console. Why? First, explain the above running parameters.
-Xms20m -Xmx20m -XX:+HeapDumpOnOutOfMemoryError
- - Xms20m: Set the minimum memory of JVM to 20m. This value can be set to be the same as - Xmx to avoid the JVM reallocating memory after each garbage collection is completed
- - Xmx 20m: Set the maximum available memory of JVM to 20M
- - XX:+HeapDumpOnOutOfMemoryError indicates that DUMP files are automatically generated when OOM occurs in the JVM
Now let's analyze the cause of the error and use JProfile to open the dump file named java_pid9352.hprof that we just generated. As you can see from Instance Xcount and Size, you can basically determine which class of objects has a problem. In the above example, ChongGuo can be an instance that has been born in a number of sizes greater than 12M, but not more than 20M. So the new problem comes again? Why is heap memory overflow reported before 20M?

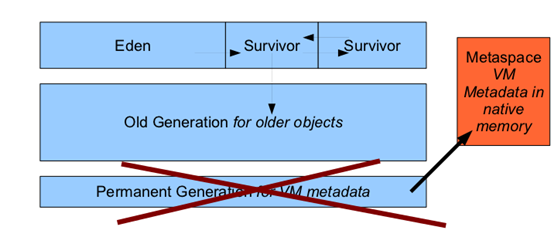
The answer is that heap memory in JDK8 also includes Metaspace, that is, metamemory space, in JDK7 and its previous JDK version number before the appearance of metaspace. Heap memory is usually divided into three areas: Nursery memory (young generation), old generation, and Permanent Generation for VM Matedata, as shown below.

The top level is the younger generation. After an object is created, it is first placed in the Eden memory of the younger generation. It is assumed that after two Survivor s, it will be transferred to the permanent memory of the Old Generation to store metadata information such as methods and variables of the object. By assuming that there is not enough permanent memory. We'll get errors like: java.lang.OutOfMemoryError: PermGen
In JDK8, the situation has changed dramatically, that is, you won't get this error under normal circumstances.
It is in JDK8 that permanent memory stored in metadata is moved from heap memory to native memory.
In JDK8, the JVM heap memory structure becomes as follows:
If I start the VM parameter and add: -XX:MaxMetaspaceSize=1m, run the above program again.
Connected to the target VM, address: '127.0.0.1:56433', transport: 'socket'
java.lang.OutOfMemoryError: Metaspace
Dumping heap to java_pid9232.hprof ...
Heap dump file created [1604635 bytes in 0.024 secs]
FATAL ERROR in native method: processing of -javaagent failed
Exception in thread "main" Disconnected from the target VM, address: '127.0.0.1:56433', transport: 'socket'

Process finished with exit code 1
It can be found that the error message has turned into java.lang.OutOfMemoryError: Metaspace, indicating that the Metaspace is not enough, I changed to about 4m to meet the startup conditions.
Virtual Machine Stack and Local Method Stack Overflow
Two exceptions are described in the Java Virtual Machine Specification:
- If the stack depth requested by a thread is greater than the maximum depth allowed by the virtual machine, a StackOverflow Error exception is thrown.
-
If the virtual machine cannot apply for enough memory space on the extension stack, an OutOfMemoryError exception is thrown
Stack Overflow Error is a good test, the test code is as follows:
package com.example.demo.jvm;

/**
 * @Author: Wang Chong
 * @Date: 2019/9/22 19:09
 * @Version: V1.0
 */
public class StackOverflowTest {

    /**
     * Stack size
     */
    private int stackLength = 1;

    /**
     * Recursive stack
     */
    public void stackLeak() {
        stackLength++;
        stackLeak();
    }

    public static void main(String[] args) {
        StackOverflowTest stackOverflowTest = new StackOverflowTest();
        try {
            stackOverflowTest.stackLeak();
        } catch (Throwable e) {
            System.out.println("stack length is :" + stackOverflowTest.stackLength);
            throw e;
        }

    }

}
The results are as follows:
Exception in thread "main" stack length is :20739
java.lang.StackOverflowError
    at com.example.demo.jvm.StackOverflowTest.stackLeak(StackOverflowTest.java:20)
    at com.example.demo.jvm.StackOverflowTest.stackLeak(StackOverflowTest.java:20)
When the VM parameter - Xss parameter is not set, the memory support stack depth of the thread is 20739. The test result is related to the memory size of the machine, but how to test the second point above? Normally, if it is single-threaded, it is difficult to test memory leaks. What about multi-threaded? Let's look at the following test code:
package com.example.demo.jvm;

/**
 * @Author: Wang Chong
 * @Date: 2019/9/22 19:09
 * @Version: V1.0
 */
public class StackOOMTest implements Runnable{

    /**
     * Stack size
     */
    private int stackLength = 1;

    /**
     * Recursive stack
     */
    public void stackLeak() {
        stackLength++;
        stackLeak();
    }

    public static void main(String[] args) {
       while (true){
           StackOOMTest stackOverflowTest = new StackOOMTest();
           new Thread(stackOverflowTest).start();
       }

    }

    @Override
    public void run() {
       stackLeak();
    }
}
Exception in thread "main" java.lang.OutOfMemoryError:unable to create new native thread
Runtime Constant Pool Overflow
- Character constant pool overflow is also heap overflow in JAVA8. The test code is as follows:
package com.example.demo.jvm;

import java.util.ArrayList;
import java.util.List;

/**
 * @Author: Wang Chong
 * @Date: 2019/9/22 19:44
 * @Version: V1.0
 */
public class RuntimePoolOOMTest {

    public static void main(String[] args) {
        List<String> list = new ArrayList<>();
        int i = 0;
        while (true) {
            list.add(String.valueOf(i).intern());
        }
    }
}
The results are as follows:
Exception in thread "main" java.lang.OutOfMemoryError: Java heap space
    at java.util.Arrays.copyOf(Arrays.java:3210)
    at java.util.Arrays.copyOf(Arrays.java:3181)
    at java.util.ArrayList.grow(ArrayList.java:261)
    at java.util.ArrayList.ensureExplicitCapacity(ArrayList.java:235)
    at java.util.ArrayList.ensureCapacityInternal(ArrayList.java:227)
    at java.util.ArrayList.add(ArrayList.java:458)
    at com.example.demo.jvm.RuntimePoolOOMTest.main(RuntimePoolOOMTest.java:17)
Disconnected from the target VM, address: '127.0.0.1:50253', transport: 'socket'
Prove that the character constant pool has been allocated in the heap in Java 8.
Method area overflow
Prior to Java 7, the method area was located in PermGen, where the permanent generation and heap were isolated from each other. The size of the permanent generation could set a fixed value when starting the JVM, which could not be changed. Java 8 still retained the concept of method area, but implemented in different ways. Cancel the permanence generation and store the method in metaspace, which is still unrelated to the heap, but shares physical memory with the heap, which is logically considered to be in the heap.
The test code is as follows. To quickly see the results, add the VM parameter - Xms20m -Xmx20m -XX:+HeapDumpOnOutOfMemoryError -XX:MaxMetaspaceSize=10m:
package com.example.demo.jvm;

import org.springframework.cglib.proxy.Enhancer;
import org.springframework.cglib.proxy.MethodInterceptor;

/**
 * @Author: Wang Chong
 * @Date: 2019/9/22 19:56
 * @Version: V1.0
 */
public class MethodAreaOOMTest {
    public static void main(String[] args) {
        while (true) {
            Enhancer enhancer = new Enhancer();
            enhancer.setSuperclass(OOMObject.class);
            enhancer.setUseCache(false);
            enhancer.setCallback((MethodInterceptor) (o, method, objects, methodProxy) -> methodProxy.invokeSuper(o,
                    objects));
            enhancer.create();
        }
    }

    static class OOMObject {

    }
}
The results are as follows:
java.lang.OutOfMemoryError: Metaspace
Dumping heap to java_pid8816.hprof ...
Heap dump file created [6445908 bytes in 0.039 secs]
Exception in thread "main" org.springframework.cglib.core.CodeGenerationException: java.lang.reflect.InvocationTargetException-->null
    at org.springframework.cglib.core.AbstractClassGenerator.generate(AbstractClassGenerator.java:345)
    at org.springframework.cglib.proxy.Enhancer.generate(Enhancer.java:492)
    at org.springframework.cglib.core.AbstractClassGenerator$ClassLoaderData.get(AbstractClassGenerator.java:114)
    at org.springframework.cglib.core.AbstractClassGenerator.create(AbstractClassGenerator.java:291)
    at org.springframework.cglib.proxy.Enhancer.createHelper(Enhancer.java:480)
    at org.springframework.cglib.proxy.Enhancer.create(Enhancer.java:305)
    at com.example.demo.jvm.MethodAreaOOMTest.main(MethodAreaOOMTest.java:19)
Caused by: java.lang.reflect.InvocationTargetException
    at sun.reflect.GeneratedMethodAccessor1.invoke(Unknown Source)
    at sun.reflect.DelegatingMethodAccessorImpl.invoke(DelegatingMethodAccessorImpl.java:43)
    at java.lang.reflect.Method.invoke(Method.java:498)
    at org.springframework.cglib.core.ReflectUtils.defineClass(ReflectUtils.java:459)
    at org.springframework.cglib.core.AbstractClassGenerator.generate(AbstractClassGenerator.java:336)
    ... 6 more
Caused by: java.lang.OutOfMemoryError: Metaspace
    at java.lang.ClassLoader.defineClass1(Native Method)
    at java.lang.ClassLoader.defineClass(ClassLoader.java:763)
    ... 11 more

Process finished with exit code 1
Metaspace memory error is reported, proving that the overflow of method area is related to metaspace.
The summary is as follows:
- Normal JVM tuning is to change the parameters of heap memory, stack memory and Metaspace accordingly.
- Metaspace is not in the virtual machine, but uses local memory. Therefore, by default, the size of Metaspace is limited only by local memory, but the size of Metaspace can be specified by the following parameters:
- - XX: Metaspace Size. When the initial space size reaches this value, garbage collection will be triggered for type unloading, and GC will adjust the value: if a large amount of space is released, the value will be reduced appropriately; if a small amount of space is released, the value will be increased appropriately when not more than MaxMetaspace Size.
- - XX: Max Metaspace Size, maximum space, default is unlimited.
- The string pool constant pool has only one copy in each VM. It stores the reference value of the string constant in the heap.
There are more articles, please pay attention to them and send them to us for interviews.