Java JVM operation tool
1.java
With testjvm Java as an example
vim TestJVM.java
public class TestJVM {
public static void main(String[] args) {
String str = System.getProperty("str");
if (null == str) {
System.out.println("I didn't get the parameters");
} else {
System.out.println("Got the parameters"+str);
}
}
}
javac TestJVM.java
-D set system attribute parameters (environment variables)
java -Dstr=Ha ha ha TestJVM
Server VM: the initial heap space will be larger. By default, the parallel garbage collector is used, which is slow to start and fast to run.
Client VM: relatively speaking, it will be conservative and the initial heap space will be smaller. The serial garbage collector is used to make the JVM start faster, but the running speed will be slower than the Server mode.
If the machine is a 64 bit system, the client mode (default server mode) is not supported
java -server TestJVM

java -client TestJVM
- the showversion parameter means that the version information is printed first and then the following commands are executed. It is very useful during debugging
-The X parameter is a non-standard parameter. The parameters may be different in different versions of jvm. You can view the non-standard parameters through java -X.
-In the interpreted model, - Xint flag will force the JVM to execute all bytecodes. Of course, this will reduce the running speed, usually 10 times or more.
-In Xcomp compilation mode (), all bytecodes will be compiled into local code when used for the first time, resulting in maximum optimization.
-Xmixed is the mixed mode (default): it is up to the jvm to mix the interpretation mode with the compilation mode. This is the default mode of the jvm and the recommended mode.
java -showversion -Xint TestJVM

java -showversion -Xcomp TestJVM

java -showversion -Xmixed TestJVM
-XX parameter is also a non-standard parameter, which is mainly used for jvm tuning and debug ging.
There are two ways to use, one is boolean type and the other is non boolean type.
java -showversion -XX:+DisableExplicitGC TestJVM

java -showversion -XX:-UseSerialGC TestJVM

java -showversion -XX:NewRatio=1 TestJVM
-Xms and - Xmx are the initial size and maximum size of heap memory set for the jvm, respectively. Two can be set at the same time without conflict
java -Xms512m -Xmx2048m TestJVM
View the operating parameters of the jvm
java -XX:+PrintFlagsFinal TestJVM

java -XX:+PrintFlagsFinal -version
2.jps
Take tomcat as an example (the current process id is 105246)
tar -xvf apache-tomcat-9.0.52.tar.gz
cd apache-tomcat-9.0.52/bin/
./startup.sh
View java processes through jps or jps ‐ l
jps
jps -l

20099 sun.tools.jps.Jps
105246 org.apache.catalina.startup.Bootstrap
3.jinfo
The jinfo command can view the running jvm
jinfo ‐flags 105246
4.jstat
The jstat command can view the usage of various parts of heap memory and the number of loaded classes.
View class loading statistics
jstat -class 105246
View compilation statistics
jstat -compiler 105246
View garbage collection statistics
jstat -gc 105246
5.jmap
jmap view heap memory
View memory usage
jmap -heap 105246
View the number and size of objects in memory
jmap -histo:live 105246 | more
dump the memory usage into a file (the resulting file is a binary file)
jmap ‐dump:format=b,file=/tmp/dump.dat 105246
6.jhat
Analyze the dump file through jhat
jhat -port 9999 /tmp/dump.dat
View via browser: http://192.168.168.100:9999
7.MAT
Analyze dump file through MAT
MAT (memory analyzer tool), an Eclipse based memory analysis tool, is a fast and feature rich JAVA heap analysis tool. It can help us find memory leaks and reduce memory consumption. Use the memory analysis tool to analyze from a large number of objects, quickly calculate the occupation size of objects in memory, and see who prevented the garbage collector from returning Collect work, and you can intuitively view the objects that may cause this result through the report. You can see GC ROOTS. Download address: https://www.eclipse.org/mat/downloads.php
Location and analysis of memory overflow
vim TestJvmOutOfMemory.java
import java.util.ArrayList;
import java.util.List;
import java.util.UUID;
public class TestJvmOutOfMemory {
public static void main(String[] args) {
//Implementation, add 1 million strings to the collection, and each string is composed of 1000 UUID s
List list = new ArrayList<>();
for (int i = 0; i < 1000000; i++) {
String str = "";
for (int j = 0; j < 1000; j++) {
//Constantly add new String to list
str += UUID.randomUUID().toString(); }
list.add(str);
}
System.out.println("ok");
}
}
javac TestJvmOutOfMemory.java
java -Xms8m -Xmx8m -XX:+HeapDumpOnOutOfMemoryError TestJvmOutOfMemory

java.lang.OutOfMemoryError: Java heap space
Dumping heap to java_pid78258.hprof ...
Heap dump file created [7796274 bytes in 0.031 secs]
Exception in thread "main" java.lang.OutOfMemoryError: Java heap space
 at java.util.Arrays.copyOf(Arrays.java:3332)
 at java.lang.AbstractStringBuilder.ensureCapacityInternal(AbstractStringBuilder.java:124)
 at java.lang.AbstractStringBuilder.append(AbstractStringBuilder.java:448)
 at java.lang.StringBuilder.append(StringBuilder.java:136)
 at TestJvmOutOfMemory.main(TestJvmOutOfMemory.java:13)
View current directory: ll
-rw------- 1 root root 7796274 Aug 14 16:13 java_pid78258.hprof
-rw-r--r-- 1 root root     881 Aug 14 15:34 TestJVM.class
-rw-r--r-- 1 root root     361 Aug 14 15:34 TestJVM.java
-rw-r--r-- 1 root root     922 Aug 14 16:14 TestJvmOutOfMemory.class
-rw-r--r-- 1 root root     608 Aug 14 16:10 TestJvmOutOfMemory.java
It can be seen that when memory overflow occurs, dump files to the current folder, java_pid78258.hprof
Import java_pid78258.hprof file to MAT tool for analysis:
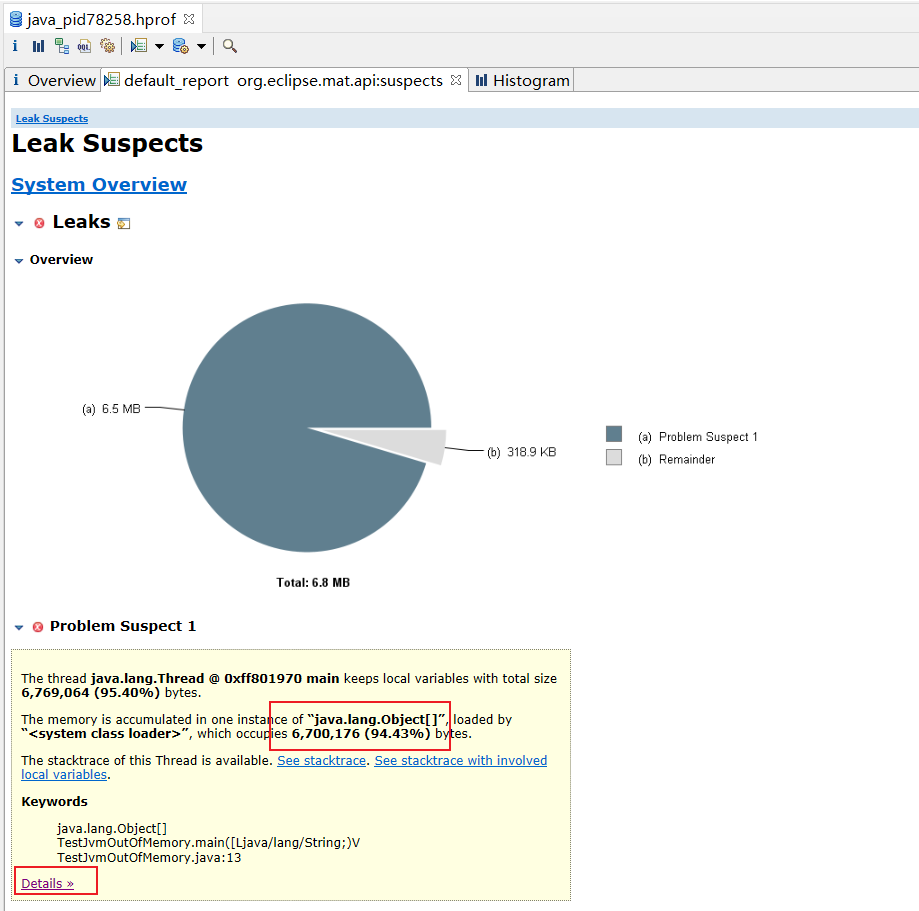
It is found that 95.40% of the memory is occupied by the Object [] array, so it is suspicious.
Analysis: this suspicion is correct because it has occupied more than 90% of the memory, which is very likely to cause memory overflow.
By looking at the details (click Details): you can see that 94.43% of the last column is occupied by a List. A large number of uuid strings are stored in the collection.
8.jstack
Used to view thread execution in the jvm.
When it is found that the CPU load of the server suddenly increases, deadlocks, dead loops, etc. because the program runs normally, there is no output, and there is no problem from the log, it is necessary to look at the execution of the internal threads of the jvm, and then analyze and find out the cause.
Deadlock problem
vim TestDeadLock.java
public class TestDeadLock {
private static Object obj1 = new Object();
private static Object obj2 = new Object();
public static void main(String[] args) {
new Thread(new Thread1()).start();
new Thread(new Thread2()).start();
}
private static class Thread1 implements Runnable {
@Override
public void run() {
synchronized (obj1) {
System.out.println("Thread1 Got it obj1 My lock!");
try {
Thread.sleep(2000);
} catch (InterruptedException e) {
e.printStackTrace();
}
synchronized (obj2) {
System.out.println("Thread1 Got it obj2 My lock!");
}
}
}
}
private static class Thread2 implements Runnable {
@Override
public void run() {
synchronized (obj2) {
System.out.println("Thread2 Got it obj2 My lock!");
try {
Thread.sleep(2000);
} catch (InterruptedException e) {
e.printStackTrace();
}
synchronized (obj1) {
System.out.println("Thread2 Got it obj1 My lock!");
}
}
}
}
}
javac TestDeadLock.java
[root@k8s101 JVM]# ll
total 7652
-rw------- 1 root root 7796274 Aug 14 16:13 java_pid78258.hprof
-rw-r--r-- 1 root root     184 Aug 14 19:33 TestDeadLock$1.class
-rw-r--r-- 1 root root     843 Aug 14 19:33 TestDeadLock.class
-rw-r--r-- 1 root root    1349 Aug 14 16:27 TestDeadLock.java
-rw-r--r-- 1 root root    1076 Aug 14 19:33 TestDeadLock$Thread1.class
-rw-r--r-- 1 root root    1076 Aug 14 19:33 TestDeadLock$Thread2.class
-rw-r--r-- 1 root root     881 Aug 14 15:34 TestJVM.class
-rw-r--r-- 1 root root     361 Aug 14 15:34 TestJVM.java
-rw-r--r-- 1 root root     922 Aug 14 16:14 TestJvmOutOfMemory.class
-rw-r--r-- 1 root root     608 Aug 14 16:10 TestJvmOutOfMemory.java
[root@k8s101 JVM]# java TestDeadLock
Thread1 Got it obj1 My lock!
Thread2 Got it obj2 My lock!
#The program is stuck here
[root@k8s101 jdk1.8.0_301]# jps 11451 Jps 8334 TestDeadLock 105246 Bootstrap [root@k8s101 jdk1.8.0_301]# jstack 8334 2021-08-14 19:35:32 Full thread dump Java HotSpot(TM) 64-Bit Server VM (25.301-b09 mixed mode): "Attach Listener" #12 daemon prio=9 os_prio=0 tid=0x00007f2280001000 nid=0x308e waiting on condition [0x0000000000000000] ...... ...... Found one Java-level deadlock: ============================= "Thread-1": waiting to lock monitor 0x00007f228c0062c8 (object 0x00000000eb85ab78, a java.lang.Object), which is held by "Thread-0" "Thread-0": waiting to lock monitor 0x00007f228c004e28 (object 0x00000000eb85ab88, a java.lang.Object), which is held by "Thread-1" Java stack information for the threads listed above: =================================================== "Thread-1": at TestDeadLock$Thread2.run(TestDeadLock.java:44) \- waiting to lock <0x00000000eb85ab78> (a java.lang.Object) \- locked <0x00000000eb85ab88> (a java.lang.Object) at java.lang.Thread.run(Thread.java:748) "Thread-0": at TestDeadLock$Thread1.run(TestDeadLock.java:25) \- waiting to lock <0x00000000eb85ab88> (a java.lang.Object) \- locked <0x00000000eb85ab78> (a java.lang.Object) at java.lang.Thread.run(Thread.java:748) Found 1 deadlock.
Thread-1 is waiting for 0x00000000eb85ab78 the lock object, and the lock is taken by Thread-0;
Thread-0 is waiting for 0x00000000eb85ab88 the lock object, and the lock is taken by Thread-1.
So it caused a deadlock.
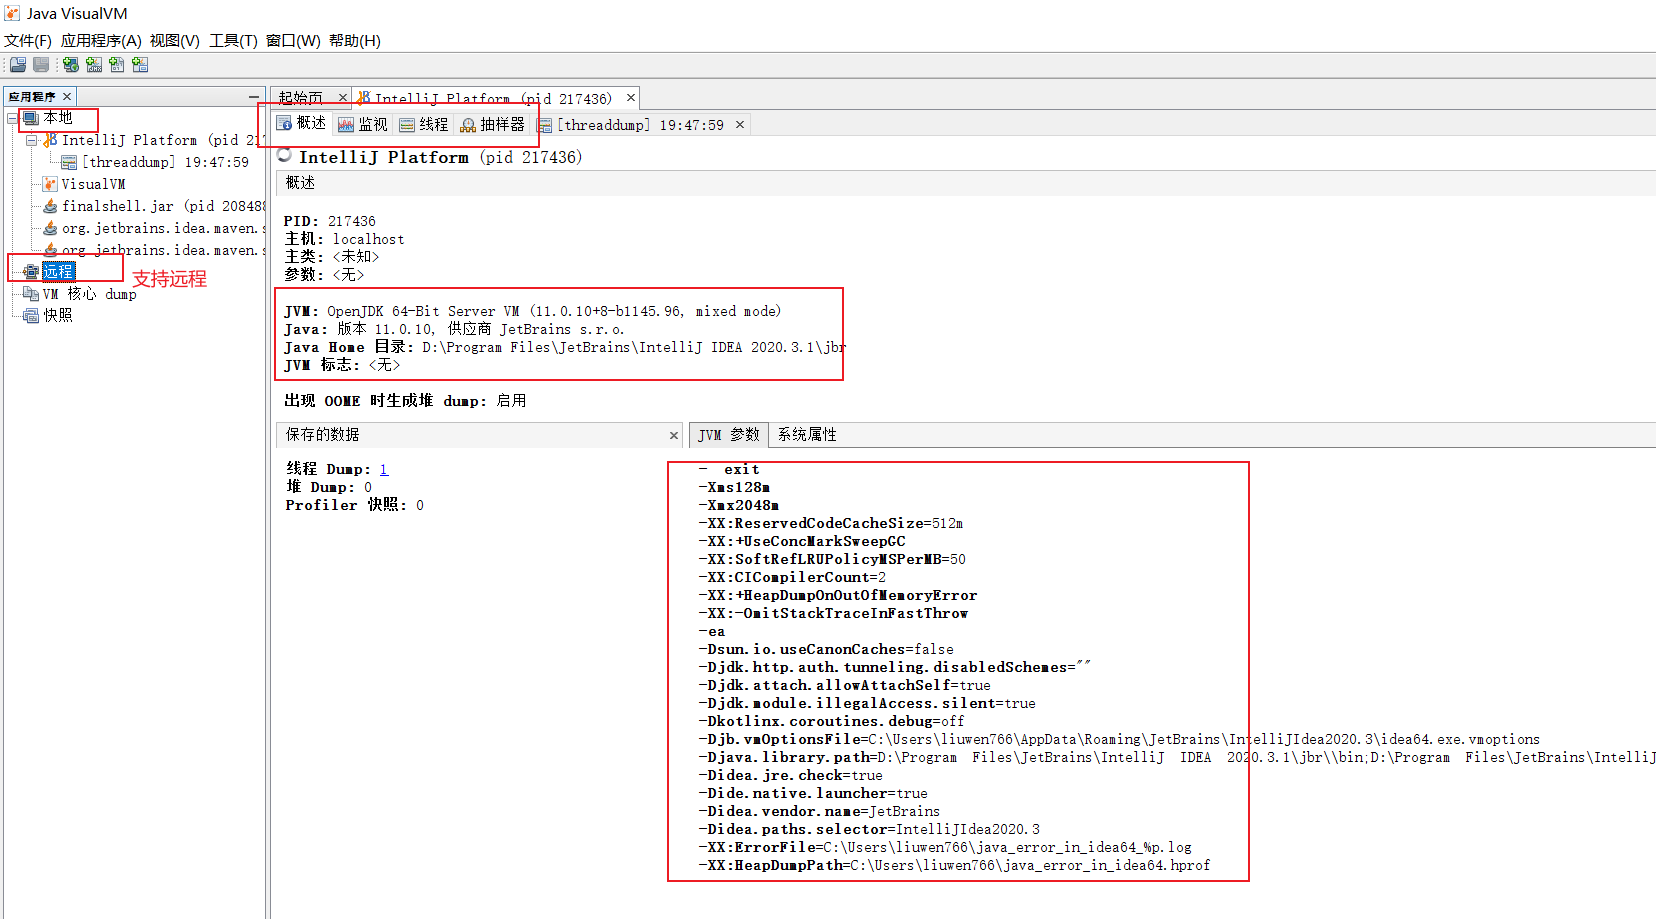
9.JVisualVM
JVisualVM, the JDK's own tool, can monitor threads and memory, view the CPU time of methods and objects in memory, and the objects that have been GC, and reverse view the allocated stack.
Visual jvm can monitor not only local jvm processes, but also remote jvm processes. It needs to be implemented with the help of JMX technology. JMX (Java Management Extensions) is a framework for implanting management functions for applications, devices and systems. JMX can flexibly develop seamless integrated system, network and service management applications across a series of heterogeneous operating system platforms, system architectures and network transmission protocols.
10.jconsole
Jconsole can also view thread usage, which can be built into jdk. He is divided into processes. Use jconsole tool to view deadlock threads: threads / click the specified thread to view the total group blocked number (how many other threads are blocked) and waiting number (waiting for other threads). Click Detect deadlock to directly detect deadlock.
Meta space memory overflow
/**
* Method area generated a memory overflow error
* : jdk8 Meta space is introduced in. The default initial size is 21m. If it exceeds 21m, the meta space virtual opportunity will conduct garbage collection. If it is not enough, the space will be expanded. The upper limit of expansion is the upper limit of physical memory.
* This test uses cglib to demonstrate meta space memory errors.
* During startup, modify vm parameter: - XX:MaxMetaspaceSize=10m.
*/
public class TestMetaspace {
public static void main(String[] args) {
//During the running process of the program, it will constantly create test Class and place it in the meta space
for(;;) {
Enhancer enhancer=new Enhancer();
enhancer.setSuperclass(Test4.class);
enhancer.setUseCache(false);
enhancer.setCallback((MethodInterceptor)(obj,method,arg1,proxy)->
proxy.invokeSuper(obj, arg1));
System.out.println("hello world");
enhancer.create();
}
}
}
Error in program running result:
java.lang.OutOfMemoryError: Metaspace Meta space memory overflow