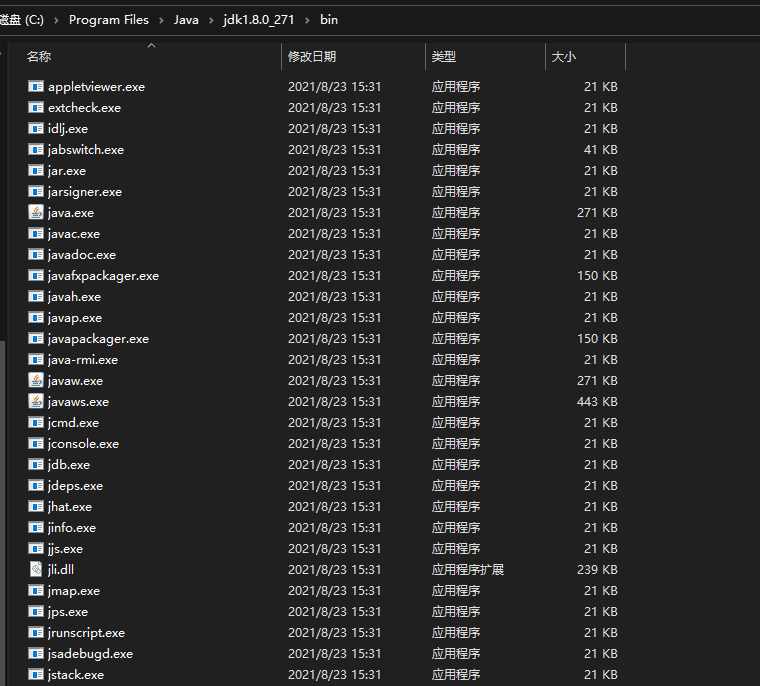
JDK comes with many common tools, and we conduct some performance monitoring and debugging
Under the bin target of JDK for Windows tools, Linux still has relevant commands
JVM tools can be classified according to the form of use
- Command line tools
- jps
- jstat
- jinfo
- Visualization tools
Command line tools
jps: JVM Process Status Tool lists the running virtual machine processes
jps [options] [hostid]

[options]:
-q: Display process ID
-m: Display process ID,Main class name, incoming Main Method
-l: Display process ID,Fully qualified name of main class(Quickly learn what the project is)
-v: Display process ID,Main class name JVM parameter
-V: Display process ID,Main class name (-V Equivalent to default without options of jps)

options Can be combined arbitrarily

[hostid]
hostname:port For example: 127.0.0.1:8080
jstat: JVM Statistics Monitoring Tool monitors the running status information of various virtual machines (class loading, memory, garbage phones, JIT compilation, etc.)
jstat [options] [vmid] [interval] [count]

[options] Can pass jstat -options View all options
-class: Displays statistics for class loading
-compiler: Java HotSpot VM Timely compiler statistics
-gc: Displays statistics about garbage collection heap behavior
-gcutil: Percentage of statistics showing garbage collection heap behavior
....

-class

[vmid]
Virtual machine process ID  (Can pass jps -l get)  If a remote virtual machine requires a process ID@IP:port

[interval](No, but if it's passed count,Recommended pass sample interval!)
Sampling interval(The default unit is milliseconds),The unit can be seconds or milliseconds (the unit needs to be added manually, such as 30) s It's 30 seconds, 300 ms That's 300 milliseconds)

[count]((optional)
Number of sampling cycles
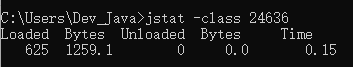
Number of Loaded classes, number of Kb Loaded by Bytes, number of Unloaded classes, number of Kb Unloaded by Bytes, and Time
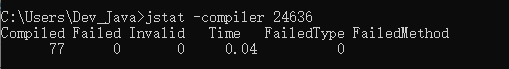
The number of Compiled tasks, the number of Failed compilation tasks, the number of invalid compilation tasks, the execution Time of Time, the compilation type of FailedType that Failed last Time, and the compilation class name and method of FailedMethod that Failed last Time

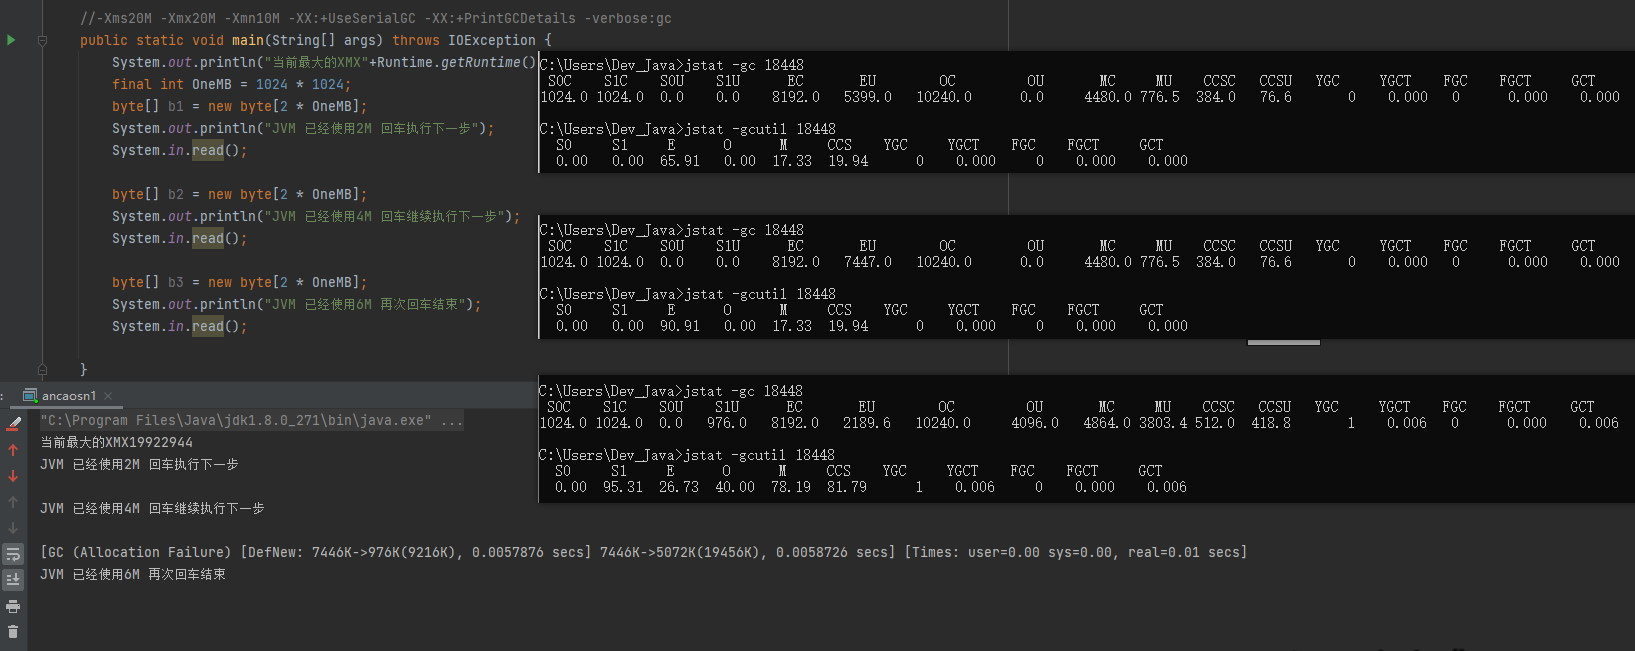
S0C and S1C are the total memory capacity of surviving areas 0 and 1 respectively, S0U and S1U are the memory usage of surviving areas 0 and 1 respectively, EC and EU represent the total memory capacity and usage of eden area, OC and OU represent the total consumption and usage of the elderly generation, MC and MU represent the total consumption and usage of the original space, CCSC and CCSU: compressed space capacity, usage of compressed space YGC and YGCT represent the number and time of Young GC execution, FGC and FGCT: the number and time of Full GC execution, and GCT: the total garbage collection time

S0 and S1 represent the memory usage proportion of 0 and 1 in the surviving area, E and O and M represent the memory usage proportion of Eden and the elderly generation and meta space in turn, CCS represents the memory usage proportion of class space compression, YGC and YGCT represent the execution times and time of Young GC, FGC and FGCT: the execution times and time of Full GC, and GCT: the total garbage collection time
jstat view heap memory experiment case
Other methods: https://www.zanglikun.com/481.html#Heap_Memory
    //-Xms20M -Xmx20M -Xmn10M -XX:+UseSerialGC -XX:+PrintGCDetails -verbose:gc
    public static void main(String[] args) throws IOException {

        final int OneMB = 1024*1024;
        Byte[] b1 = new Byte[2*OneMB];
        System.out.println("JVM Already used 2 M Press enter to proceed to the next step");
        System.in.read();

        Byte[] b2= new Byte[2*OneMB];
        System.out.println("JVM Already used 4 M Press enter to continue to the next step");
        System.in.read();

        Byte[] b3= new Byte[2*OneMB];
        System.out.println("JVM Already used 6 M Enter again");
        System.in.read();

    }
Here are the results:
jstat -gc PID

# View GC usage percentage
jstat -gcutil PID
This is what I recorded using the Idea plug-in VisualGC. It is convenient to understand the use of jstat here
We can clearly see from the figure that before b3 array new comes out, the memory is no longer allowed after new comes out, so the JVM executes GC once.
Special instructions: The brilliance of solving problems hides the pain of knocking bugs. All things enter samsara, and no one can escape! The above articles are my actual operation and written notes. There will be no full-text embezzlement of other people's articles! Please don't embezzle directly!