The recent working day is not peaceful. I found that I haven't calmed down to concentrate on writing for a long time. However, I still insisted on using my spare time to learn a lot of things in micro classes. I found that the things summarized by the bosses are still different. Compared with those boring textbooks in college, the contents summarized by the bosses are more vivid and easier to understand. I will digest and absorb the things of the big guys, turn them into my own things, and express them in words.
What I want to summarize today is the test tool JMH and Java runtime monitoring tool Arthas used in recent work. They are also a great help in my actual work. So here's how to use these tools. At the same time, deepen your familiarity with these tools. For these two tools, I will first briefly introduce the general usage scenarios of these tools, and then use a real performance problem troubleshooting example to explain the actual usage of these two tools in detail. Don't say much, go straight to the subject.
Problem description
In order to make my later examples run through the use of these two tools, I first briefly describe the actual performance problems we encounter in development. Then we will introduce the actual use of these two performance tools to see how we can successfully locate the performance bottleneck using these two tools.
The problem is as follows: in order to support the loss rate, we modified the original method of Async + custom Appender of log4j2, and put the asynchronous logic into our revised Appender. However, we found that the modified log performance is much lower than that of the previous Async + custom Appender. Here, for privacy reasons, I did not use the example in the actual company. Here, I used another way that can also reflect the problem. For the time being, we will not give the specific configuration file, but the performance test code and results
code
package com.bryantchang.appendertest;

import org.slf4j.Logger;
import org.slf4j.LoggerFactory;

public class AppenderTest {

    private static final String LOGGER_NAME_DEFAULT = "defaultLogger";
    private static final String LOGGER_NAME_INCLUDE = "includeLocationLogger";
    private static final Logger LOGGER = LoggerFactory.getLogger(LOGGER_NAME_INCLUDE);
    public static final long BATCH = 10000;

    public static void main(String[] args) throws InterruptedException {
        while(true) {
            long start, end;
            start = System.currentTimeMillis();
            for (int i = 0; i < BATCH; i++) {
                LOGGER.info("msg is {}", i);
            }
            end = System.currentTimeMillis();
            System.out.println("duration of " + LOGGER_NAME_INCLUDE +  " is " + (end - start) + "ms");
            Thread.sleep(1000);
        }
    }
}
The code logic is very simple, that is, call logger.info to print 10000 logs each time, and then record the time-consuming. The comparison between the two is as follows
From these two pictures, we can see the same logic. The time difference between the two programs is dozens of times, but looking at the pictures, it seems that the name of logger is only different. Analyzing the above experimental results, we may have two questions
- Whether the above code test is standard and standard
- If it's really a performance problem, which method has such a big gap between the two codes, resulting in the final performance difference
The following two tools will answer these two questions respectively
Introduction to JMH
The first question is whether the test method is standard. When we write code, we use the method of dead loop + pinching the stopwatch before and after. If we want to add a multi-threaded test, we also need to build a thread pool. In addition to the logic of the code itself, we should also care about the logic of the test. We wonder if there is a tool that can completely liberate us from the test logic, and only care about the code logic we need to test. JMH is such a Java testing framework. The following is the official definition of JMH
JMH Is a face Java Language or other Java Performance benchmarking framework for virtual machine language
What we need to pay attention to here is that the method tested by JMH is as simple as possible, and the less dependence is the better. The most suitable scenario is to test the performance of two sets of put and get, such as the comparison between ArrayList and LinkedList. Here, we need to test the time required for batch logging, which is basically consistent with the test scenario using JMH. The following is the test code, bench framework code and main function.
- Method to be tested
public class LogBenchMarkWorker {

    private LogBenchMarkWorker() {}

    private static class LogBenchMarkWorkerInstance {
        private static final LogBenchMarkWorker instance = new LogBenchMarkWorker();
    }

    public static LogBenchMarkWorker getInstance() {
        return LogBenchMarkWorkerInstance.instance;
    }

    private static final String LOGGER_DEFAULT_NAME = "defaultLogger";
    private static final String LOGGER_INCLUDE_LOCATION = "includeLocationLogger";
    private static final Logger LOGGER = LoggerFactory.getLogger(LOGGER_DEFAULT_NAME);
    private static long BATCH_SIZE = 10000;

    public void logBatch() {
        for (int i = 0; i < BATCH_SIZE; i++) {
            LOGGER.info("msg is {}", i);
        }
    }
}
It can be seen that the method to be tested is very simple, that is, printing 10000 logs in a single batch at one time, so there is no part requiring additional description. Next, let's look at the benchmark section.
public class LogBenchMarkMain {

    @Benchmark
    @BenchmarkMode(Mode.AverageTime)
    @Fork(value = 1)
    @Threads(1)
    public void testLog1() {
        LogBenchMarkWorker.getInstance().logBatch();
    }

    @Benchmark
    @BenchmarkMode(Mode.AverageTime)
    @Fork(value = 1)
    @Threads(4)
    public void testLog4() {
        LogBenchMarkWorker.getInstance().logBatch();
    }

    @Benchmark
    @BenchmarkMode(Mode.AverageTime)
    @Fork(value = 1)
    @Threads(8)
    public void testLog8() {
        LogBenchMarkWorker.getInstance().logBatch();
    }

    @Benchmark
    @BenchmarkMode(Mode.AverageTime)
    @Fork(value = 1)
    @Threads(16)
    public void testLog16() {
        LogBenchMarkWorker.getInstance().logBatch();
    }
In this code, we will find some unique things in JMH, which I will briefly introduce below.
Benchmark Note: it is marked on a specific method, indicating that this method will be the smallest method to be tested JMH Become a OPS
BenmarkMode:Test type, JMH Several different are provided Mode
    Throughput:Overall throughput
    AverageTime:Average call time, per call OPS Time of execution
    SampleTime:Take samples and give different proportions ops Time, e.g. 99%of ops Time, 99.99%of ops time
fork: fork The number of times, if set to 2, JMH meeting fork There are two processes to test
Threads: It is easy to understand that this parameter indicates how many threads the method is executed at the same time
In the above code, I defined four methods to be tested. The Fork and BenchmarkMode of the methods are the average time of testing a single OPS, but the number of threads of the four methods is different. In addition to these parameters, there are also several parameters. I will talk about them in the main function. The main code is as follows
public class Main {
    public static void main(String[] args) throws RunnerException {
        Options options = new OptionsBuilder()
                .include(LogBenchMarkMain.class.getSimpleName())
                .warmupIterations(5)
                .measurementIterations(5)
                .output("logs/BenchmarkCommon.log")
                .build();
        new Runner(options).run();
    }
}
We can see that in the main function, we want to set the basic configuration of JMH. The meanings of several configuration parameters are as follows:
include:benchmark The name of the class, you can use regular expression
warmupIteration:The number of warm-up iterations. The reason why warm-up is due to JIT With the running of the code, the running of the code will be dynamically optimized. Therefore, in the test process, you need to preheat several rounds to make the code run stably before the actual test
measurementIterations:Actual test rounds
output:Test report output location
I run the test with two logger s to see the comparison of performance test reports
Use normal logger
LogBenchMarkMain.testLog1   avgt    5  0.006 ± 0.001   s/op
LogBenchMarkMain.testLog16  avgt    5  0.062 ± 0.026   s/op
LogBenchMarkMain.testLog4   avgt    5  0.006 ± 0.002   s/op
LogBenchMarkMain.testLog8   avgt    5  0.040 ± 0.004   s/op
Include is used_ logger for location
LogBenchMarkMain.testLog1   avgt    5  0.379 ± 0.007   s/op
LogBenchMarkMain.testLog16  avgt    5  1.784 ± 0.670   s/op
LogBenchMarkMain.testLog4   avgt    5  0.378 ± 0.003   s/op
LogBenchMarkMain.testLog8   avgt    5  0.776 ± 0.070   s/op
Here we see that the performance gap is emerging. Use include_ The performance of location is significantly lower than that of ordinary logger. We must be very curious and ask "where is the slow"!!
Arthas, what exactly does my code do at runtime
Arthas is a Java debugging artifact open source by Alibaba. It is similar to greys, but has more powerful functions than greys. For example, it can directly draw the flame diagram of Java method calls. The principle of both tools is to use the powerful bytecode technology of Java. After all, I'm not a JVM boss, so the specific implementation details can't be expanded. What we have to do is stand on the shoulders of giants, accept and skillfully use these useful performance monitoring tools.
Actual operation
Talk is soap, show me your code. Since it is a tool, we can directly carry out the actual operation. We run our initial program locally, and then explain how to use arthas.
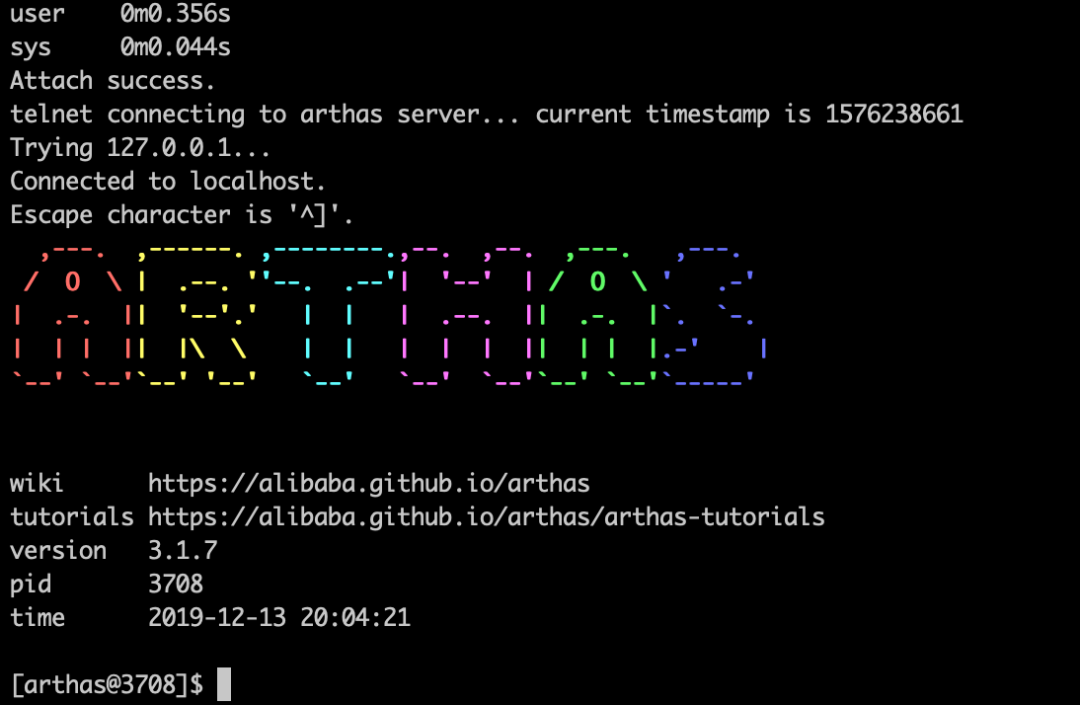
We first find the process number of the program through jps, then directly enhance the bytecode of our running program through as.sh given by arthas, and then start arthas. The command is as follows
./as.sh pid
It can be seen that arthas supports viewing the current jvm status, viewing the current thread status, monitoring the call time of some methods, trace, profile, generating flame diagram, etc. we only have a few commonly used commands here. For other commands, if you are interested, please refer to the official website of arthas. This article mainly introduces the following functions
- Decompile code
- Monitor the call of a method
- View the call and return value of a method
- trace a method
Monitoring method call
The main command is monitor. According to the introduction on the official website, the commonly used methods are
monitor -c duration className methodName
Among them, duration represents the display of statistical results every few seconds, that is, a single statistical cycle. className is the fully qualified name of the class and methodname is the name of the method. The method we view here is the info method of the logger class. We use two different info methods of the logger respectively. The class in this class is org.slf4j.Logger. When the method is info, our monitoring statement is
monitor -c 5 org.slf4j.Logger info
The monitoring results are as follows:
- Use normal appender
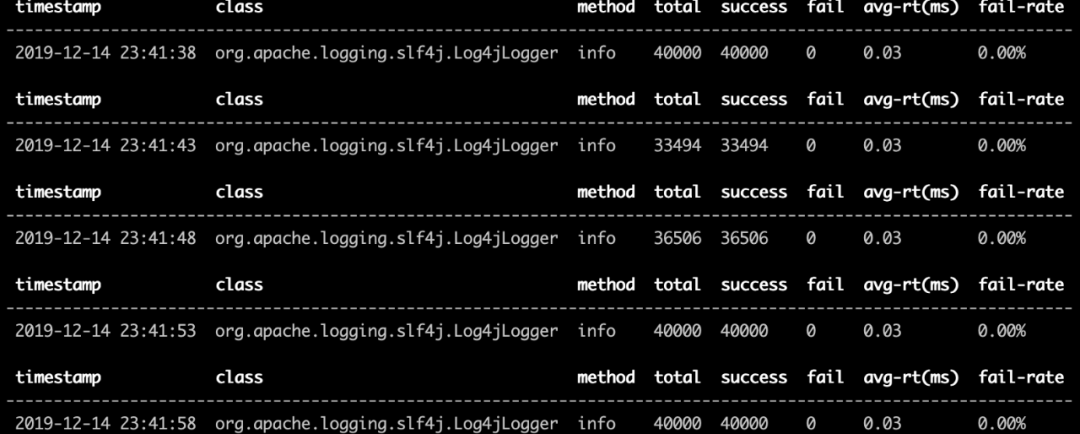
We can see that the log printing method using include appender is three times higher than that of ordinary appender, which makes us wonder how long each step of these two methods takes. Let's introduce the second command, the trace method.
trace Command & JAD command
The log4j2 configuration files of these two programs are as follows
<?xml version="1.0" encoding="UTF-8"?>
<!--status: Log level   monitorInterval: The time interval, in seconds, between profile updates-->
<configuration status="warn" monitorInterval="30">
    <!--Define all appender -->
    <appenders>
        <!--Configuration of this output console -->
        <Console name="console" target="SYSTEM_OUT">
            <!--Console output only level And above( onMatch),Other direct rejection( onMismatch) -->
            <ThresholdFilter level="warn" onMatch="ACCEPT" onMismatch="DENY"/>
            <!--Log print format -->
            <PatternLayout pattern="[%d{HH:mm:ss.SSS}] [%-5p] %l - %m%n"/>
        </Console>


        <Async name="AsyncDefault" blocking="false" includeLocation="false">
            <AppenderRef ref="fileAppender"/>
        </Async>

        <Async name="AsyncIncludeLocation" blocking="false" includeLocation="true">
            <AppenderRef ref="fileAppender"/>
        </Async>

        <!--The file will print out all the information, this log The program will be emptied automatically every time it is run, and the append Attribute decision, which is also very useful and suitable for temporary testing -->
        <!--append by TRUE Indicates that the message is added to the specified file, false Indicates that the message overwrites the specified file content. The default value is true -->
        <File name="fileAppender" fileName="log/test.log" append="false">
            <PatternLayout pattern="[%d{HH:mm:ss.SSS}] [%-5p] %l - %m%n"/>
        </File>

        <!--Add filter ThresholdFilter,You can selectively output categories above a certain level  onMatch="ACCEPT" onMismatch="DENY"It means to accept the match,Otherwise, refuse directly  -->
        <File name="ERROR" fileName="logs/error.log">
            <ThresholdFilter level="error" onMatch="ACCEPT" onMismatch="DENY"/>
            <PatternLayout pattern="[%d{yyyy.MM.dd 'at' HH:mm:ss z}] [%-5p] %l - %m%n"/>
        </File>

        <!--This will print out all the information, each time the size exceeds size,Then this size Logs of size are automatically saved by year-The folder created in the month is compressed as an archive -->
        <RollingFile name="rollingFile" fileName="logs/app.log"
                     filePattern="logs/$${date:yyyy-MM}/web-%d{yyyy-MM-dd}.log.gz">
            <PatternLayout pattern="[%d{yyyy-MM-dd HH:mm:ss}] [%-5p] %l - %m%n"/>
            <Policies>
                <TimeBasedTriggeringPolicy modulate="true" interval="1"/>
            </Policies>
            <DefaultRolloverStrategy>
                <Delete basePath="logs" maxDepth="2">
                    <IfFileName glob="*/*.log.gz" />
                    <IfLastModified age="7d" />
                </Delete>
            </DefaultRolloverStrategy>
        </RollingFile>
    </appenders>

    <!--Then define logger,Only defined logger And introduced appender,appender Will take effect -->
    <loggers>
        <!--Filter out spring and mybatis Some useless DEBUG information-->
        <logger name="defaultLogger" additivity="false">
            <appender-ref ref="AsyncDefault"></appender-ref>
        </logger>

        <logger name="includeLocationLogger" additivity="false">
            <appender-ref ref="AsyncIncludeLocation"></appender-ref>
        </logger>

        <!--Create a default root of logger -->
        <root level="INFO">

        </root>
    </loggers>

</configuration>
We all use an asyncappender and apply a fileappender. When we check the fileappender, we find that the two are the same and there is no difference at all. Only one option in asyncappender is different, that is, includeLocation, one is false and the other is true. As for the meaning of this parameter, we won't discuss it for the time being. Now we know that the problem may be in asyncappender, But how do we verify it? The trace command is of great use.
The basic usage of the trace command is similar to that of monitor. One of the main parameters is - n, which means how many times to trace
trace -n trace_times className methodName
I mentioned in my previous blog about Log4j2 that the core method of any appender is its append method, so we trace the append methods of the two programs respectively.
trace -n 5 org.apache.logging.log4j.core.appender.AsyncAppender append
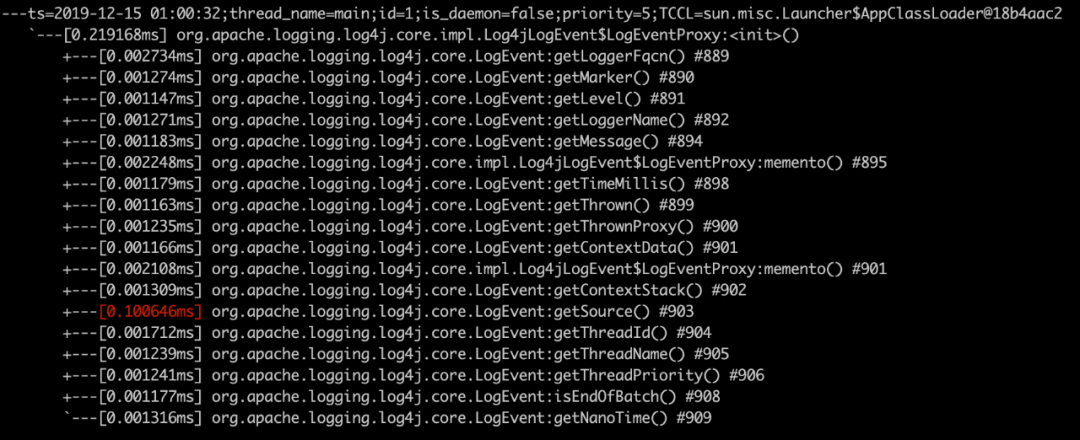
trace results are as follows
- Use normal appender
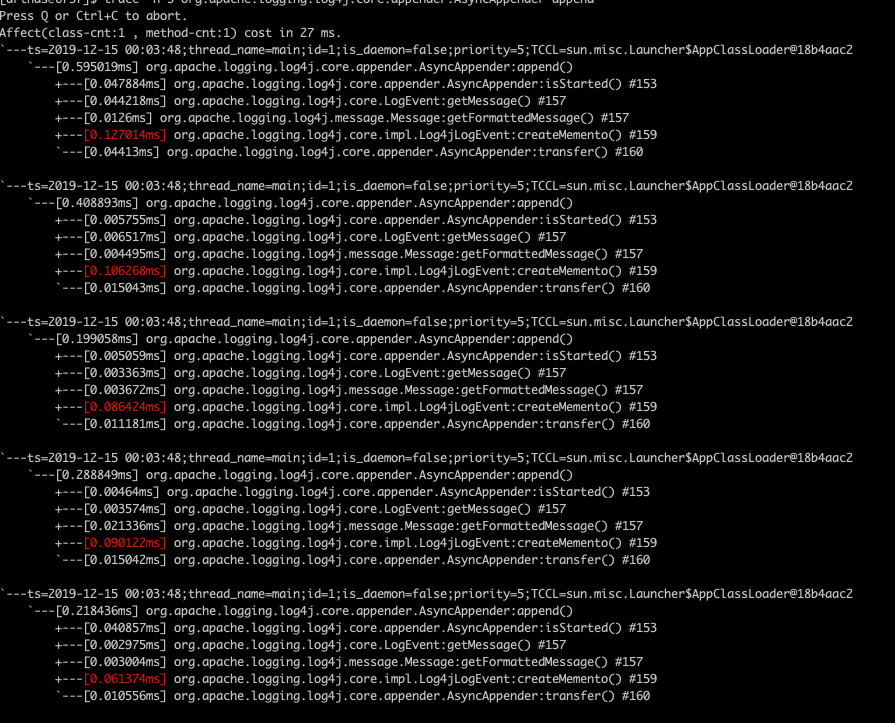
We can immediately find that the hot methods of the two trace s are different. In the appender using include, the most time-consuming method is the createMemento method in the org.apache.logging.log4j.core.impl.Log4jLogEvent class. Then how can we know what this method does? Let's ask our next common command jad, which can decompile the corresponding method Code. Here we jad look at the createMemento method mentioned above. The command is very simple
jad org.apache.logging.log4j.core.impl.Log4jLogEvent createMemento
give the result as follows

watch command
The watch command can observe the input parameters, return values and other information of a specific method. We can use this command to check the input parameters of the createMemento method. If the input parameters of the two programs are different, we can basically conclude that this is the reason for the command as follows
watch org.apache.logging.log4j.core.impl.Log4jLogEvent createMemento "params" -x 2 -n 5 -b -f
The parameters here have the following meanings
-x Parameter expansion hierarchy
-n Number of executions
-b View status before method call
-f After method call
param stands for viewing the call parameter list of the method. For other monitoring items, see the official website
The final watch results are as follows
- Use normal logger
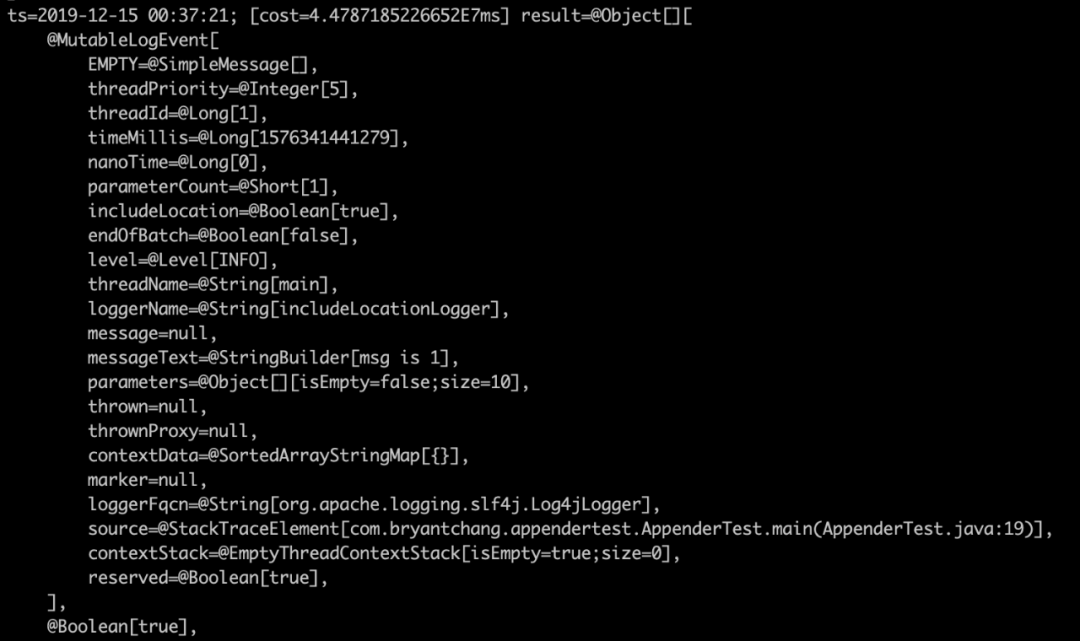
Sure enough, the two parameters are true and false. Let's take a brief look at how this parameter is passed in. Let's jad look at the append method of AsyncAppender

However, in order to find out, I followed this code statically
This includeLocation will be used in the createMemento of event. A LogEventProxy will be created when serializing the generated object. The code is as follows
public LogEventProxy(final LogEvent event, final boolean includeLocation) {
    this.loggerFQCN = event.getLoggerFqcn();
    this.marker = event.getMarker();
    this.level = event.getLevel();
    this.loggerName = event.getLoggerName();

    final Message msg = event.getMessage();
    this.message = msg instanceof ReusableMessage
            ? memento((ReusableMessage) msg)
            : msg;
    this.timeMillis = event.getTimeMillis();
    this.thrown = event.getThrown();
    this.thrownProxy = event.getThrownProxy();
    this.contextData = memento(event.getContextData());
    this.contextStack = event.getContextStack();
    this.source = includeLocation ? event.getSource() : null;
    this.threadId = event.getThreadId();
    this.threadName = event.getThreadName();
    this.threadPriority = event.getThreadPriority();
    this.isLocationRequired = includeLocation;
    this.isEndOfBatch = event.isEndOfBatch();
    this.nanoTime = event.getNanoTime();
}
If includeLocation is true, the getSource function will be called to follow in and check. The code is as follows
    public StackTraceElement getSource() {
        if (source != null) {
            return source;
        }
        if (loggerFqcn == null || !includeLocation) {
            return null;
        }
        source = Log4jLogEvent.calcLocation(loggerFqcn);
        return source;
    }
     public static StackTraceElement calcLocation(final String fqcnOfLogger) {
        if (fqcnOfLogger == null) {
            return null;
        }
        // LOG4J2-1029 new Throwable().getStackTrace is faster than Thread.currentThread().getStackTrace().
        final StackTraceElement[] stackTrace = new Throwable().getStackTrace();
        StackTraceElement last = null;
        for (int i = stackTrace.length - 1; i > 0; i--) {
            final String className = stackTrace[i].getClassName();
            if (fqcnOfLogger.equals(className)) {
                return last;
            }
            last = stackTrace[i];
        }
        return null;
    }
We can see that he will look for the code line calling this method from the whole call stack, and its performance can be imagined. We use arthas to monitor and verify it.
First, we use the trace critemeento method
trace -n 5 org.apache.logging.log4j.core.impl.Log4jLogEvent createMemento

trace -n 5 org.apache.logging.log4j.core.impl.Log4jLogEvent serialize

trace -n 5 org.apache.logging.log4j.core.impl.Log4jLogEvent$LogEventProxy <init>
trace -n 5 trace -n 5 org.apache.logging.log4j.core.LogEvent getSource

So far, we have identified an online performance problem by combining JMH and arthas. However, what I introduced is just the tip of the iceberg. I hope you can understand and practice more common commands through the official website. After several personal practices, this tool will become familiar.
Source: bryantchang.github.io/2019/12/08/java-profile-tools/