1. Parameter type of JVM
Tools documentation https://docs.oracle.com/javase/8/docs/technotes/tools/unix/
1. Standard parameters
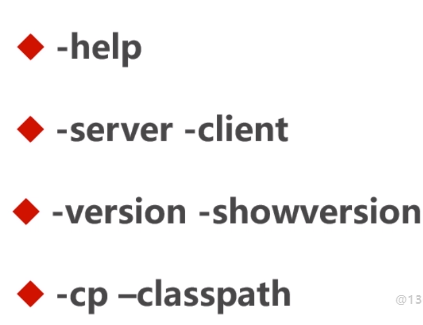
2. - X parameters

Nonstandard parameter: it may be different in different versions of JVM
java defaults to mixed mode
For example, change java mode to interpretation mode: java -Xint -version
3. XX parameter
boolean type
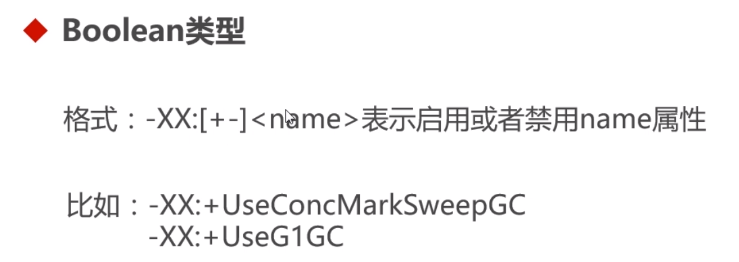
That is, if + plus sign is start, if - minus sign is disable
Non Boolean type
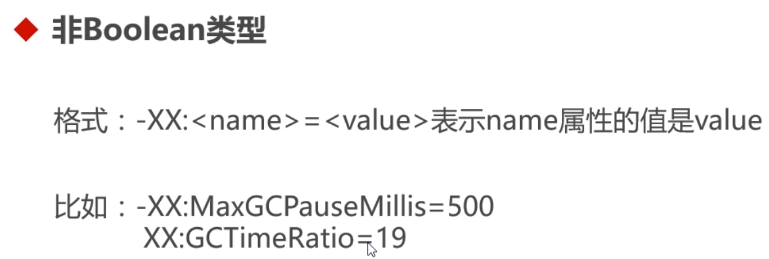
-Xmx -Xms
That is, set the maximum and minimum memory of the JVM

For example, xss sets the stack with a XX type parameter
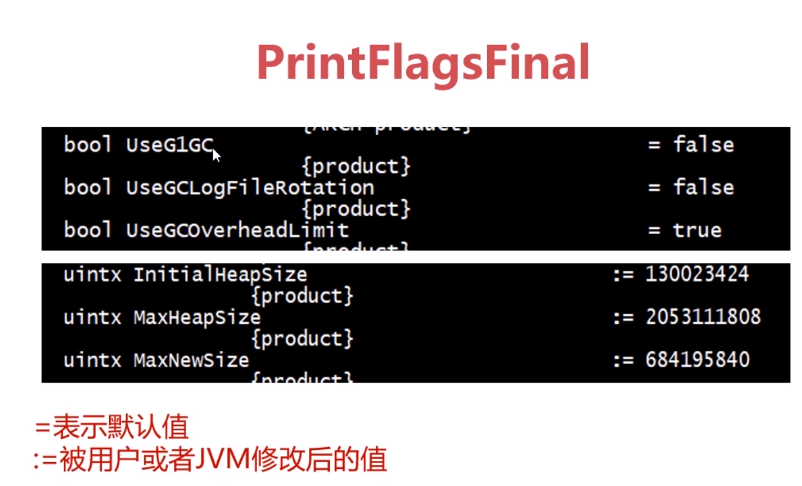
View JVM runtime parameters

printFlagsInitial initial
printFlagsFinal is the final value

printFlagsFinal is the final value
jps
jps commands for viewing java processes
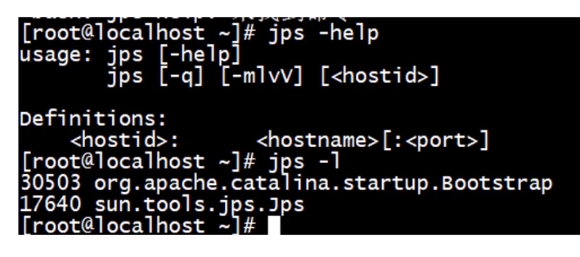
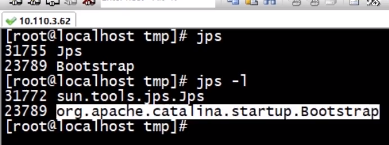
That is, jps-L plus a small L will know the complete class name of the corresponding process
All commands of jps use documents
https://docs.oracle.com/javase/8/docs/technotes/tools/unix/jps.html
jinfo
jinfo can view the running

Non default VM flags shows all manually assigned attributes
jinfo example
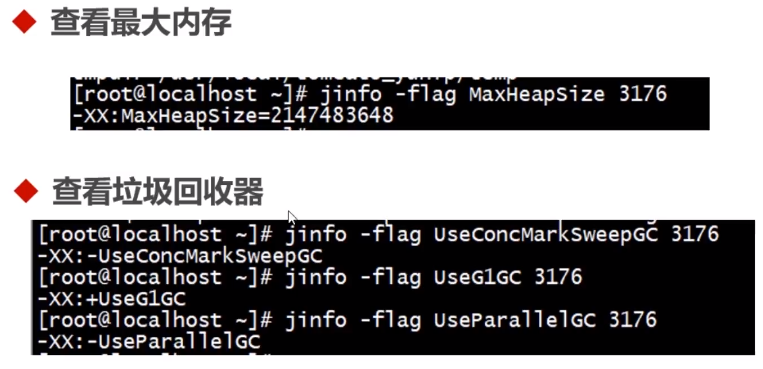
jstat viewing JVM statistics
Such as class loading, garbage collection, JIT compilation
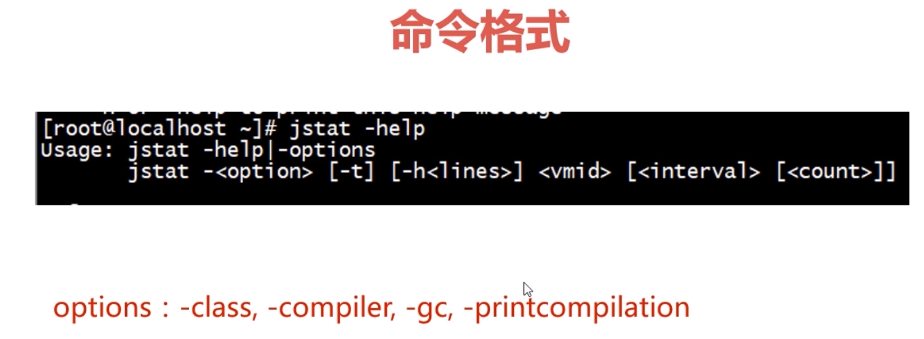
Command format
Class loading

1000 10 is output 10 times per 1000 milliseconds, that is, 10 times per second.
garbage collection

-gc output results
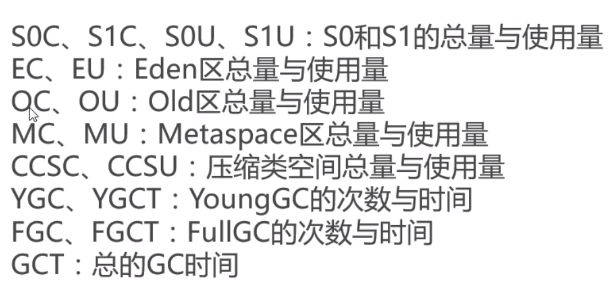
Memory structure of jvm
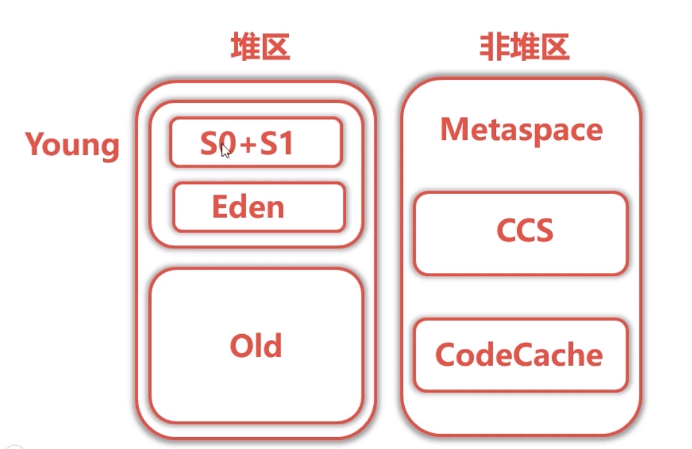
The non heap area is the local memory of the operating system, which is independent of the heap area
CCS enables short pointers, such as pointing to its own objects and pointing to its own Class
CodeCache is the code information of jit, that is, java code is converted to native code. If you don't open it, it's empty
JIT compilation

Export memory image file
Export memory image to solve the problem of memory overflow
Memory overflow auto export
When memory overflow occurs, the jvm automatically exports

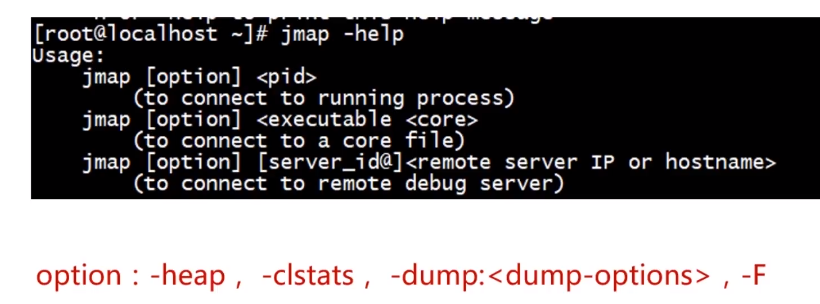
Export manually using jmap command
For example, jmap -dump:format=b,file=heap.hprof 86224
You can dump the corresponding process into a file
pid can be viewed through jsp-l
Using MAT to analyze memory overflow based on memory image file
MAT Download
http://www.eclipse.org/mat/downloads.php
Using mat to import the previous hprof file for careful analysis can find out the memory overflow
jstack and thread state
jstack can view the running thread status,
For example, if the CPU is very high, it may be a dead cycle, and then check which thread is causing the problem
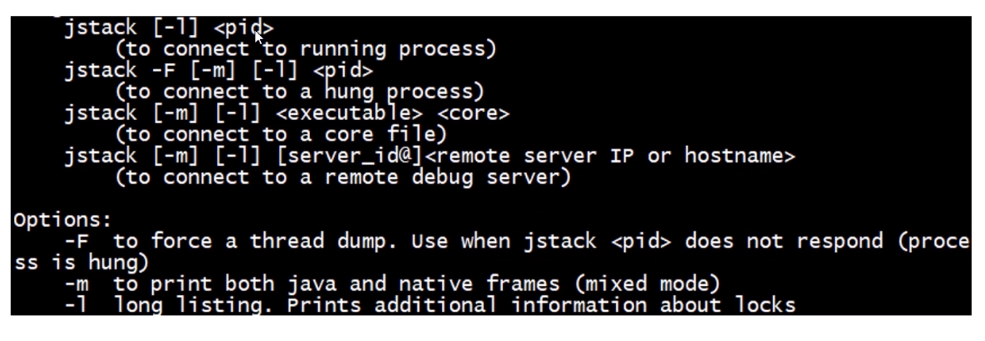
Such as execution
Jstack 15764 > 15764.txt gives the thread information to the exported file, and then it can be analyzed
Thread state and transition
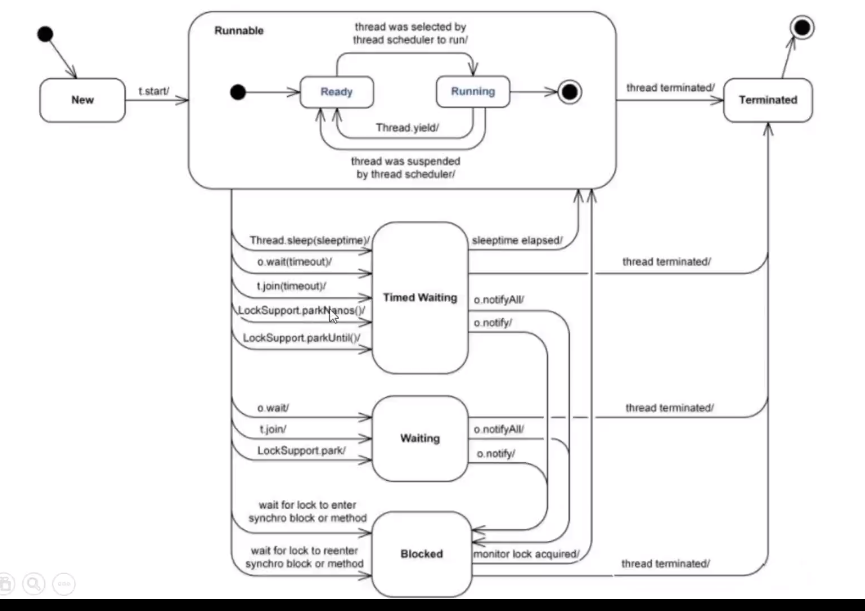
java thread status
https://docs.oracle.com/javase/8/docs/technotes/guides/troubleshoot/tooldescr034.html
java thread state transformation:
https://mp.weixin.qq.com/s/GsxeFM7QWuR--Kbpb7At2w
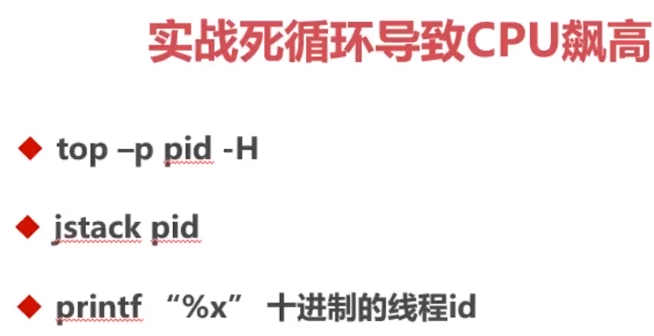
That is, when there is a dead cycle, the CPU will be very high.
1. With the top command, you can see the process with high CPU, that is, the corresponding pid
2. Then use the PID seen in the first step to execute top-p pid-h
3. Convert the CPU pid to decimal pid using printf "% X"
4. Execute "Jack pid > XX. TXT" to export the pid information of high CPU to a file
5. Find the corresponding thread in xx.txt with the decimal pid of step 3
With the stack information of the thread, you can check whether there is a dead cycle in the execution of that part of the code
In the same way, deadlock is the same as solving the dead cycle, using the "Jack PID > xx.txt"
Just look at the content (you can see whether there is deadlock information at the end of the file)
Visual monitoring based on JVisualVM
JVisualVM is a tool that comes with jdk. You can find it under jdk/bin
The function is the same as that of Jack and mat. This is a graphical interface, which can be used without any command
Install plug-ins such as Visual GC plug-ins
Reference https://blog.csdn.net/ljllxk001/article/details/97016520
https://blog.csdn.net/WilliamHaoW/article/details/86243807
Visaul GC, you can refer to the detailed GC information and memory usage, very detailed. However, remote access does not support JMX mode. jstatd mode must be used
Visaul MBeans, jmx management interface, can manage all MBeans in the application. If spring is used, the bean s can be exposed through jmx integration of spring, and the configuration of various applications can be modified in real time.
Profile, cpu and memory performance analysis can filter the classes that do not need to be monitored according to the package name
BTrace, you can debug the code without downtime. You can right-click trace application G on visual VM Open BTrace window (local jvm only)
--------
Copyright notice: This is the original article of CSDN blogger "haoclassmate", following CC 4.0 BY-SA copyright agreement. Please attach the original source link and this notice for reprint.
Original link: https://blog.csdn.net/william haow/article/details/86243807
Monitoring remote java processes such as Tomcat
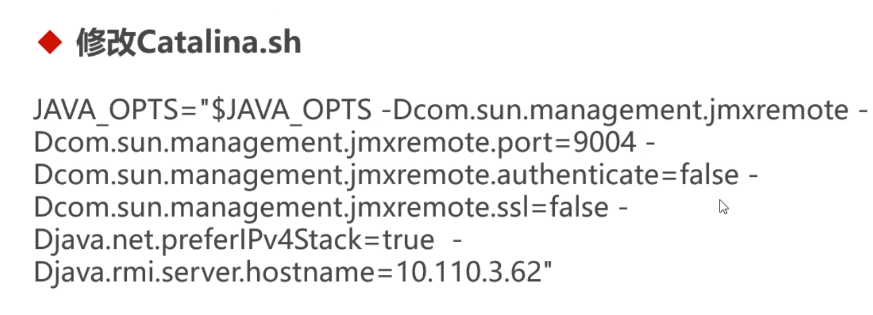
hostname is the IP address of the remote host. Please configure the port and IP address
Or reference https://jingyan.baidu.com/article/ff411625b5761e12e5823745.html
Solution: 1. Find the catalina.sh file on the server, and add the following content on the line of the file:

CATALINA_OPTS="$CATALINA_OPTS -Dcom.sun.management.jmxremote -Djava.rmi.server.hostname=192.168.1.2 -Dcom.sun.management.jmxremote.port=8888 -Dcom.sun.management.jmxremote.ssl=false -Dcom.sun.management.jmxremote.authenticate=false"

Then start the tomcat process
Note that hostname is the IP address of the current tomcat machine
Monitoring remote common java processes

Namely
[root@localhost soft]# java -Dcom.sun.management.jmxremote -Djava.rmi.server.hostname=192.168.230.250 -Dcom.sun.management.jmxremote.port=8888 -Dcom.sun.management.jmxremote.ssl=false -Dcom.sun.management.jmxremote.authenticate=false -jar monitor_tuning-0.0.1-SNAPSHOT.war


//perhaps

java -Dcom.sun.management.jmxremote.ssl=false -Dcom.sun.management.jmxremote.authenticate=false  -Dcom.sun.management.jmxremote.port=9999 -Djava.rmi.server.hostname=192.168.132.250 -jar monitor_tuning-0.0.1-SNAPSHOT.jar
In the above jar mode, I can't succeed in remote monitoring. The project is started, but the remote connection fails. We need to see if the firewall is on. In particular, is the IP address of the corresponding server?
Reference material
jvisualVM:
https://docs.oracle.com/javase/8/docs/technotes/guides/visualvm/index.html
https://visualvm.github.io/documentation.html
How to add plug-ins to jvisulaVM
https://visualvm.github.io/index.html
Monitoring and debugging based on Btrace


btrace Download
https://github.com/btraceio/btrace
https://github.com/btraceio/btrace/releases/tag/v1.3.11
Function

There are two ways to run the above

Detailed explanation
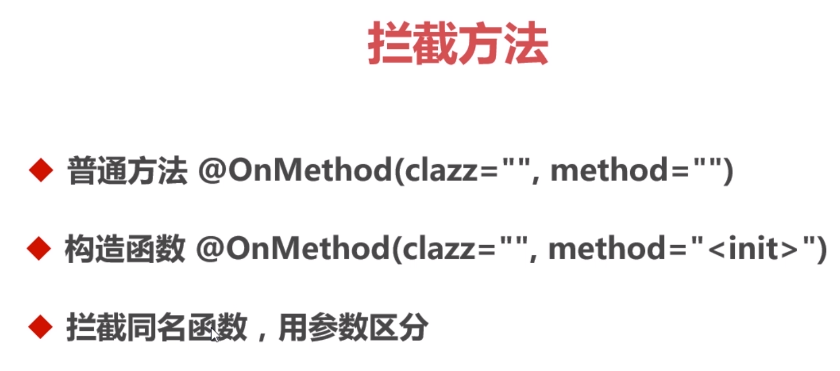
Interception opportunity
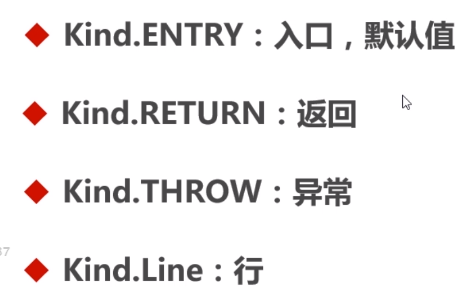

That's when to intercept the return value
Interception anomaly
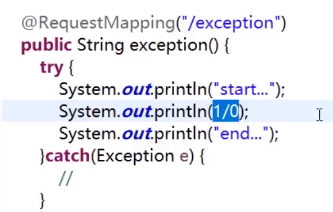
That is, it can catch even the exception that is try caught
@OnMethod(
        clazz="java.lang.Throwable",
        method="<init>",
        location=@Location(Kind.RETURN)
    )
    public static void onthrowreturn() {
        if (currentException != null) {
        	BTraceUtils.Threads.jstack(currentException);
        	BTraceUtils.println("=====================");
            currentException = null;
        }
    }
Intercept line number
Intercept replication parameters, environment variables


Matters needing attention

That is to say, if the JVM does not restart, the modified bytecode will still execute. Therefore, we should pay attention to the operation that consumes too much system resources
arthas, a substitute of btace
It is said that Ali's arthas are more powerful, and btace will be used less in the future
tomcat performance monitoring and tuning
tomcat remote debug ging
jdwp protocol:
https://www.ibm.com/developerworks/cn/java/j-lo-jpda3/
1. Add jpda at the end of startup.sh

2. Modify the port in catalina.sh, which is 8000 by default
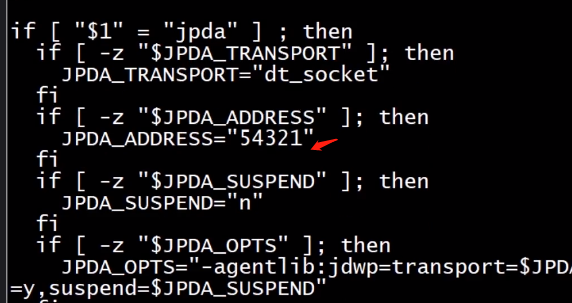
After that, you can configure idea for remote debug ging
idea can be referred to https://blog.csdn.net/helllochun/article/details/40890277
Similarly, if the configuration is in the form of spring boot jar:
java -agentlib:jdwp=transport=dt_socket,address=8000,server=y,suspend=n -jar ****.jar
In this way, it is more convenient to debug in the development stage
Tomcat manager monitoring
It is not enabled by default in higher versions
File
{tomcat}/webapps/docs/manager-howto.html

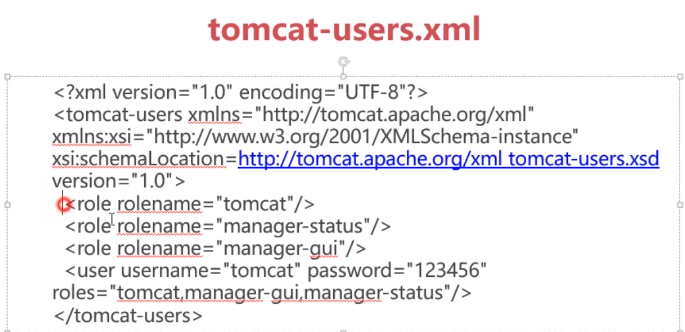
<role rolename="tomcat"/>
  <role rolename="manager-status"/>
  <role rolename="manager-gui"/>
  <user username="tomcat" password="123456" roles="tomcat,manager-status,manager-gui"/>
Create manager.xml manually in apache-tomcat-8.5.43\conf\Catalina\localhost
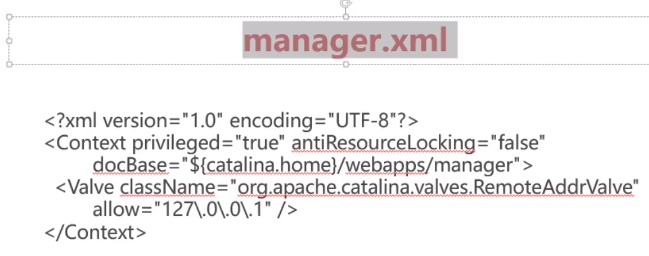
<?xml version="1.0" encoding="UTF-8"?>
<Context privileged="true" antiResourceLocking="false"
         docBase="${catalina.home}/webapps/manager">
  <Valve className="org.apache.catalina.valves.RemoteAddrValve"
         allow="127\.0\.0\.1" />
</Context>
Start tomcat
Visit http://127.0.0.1:8080/manager/html
You can see the memory information of the JVM, the maximum number of threads supported by the current tomcat, and the current number of threads
Number of busy threads. Very meaningful.
PSI probe monitoring
tomcat's own manager monitoring is a relatively simple monitoring tool, which is very powerful.

Or through https://repo1.maven.org/maven2/com/github/psi-probe/psi-probe-web/ Download war package
As with tomcat manager configuration, both Tomcat users.xml and manager.xml need to be configured,
Configuration mode is the same as tomcat manager configuration

Including the number of requests, request processing time, request response bytes
tomcat optimization
Memory optimization, thread optimization, configuration optimization
Thread optimization
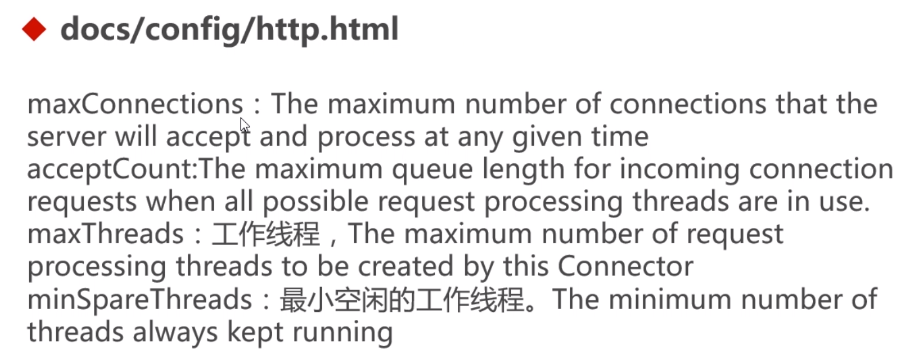
The above is the view directory of tomcat thread's documents
Max connections the maximum number of connection threads, NIO default connection number is 10000
acceptCount means that when the current number of connections exceeds maxConnections, these connections will be put into a queue. This value can control the size of the queue. The default value is 100. If the value is large, it doesn't make sense.
maxThreads is the number of concurrent requests that can be processed at the same time point. The default is 200
minSpareThreads cannot be set too small. If a lot of requests come suddenly, they will come for urgent processing
Configuration optimization

autoDeploy will affect certain performance, because a thread needs to be opened to check whether there is a new application
Default is false
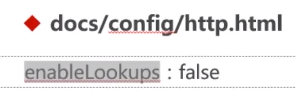

Do not query DNS, query DNS will affect performance
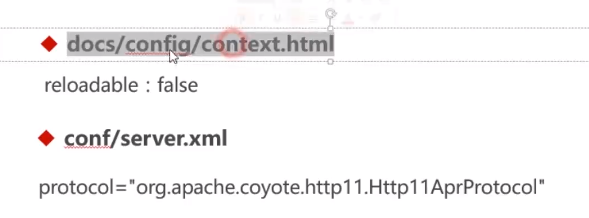
reloadable =true, that is, when the application has changed files, it will be automatically reloaded, which is usually enabled during development

Nginx performance monitoring and tuning
install
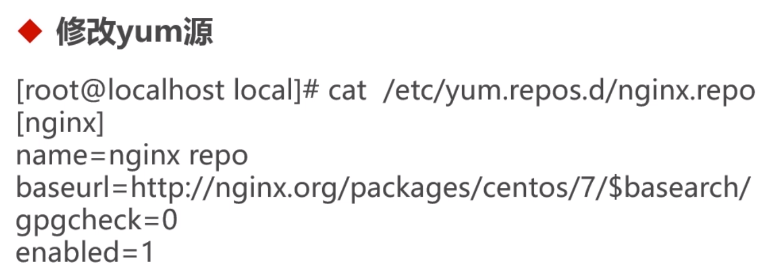
nginx official website documents
http://nginx.org/en/docs/

NGX? HTTP? Stub? Status monitoring connection information
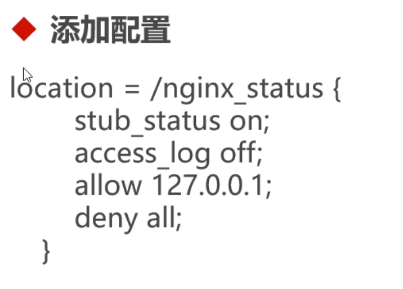
Add this module when NGINX compilation is required
By default, the
ngx_http_stub_status:
http://nginx.org/en/docs/http/ngx_http_stub_status_module.html
You can view the current concurrency through this
ngxtop monitoring request information
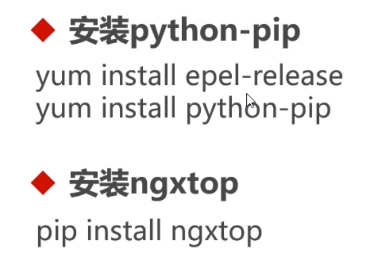
ngxtop:
https://github.com/lebinh/ngxtop
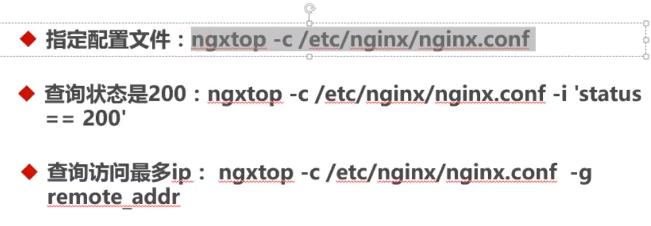
Use example
Graphical monitoring of nginx RRD
nginx-rdd
http://www.linuxde.net/2012/04/9537.html
You need to configure NGX HTTP stub status to monitor connection information
Then configure php dependency

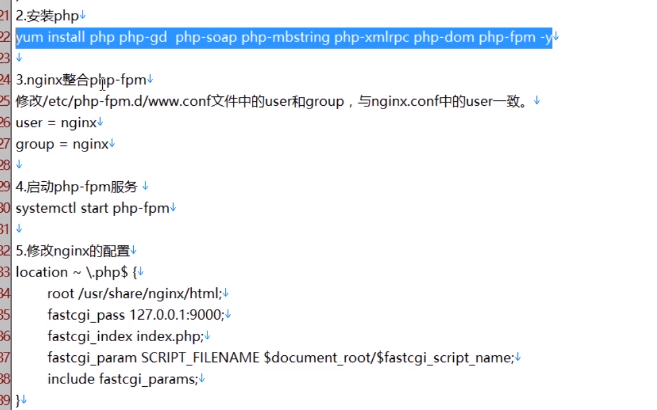
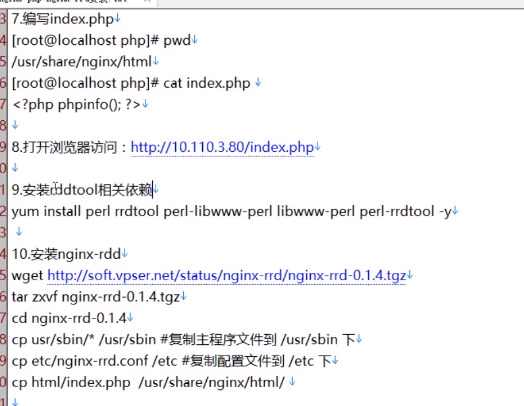
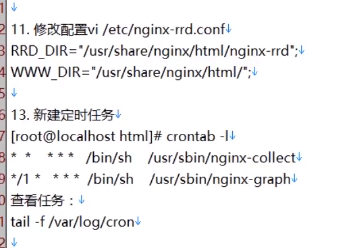
nginx optimization
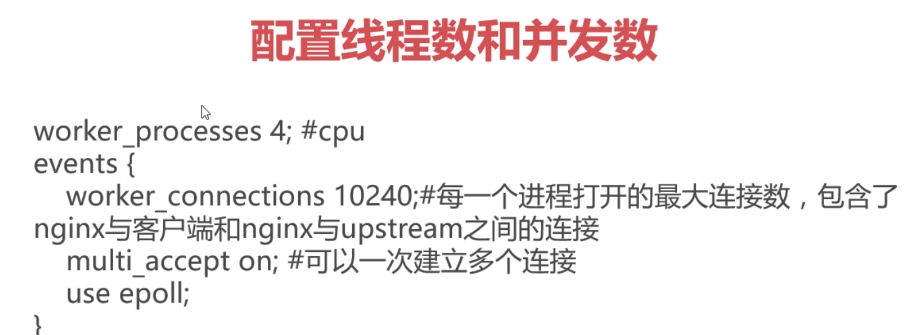
Threads and concurrency these configurations are limited by the operating system
Configure long connection of backend server
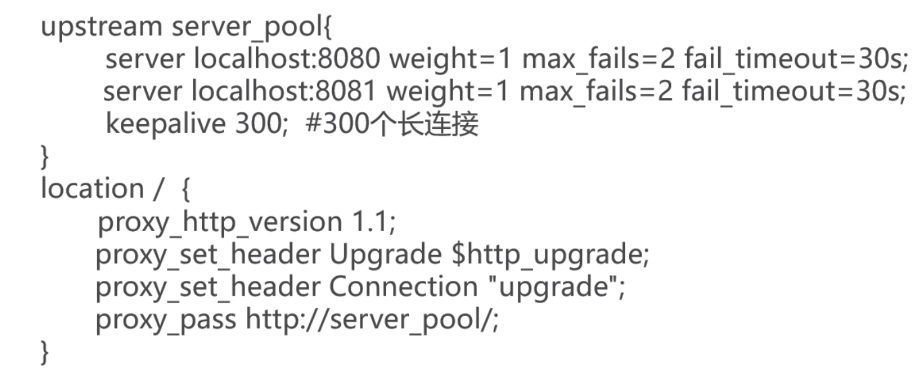
Keep alive? Timeout the configured connection time of long connection
However, by default, there is no connection time limit for the long connection between nginx and the back-end server
Configuration compression
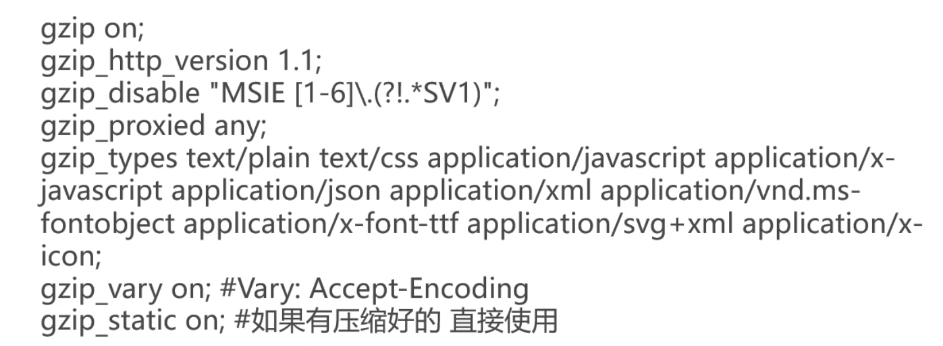
Operating system optimization
Mainly the parameter optimization of TCP/IP

Generally speaking, TW recycle does not need to be configured. It is OK by default
Configuration of file open limit per process

Other optimization

If the application needs to respond quickly, then TCP ﹣ nodelay can be set to on
GC tuning of JVM layer
Memory structure of JVM
Runtime data area
The runtime data area is different from the memory structure.
The runtime data area is a specification, and the memory structure of the JVM is an implementation of it.
Here is the data area of the JVM:
Reference: https://www.imooc.com/article/47149
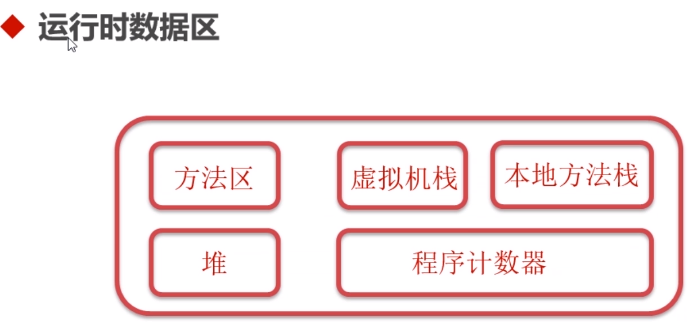
Program counter PC Register

Virtual machine stack JVM Stacks

Heap Heap
Method Area

In JDK8, it is MetaSpace. In JDK6,7, it is PerSpace
Constant pool run time constant pool

Constant pools are part of the method area
Native Method Stacks

Memory structure diagram of JVM (need to remember)
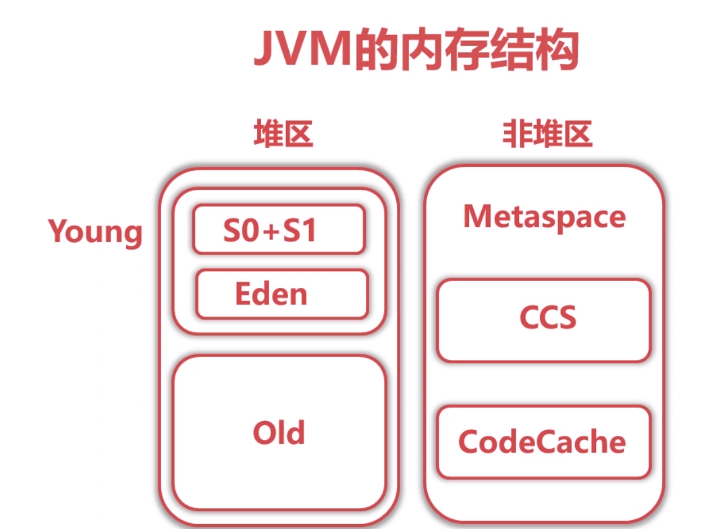
The heap is divided into Young area and Old area
Young: s (S0 and S1), Eden
S is divided into two parts of the same size: S0 and S1 (also called From and To). At the same time, only one part has data and the other is empty
Non heap area: CCS compresses the Class space (i.e. points to the Class file with a short pointer), CodeCache is the compiled code and the Navicat code of the JVM. If JIT compilation is not enabled and JNI local methods are not referenced, then this does not exist
JIT: Just In Time Compiler. Reference https://www.cnblogs.com/linghu-java/p/8589843.html
CCS: only when the short pointer is enabled can it exist. Every object allocated in the heap has a pointer to its own Class. If performance reasons are taken into account, the pointer is referred to as 32-bit by using the short pointer. If the short pointer is used, the referenced Class file will be stored in CCS.
CCS: Compressed class space utilization as a percentage
Reference https://www.cnblogs.com/milton/p/6134251.html
Non reactor area

Turn on the short pointer, which is turned on by default

Prohibit

View gcc of a java process
jstat -gc 89192
It can be seen that there is no CCSC and CCSU, and there is no disable

MC is Metaspace. If the short pointer is disabled, the long pointer will be longer, and you can see that it is larger than the Metaspace that used the short pointer before.
-Xint implementation application observation

Then look at gc
jstat -gc 89192
It will be found that the size of MC is smaller than that of the previous default mode, i.e. mixed mode. Because the code is compiled using the - Xint interpretation mode, the JAVA code will not be generated into the local code, which is put into CodeCache.
Common parameters of jvm
-20: NewSize is the size of the Cenozoic
NewRatio is the ratio of the size of new area (Young area) to old area
SurvivorRatio is the ratio of Eden area to S area (the ratio of two parts in Young area)
MetaspaceSize is the size of the Metaspace non heap area
CompressedClassSpaceSize sets the size of the compressed class space, which is the size of CCS.
If + usedecompressedclasspoints is enabled, the default CCS size is 1g
Initialcodecache size: initialize CodeCache size
Reservedcodachesize: the maximum size of CodeCache
Common garbage collection algorithms

Mark removal

copy

young area is the algorithm used
Mark finishing

Garbage collection by belt

Object assignment

Pretensionesizethreshold specifies how large an object can be directly aged, that is, old area

MaxTenuringThreshold can be used to set how long an object can live directly into the elderly generation
PrintTenuringDistribution refers to the age distribution of printing objects when yong gc occurs
TargetSurvivorRatio sets the ratio of objects surviving in S area after garbage collection, that is, according to certain rules, objects can be directly promoted to old area
Reference https://www.jianshu.com/p/f91fde4628a5
garbage collector

That is, the parallel collector is the throughput first collector.
Concurrent collector is the collector with pause time priority


MaxGCPauseMillis is the maximum pause time
For example, if you set GCTimeRatio =19, the garbage collection time is 1 / (1 + 19) = 1 / 20
The ideal situation is the maximum throughput with the minimum pause time. But the reality is that the pause time and throughput cannot be satisfied at the same time. When adjusting, adjust according to the actual situation
Serial Collector

parallel collector

concurrent collector


There are two options for parallel collectors: G1 and CMS
G1 is recommended for high performance
Garbage collector collocation
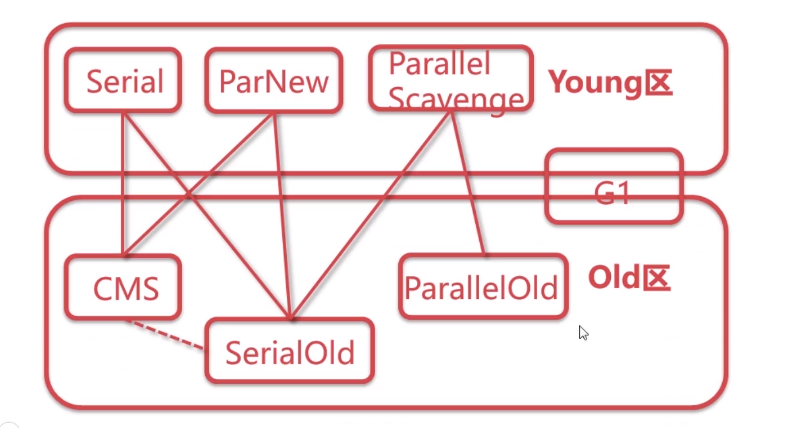
Select garbage collector


GC Tuning Guide:
https://docs.oracle.com/javase/8/docs/technotes/guides/vm/gctuning/toc.html
How to choose a garbage collector
https://docs.oracle.com/javase/8/docs/technotes/guides/vm/gctuning/collectors.html
Details of parallel garbage collector

Parallel collectors: adaptive configuration
That is, configure some parameters and let the garbage collector adjust the heap size to meet the following conditions
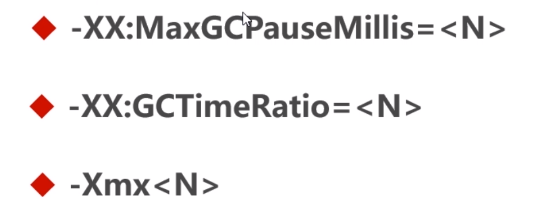
The above settings give priority to throughput requirements, followed by pause time requirements
This is not the best way. If you are not familiar with tuning, you can set it like this
Dynamic memory adjustment
When adaptive, dynamic memory adjustment is needed to meet the setting requirements

YoungGenerationSizeIncrement is the adjusted size of yong area every time it is dynamically adjusted. The default value is 20%
old area: it is the following parameter control, which is also 20% by default

If it is too large, it will be reduced. It is the following parameter control. The default is 4%

Use the above parameters to dynamically adjust the memory size to meet the setting requirements
Concurrent CMS

Garbage collection process


STW: the execution of the application will be stopped
shortcoming

CMS related parameters

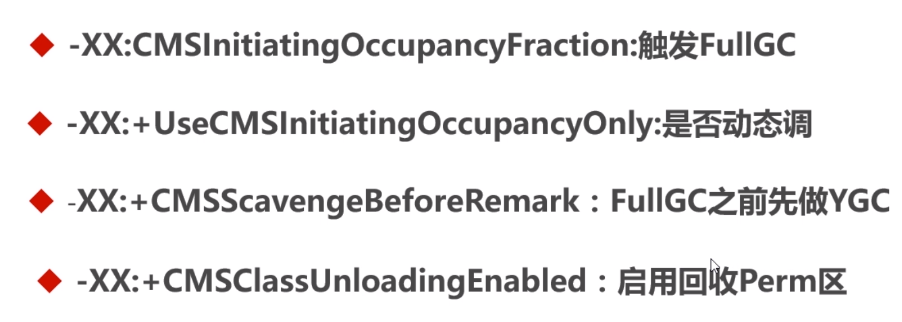
There was Perm before JDK7
CMSInitiatingOccupancyFraction by default 92%, that is, when the old area size reaches 92%, FullGC will be triggered
iCMS incremental CMS

Abandoned in JDK8
G1 garbage collector

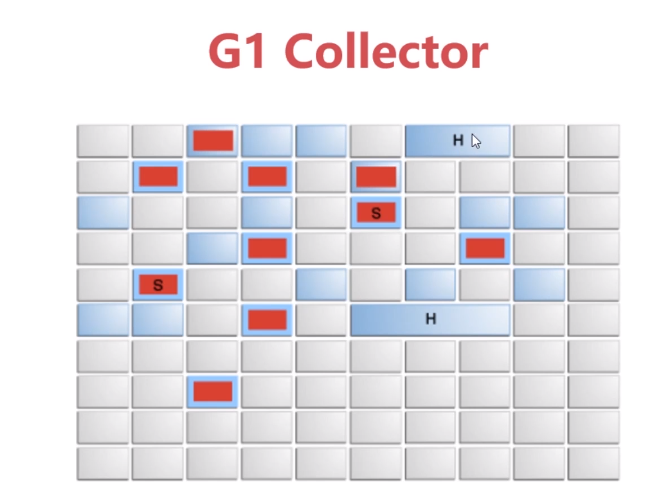
The above is the memory mark of G1 collector, in Region.
In G1, there are old areas and yong areas. The bottom is the top
H is the storage mark of large objects
G1 concept


YoungGC process

MixedGC

global concurrent marking


mixedGC opportunity
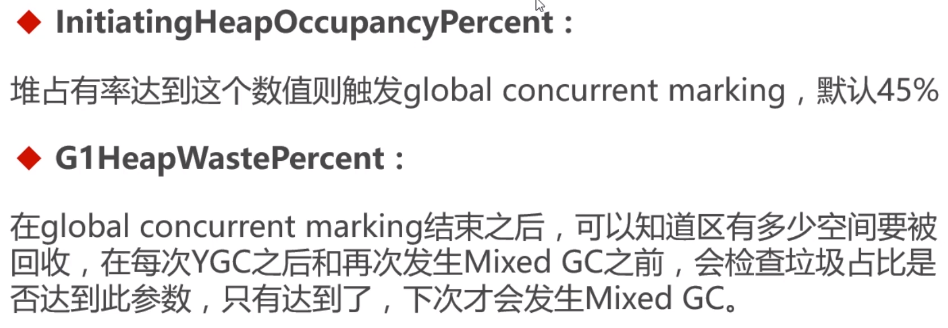
Related parameters


That is, the number of region s that can be recycled by a GC


ParallelGCThreads is the number of parallel GC threads (i.e. when the application needs to be stopped), SWT is the number of GC threads that need to be stopped
Not with the application
ConcGCThreads is the number of concurrent threads (executed with the application = 1 / 4 * ParallelGCThreads)
Best practices

That is, 90% of the time is for application execution, and 10% is for garbage collection

Need to switch to G1

Details of GC log format

Print log related parameters

Printheapatgc: print the usage of the whole heap during GC
PrintTenuringDistribution: print the age distribution information of objects in yong area
ParallelGC log format

Allocation Failure: cause of GC
GC without Full is young gc
- >: before gc - > after gc
Metadata GC Threshold: caused by insufficient Metaspace space
young area GC      Before garbage collection yong Size          Size after garbage collection      yong Total area size     gc Total size of front heap
[PSYoungGen] : 31744k               ->     5113k               (36864k)   ]     31744k      ->

gc Total size of the post heap total size of the heap      Recycling time
10233k       (121856)   ,   0.0023 sec
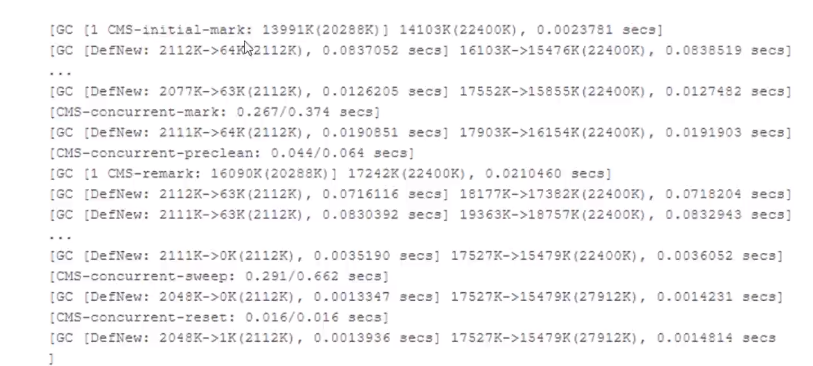
cms log format
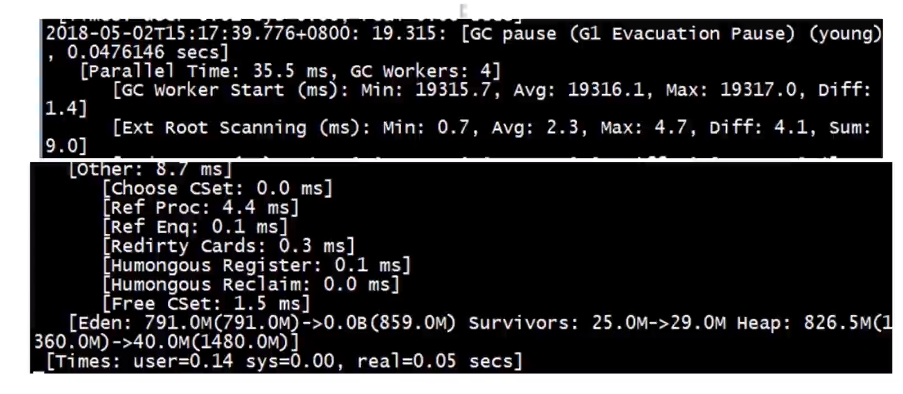
G1 - YoungGC log format
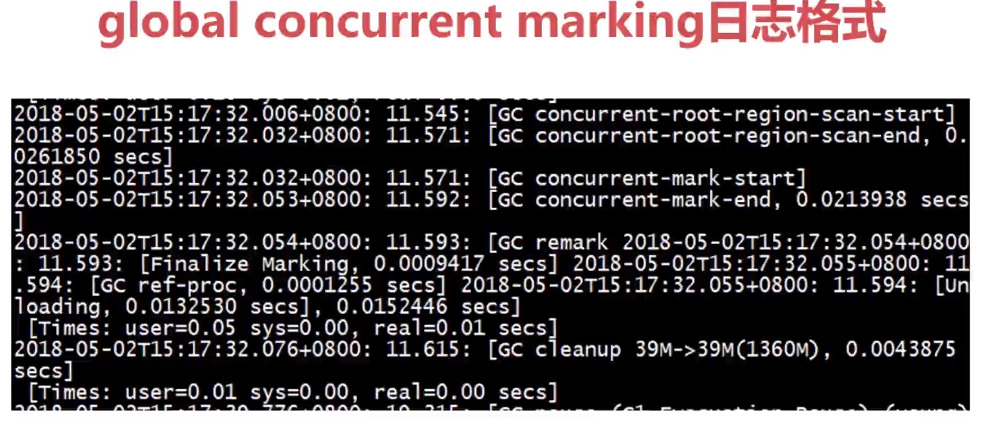
CMS log format
https://blogs.oracle.com/poonam/understanding-cms-gc-logs
G1 log format
https://blogs.oracle.com/poonam/understanding-g1-gc-logs
Visual GC analysis tool
GC log analysis tool
http://gceasy.io/
GCViewer
https://github.com/chewiebug/GCViewer
ZGC:
http://openjdk.java.net/jeps/333
gceasy is an online tool, which can be analyzed by uploading gc logs
GCViewer is a local tool: download address https://github.com/chewiebug/GCViewer/wiki/Changelog
Parallelgc tuning
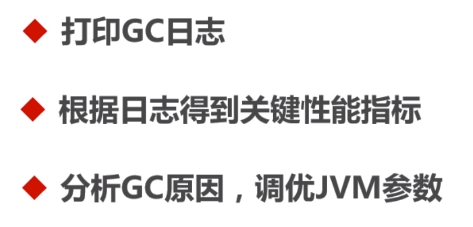
jinfo can dynamically set the value of parameters
Tuning principle


When tuning, one parameter at a time to tune, do not set all at once to debug.
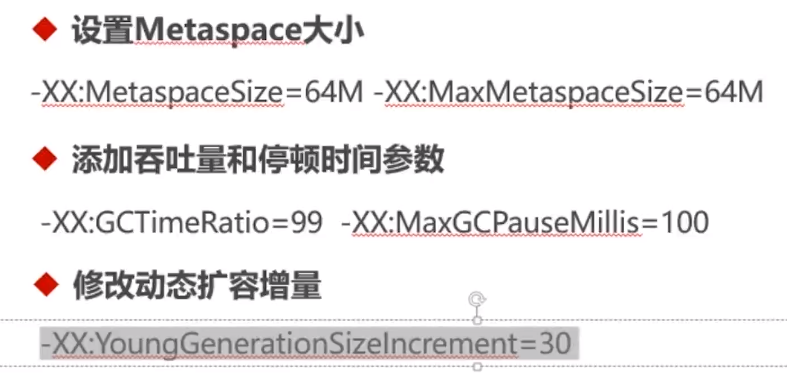
If you have a large number of ygcs, you can try to increase the parameter value of YoungGenerationSizeIncrement, submit the throughput and reduce the pause time
Tuning parameters reference website
https://opts.console.perfma.com/
Or refer to the tuning guide on the java official website
https://docs.oracle.com/javase/8/
JVM bytecode and Java code layer tuning
java virtual machine specification
https://docs.oracle.com/javase/specs/jvms/se8/html/index.html
java language specification
https://docs.oracle.com/javase/specs/jls/se8/html/index.html
javap:
https://docs.oracle.com/javase/8/docs/technotes/tools/unix/javap.html
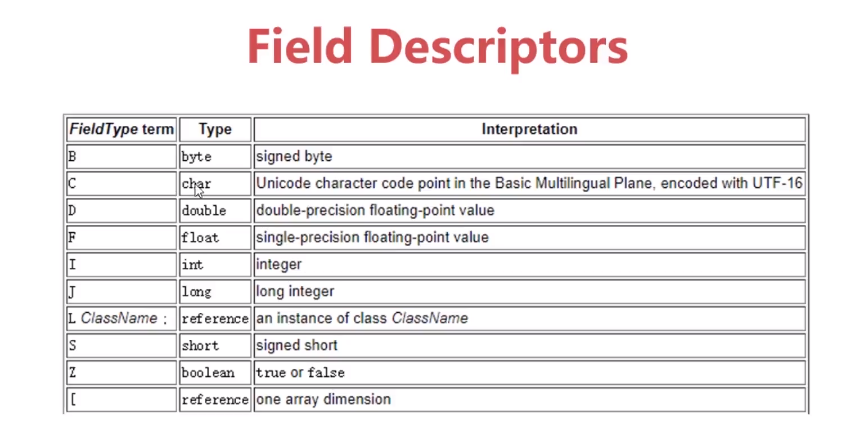
Field descriptor
https://docs.oracle.com/javase/specs/jvms/se8/html/jvms-4.html#jvms-4.3.2
Method Descriptor
https://docs.oracle.com/javase/specs/jvms/se8/html/jvms-4.html#jvms-4.3.3
Bytecode instruction:
https://docs.oracle.com/javase/specs/jvms/se8/html/jvms-6.html
Constant pool:
https://docs.oracle.com/javase/specs/jvms/se8/html/jvms-4.html#jvms-4.4
Local variable table:
https://docs.oracle.com/javase/specs/jvms/se8/html/jvms-2.html#jvms-2.6.1
https://docs.oracle.com/javase/specs/jvms/se8/html/jvms-4.html#jvms-4.7.13
Operand stack:
https://docs.oracle.com/javase/specs/jvms/se8/html/jvms-2.html#jvms-2.6.2
Code attribute:
https://docs.oracle.com/javase/specs/jvms/se8/html/jvms-4.html#jvms-4.7.3
LineNumberTable:
https://docs.oracle.com/javase/specs/jvms/se8/html/jvms-4.html#jvms-4.7.12
constant variable:
https://docs.oracle.com/javase/specs/jls/se8/html/jls-4.html#jls-4.12.4
Constant expression
https://docs.oracle.com/javase/specs/jls/se8/html/jls-15.html#jls-15.28
javap
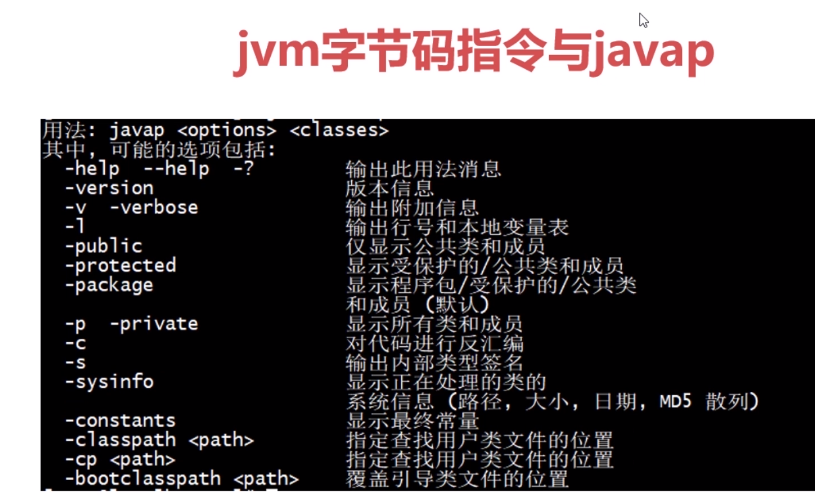
For example, check the bytecode of a class file

jvm bytecode instruction
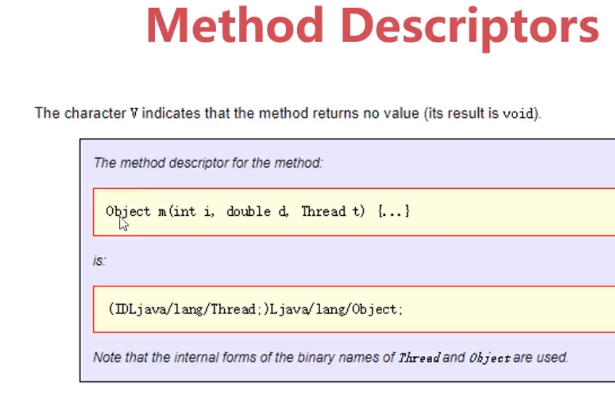
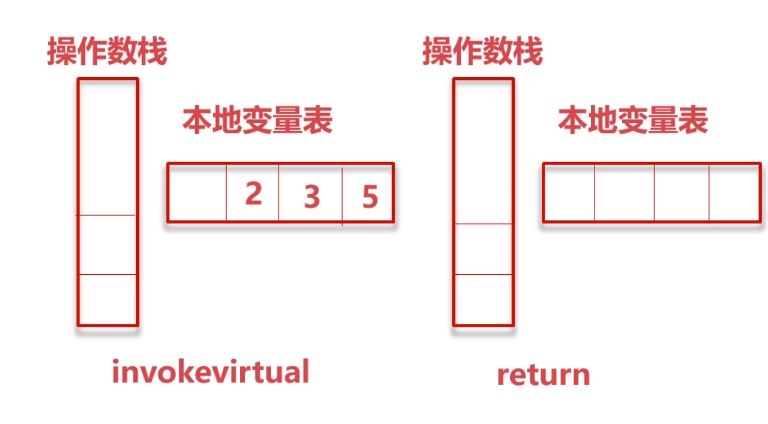
Stack based architecture
public class Test1 {
	public static void main(String args) {
		int a=2;
		int b=3;
		int c = a + b;
		System.out.println(c);
	}
	/***
	 public static void main(java.lang.String);
    descriptor: (Ljava/lang/String;)V   # Descriptor: V represents no return value, with a string type parameter
    flags: ACC_PUBLIC, ACC_STATIC   # Method description public, static
    Code:
      # Depth of operand stack 2
      # The maximum length (slot) of the local variable table is 2 for 64 bit and 1 for others. The index starts from 0. If it is a non static method, index 0 represents this, followed by the input parameter, followed by the local variable
      # 1 this parameter for instance method
      stack=2, locals=4, args_size=1
         0: iconst_2  #Constant 2 stack pressing
         1: istore_1  #Save the stack to local variable 1
         2: iconst_3  #Constant 3 stack pressing
         3: istore_2  #Save the stack to local variable 2
         4: iload_1    #Local variable 1 stack
         5: iload_2    #Local variable 2 stack
         6: iadd        # Add the two elements at the top of the stack and press the calculation result
         7: istore_3  # Save the stack to local variable 3
         8: getstatic     #16                 // Field java/lang/System.out:Ljava/io/PrintStream;
        11: iload_3
        12: invokevirtual #22                 // Call the instance Method java/io/PrintStream.println:(I)V
        15: return
      LineNumberTable:
        line 5: 0  # The fifth line of the source code corresponds to the above 0
        line 6: 2  # 2 Represents the instruction with number 2 above
        line 7: 4
        line 8: 8
        line 9: 15
      LocalVariableTable:
        Start  Length  Slot  Name   Signature
            0      16     0  args   Ljava/lang/String;
            2      14     1     a   I
            4      12     2     b   I
            8       8     3     c   I
	 **/
}
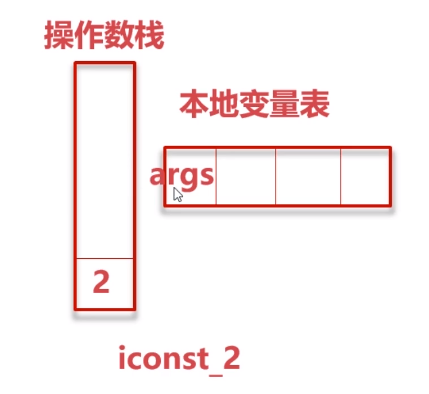
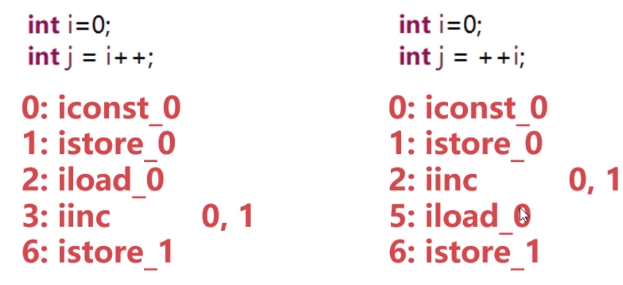
i + + and + + i
package com.imooc.monitor_tuning.chapter8;

public class SelfAdd {

	public static void main(String[] args) {
		f3();
		f4();
	}
	/**
	 public static void f1();
    descriptor: ()V
    flags: ACC_PUBLIC, ACC_STATIC
    Code:
      stack=2, locals=1, args_size=0
         0: iconst_0
         1: istore_0
         2: goto          15
         5: getstatic     #19                 // Field java/lang/System.out:Ljava/io/PrintStream;
         8: iload_0
         9: invokevirtual #25                 // Method java/io/PrintStream.println:(I)V
        12: iinc          0, 1
        15: iload_0
        16: bipush        10
        18: if_icmplt     5
        21: return
	 * */
	public static void f1() {
		for(int i=0;i<10;i++) {
			System.out.println(i);
		}
	}
	/**
	 public static void f2();
    descriptor: ()V
    flags: ACC_PUBLIC, ACC_STATIC
    Code:
      stack=2, locals=1, args_size=0
         0: iconst_0
         1: istore_0
         2: goto          15
         5: getstatic     #19                 // Field java/lang/System.out:Ljava/io/PrintStream;
         8: iload_0
         9: invokevirtual #25                 // Method java/io/PrintStream.println:(I)V
        12: iinc          0, 1
        15: iload_0
        16: bipush        10
        18: if_icmplt     5
        21: return
	 * */
	public static void f2() {
		for(int i=0;i<10;++i) {
			System.out.println(i);
		}
	}
	/**
	 public static void f3();
    descriptor: ()V
    flags: ACC_PUBLIC, ACC_STATIC
    Code:
      stack=2, locals=2, args_size=0
         0: iconst_0
         1: istore_0
         2: iload_0
         3: iinc          0, 1
         6: istore_1
         7: getstatic     #19                 // Field java/lang/System.out:Ljava/io/PrintStream;
        10: iload_1
        11: invokevirtual #25                 // Method java/io/PrintStream.println:(I)V
        14: return
	 * */
	public static void f3() {
		int i=0;
		int j = i++;
		System.out.println(j);
	}
	/**
	public static void f4();
    descriptor: ()V
    flags: ACC_PUBLIC, ACC_STATIC
    Code:
      stack=2, locals=2, args_size=0
         0: iconst_0
         1: istore_0
         2: iinc          0, 1
         5: iload_0
         6: istore_1
         7: getstatic     #19                 // Field java/lang/System.out:Ljava/io/PrintStream;
        10: iload_1
        11: invokevirtual #25                 // Method java/io/PrintStream.println:(I)V
        14: return
	 * */
	public static void f4() {
		int i=0;
		int j = ++i;
		System.out.println(j);
	}
}
It doesn't make any difference
String splicing+
package com.imooc.monitor_tuning.chapter8;

public class StringAdd {
	public static void main(String[] args) {
	}

	/**
	 public static void f1();
    descriptor: ()V
    flags: ACC_PUBLIC, ACC_STATIC
    Code:
      stack=3, locals=2, args_size=0
         0: ldc           #19                 // String
         2: astore_0
         3: iconst_0
         4: istore_1
         5: goto          31
         8: new           #21                 // class java/lang/StringBuilder
        11: dup
        12: aload_0
        13: invokestatic  #23                 // Method java/lang/String.valueOf:(Ljava/lang/Object;)Ljava/lang/String;
        16: invokespecial #29                 // Method java/lang/StringBuilder."<init>":(Ljava/lang/String;)V   new StringBuilder(src)
        19: ldc           #32                 // String A
        21: invokevirtual #34                 // Method java/lang/StringBuilder.append:(Ljava/lang/String;)Ljava/lang/StringBuilder;
        24: invokevirtual #38                 // Method java/lang/StringBuilder.toString:()Ljava/lang/String;
        27: astore_0
        28: iinc          1, 1
        31: iload_1
        32: bipush        10
        34: if_icmplt     8
        37: getstatic     #42                 // Field java/lang/System.out:Ljava/io/PrintStream;
        40: aload_0
        41: invokevirtual #48                 // Method java/io/PrintStream.println:(Ljava/lang/String;)V
        44: return
	 * */
	public static void f1() {
		String src = "";
		for(int i=0;i<10;i++) {
			//Every cycle will be a new StringBuilder
			src = src + "A";
		}
		System.out.println(src);
	}
	public static void f2() {
		//Just one StringBuilder
		StringBuilder src = new StringBuilder();
		for(int i=0;i<10;i++) {
			src.append("A");
		}
		System.out.println(src);
	}

    public static void f3() {
	    //jvm optimization is directly a SCR = AAAAA AAAA
        String src = "A"+"A"+"A"+"A"+"A"+"A"+"A"+"A"+"A"+"A";
        System.out.println(src);
    }

    public static void f4() {
	    //In this case, there is only one StringBuilder
        int a=1;
        int b=2;
        if (b==2){
            b=3;
        }
        String src = "A"+"A"+"A"+"A"+"A"+"A"+"A"+"A"+"A"+"A"+a+b;
        System.out.println(src);
    }


}
Corresponding bytecode
Classfile /F:/oumin/learn/project/jvm-coding-241/monitor_tuning/target/classes/com/imooc/monitor_tuning/chapter8/StringAdd.class
  Last modified 2019-12-26; size 1501 bytes
  MD5 checksum a6f4368568818f8f3796aed1e02f4c4b
  Compiled from "StringAdd.java"
public class com.imooc.monitor_tuning.chapter8.StringAdd
  minor version: 0
  major version: 52
  flags: ACC_PUBLIC, ACC_SUPER
Constant pool:
   #1 = Methodref          #14.#43        // java/lang/Object."<init>":()V
   #2 = String             #44            //
   #3 = Class              #45            // java/lang/StringBuilder
   #4 = Methodref          #3.#43         // java/lang/StringBuilder."<init>":()V
   #5 = Methodref          #3.#46         // java/lang/StringBuilder.append:(Ljava/lang/String;)Ljava/lang/StringBuilder;
   #6 = String             #47            // A
   #7 = Methodref          #3.#48         // java/lang/StringBuilder.toString:()Ljava/lang/String;
   #8 = Fieldref           #49.#50        // java/lang/System.out:Ljava/io/PrintStream;
   #9 = Methodref          #51.#52        // java/io/PrintStream.println:(Ljava/lang/String;)V
  #10 = Methodref          #51.#53        // java/io/PrintStream.println:(Ljava/lang/Object;)V
  #11 = String             #54            // AAAAAAAAAA
  #12 = Methodref          #3.#55         // java/lang/StringBuilder.append:(I)Ljava/lang/StringBuilder;
  #13 = Class              #56            // com/imooc/monitor_tuning/chapter8/StringAdd
  #14 = Class              #57            // java/lang/Object
  #15 = Utf8               <init>
  #16 = Utf8               ()V
  #17 = Utf8               Code
  #18 = Utf8               LineNumberTable
  #19 = Utf8               LocalVariableTable
  #20 = Utf8               this
  #21 = Utf8               Lcom/imooc/monitor_tuning/chapter8/StringAdd;
  #22 = Utf8               main
  #23 = Utf8               ([Ljava/lang/String;)V
  #24 = Utf8               args
  #25 = Utf8               [Ljava/lang/String;
  #26 = Utf8               MethodParameters
  #27 = Utf8               f1
  #28 = Utf8               i
  #29 = Utf8               I
  #30 = Utf8               src
  #31 = Utf8               Ljava/lang/String;
  #32 = Utf8               StackMapTable
  #33 = Class              #58            // java/lang/String
  #34 = Utf8               f2
  #35 = Utf8               Ljava/lang/StringBuilder;
  #36 = Class              #45            // java/lang/StringBuilder
  #37 = Utf8               f3
  #38 = Utf8               f4
  #39 = Utf8               a
  #40 = Utf8               b
  #41 = Utf8               SourceFile
  #42 = Utf8               StringAdd.java
  #43 = NameAndType        #15:#16        // "<init>":()V
  #44 = Utf8
  #45 = Utf8               java/lang/StringBuilder
  #46 = NameAndType        #59:#60        // append:(Ljava/lang/String;)Ljava/lang/StringBuilder;
  #47 = Utf8               A
  #48 = NameAndType        #61:#62        // toString:()Ljava/lang/String;
  #49 = Class              #63            // java/lang/System
  #50 = NameAndType        #64:#65        // out:Ljava/io/PrintStream;
  #51 = Class              #66            // java/io/PrintStream
  #52 = NameAndType        #67:#68        // println:(Ljava/lang/String;)V
  #53 = NameAndType        #67:#69        // println:(Ljava/lang/Object;)V
  #54 = Utf8               AAAAAAAAAA
  #55 = NameAndType        #59:#70        // append:(I)Ljava/lang/StringBuilder;
  #56 = Utf8               com/imooc/monitor_tuning/chapter8/StringAdd
  #57 = Utf8               java/lang/Object
  #58 = Utf8               java/lang/String
  #59 = Utf8               append
  #60 = Utf8               (Ljava/lang/String;)Ljava/lang/StringBuilder;
  #61 = Utf8               toString
  #62 = Utf8               ()Ljava/lang/String;
  #63 = Utf8               java/lang/System
  #64 = Utf8               out
  #65 = Utf8               Ljava/io/PrintStream;
  #66 = Utf8               java/io/PrintStream
  #67 = Utf8               println
  #68 = Utf8               (Ljava/lang/String;)V
  #69 = Utf8               (Ljava/lang/Object;)V
  #70 = Utf8               (I)Ljava/lang/StringBuilder;
{
  public com.imooc.monitor_tuning.chapter8.StringAdd();
    descriptor: ()V
    flags: ACC_PUBLIC
    Code:
      stack=1, locals=1, args_size=1
         0: aload_0
         1: invokespecial #1                  // Method java/lang/Object."<init>":()V
         4: return
      LineNumberTable:
        line 3: 0
      LocalVariableTable:
        Start  Length  Slot  Name   Signature
            0       5     0  this   Lcom/imooc/monitor_tuning/chapter8/StringAdd;

  public static void main(java.lang.String[]);
    descriptor: ([Ljava/lang/String;)V
    flags: ACC_PUBLIC, ACC_STATIC
    Code:
      stack=0, locals=1, args_size=1
         0: return
      LineNumberTable:
        line 5: 0
      LocalVariableTable:
        Start  Length  Slot  Name   Signature
            0       1     0  args   [Ljava/lang/String;
    MethodParameters:
      Name                           Flags
      args

  public static void f1();
    descriptor: ()V
    flags: ACC_PUBLIC, ACC_STATIC
    Code:
      stack=2, locals=2, args_size=0
         0: ldc           #2                  // String
         2: astore_0
         3: iconst_0
         4: istore_1
         5: iload_1
         6: bipush        10
         8: if_icmpge     37
        11: new           #3                  // class java/lang/StringBuilder
        14: dup
        15: invokespecial #4                  // Method java/lang/StringBuilder."<init>":()V
        18: aload_0
        19: invokevirtual #5                  // Method java/lang/StringBuilder.append:(Ljava/lang/String;)Ljava/lang/StringBuilder;
        22: ldc           #6                  // String A
        24: invokevirtual #5                  // Method java/lang/StringBuilder.append:(Ljava/lang/String;)Ljava/lang/StringBuilder;
        27: invokevirtual #7                  // Method java/lang/StringBuilder.toString:()Ljava/lang/String;
        30: astore_0
        31: iinc          1, 1
        34: goto          5
        37: getstatic     #8                  // Field java/lang/System.out:Ljava/io/PrintStream;
        40: aload_0
        41: invokevirtual #9                  // Method java/io/PrintStream.println:(Ljava/lang/String;)V
        44: return
      LineNumberTable:
        line 37: 0
        line 38: 3
        line 40: 11
        line 38: 31
        line 42: 37
        line 43: 44
      LocalVariableTable:
        Start  Length  Slot  Name   Signature
            5      32     1     i   I
            3      42     0   src   Ljava/lang/String;
      StackMapTable: number_of_entries = 2
        frame_type = 253 /* append */
          offset_delta = 5
          locals = [ class java/lang/String, int ]
        frame_type = 250 /* chop */
          offset_delta = 31

  public static void f2();
    descriptor: ()V
    flags: ACC_PUBLIC, ACC_STATIC
    Code:
      stack=2, locals=2, args_size=0
         0: new           #3                  // class java/lang/StringBuilder
         3: dup
         4: invokespecial #4                  // Method java/lang/StringBuilder."<init>":()V
         7: astore_0
         8: iconst_0
         9: istore_1
        10: iload_1
        11: bipush        10
        13: if_icmpge     29
        16: aload_0
        17: ldc           #6                  // String A
        19: invokevirtual #5                  // Method java/lang/StringBuilder.append:(Ljava/lang/String;)Ljava/lang/StringBuilder;
        22: pop
        23: iinc          1, 1
        26: goto          10
        29: getstatic     #8                  // Field java/lang/System.out:Ljava/io/PrintStream;
        32: aload_0
        33: invokevirtual #10                 // Method java/io/PrintStream.println:(Ljava/lang/Object;)V
        36: return
      LineNumberTable:
        line 46: 0
        line 47: 8
        line 48: 16
        line 47: 23
        line 50: 29
        line 51: 36
      LocalVariableTable:
        Start  Length  Slot  Name   Signature
           10      19     1     i   I
            8      29     0   src   Ljava/lang/StringBuilder;
      StackMapTable: number_of_entries = 2
        frame_type = 253 /* append */
          offset_delta = 10
          locals = [ class java/lang/StringBuilder, int ]
        frame_type = 250 /* chop */
          offset_delta = 18

  public static void f3();
    descriptor: ()V
    flags: ACC_PUBLIC, ACC_STATIC
    Code:
      stack=2, locals=1, args_size=0
         0: ldc           #11                 // String AAAAAAAAAA
         2: astore_0
         3: getstatic     #8                  // Field java/lang/System.out:Ljava/io/PrintStream;
         6: aload_0
         7: invokevirtual #9                  // Method java/io/PrintStream.println:(Ljava/lang/String;)V
        10: return
      LineNumberTable:
        line 55: 0
        line 56: 3
        line 57: 10
      LocalVariableTable:
        Start  Length  Slot  Name   Signature
            3       8     0   src   Ljava/lang/String;

  public static void f4();
    descriptor: ()V
    flags: ACC_PUBLIC, ACC_STATIC
    Code:
      stack=2, locals=3, args_size=0
         0: iconst_1
         1: istore_0
         2: iconst_2
         3: istore_1
         4: iload_1
         5: iconst_2
         6: if_icmpne     11
         9: iconst_3
        10: istore_1
        11: new           #3                  // class java/lang/StringBuilder
        14: dup
        15: invokespecial #4                  // Method java/lang/StringBuilder."<init>":()V
        18: ldc           #11                 // String AAAAAAAAAA
        20: invokevirtual #5                  // Method java/lang/StringBuilder.append:(Ljava/lang/String;)Ljava/lang/StringBuilder;
        23: iload_0
        24: invokevirtual #12                 // Method java/lang/StringBuilder.append:(I)Ljava/lang/StringBuilder;
        27: iload_1
        28: invokevirtual #12                 // Method java/lang/StringBuilder.append:(I)Ljava/lang/StringBuilder;
        31: invokevirtual #7                  // Method java/lang/StringBuilder.toString:()Ljava/lang/String;
        34: astore_2
        35: getstatic     #8                  // Field java/lang/System.out:Ljava/io/PrintStream;
        38: aload_2
        39: invokevirtual #9                  // Method java/io/PrintStream.println:(Ljava/lang/String;)V
        42: return
      LineNumberTable:
        line 60: 0
        line 61: 2
        line 62: 4
        line 63: 9
        line 65: 11
        line 66: 35
        line 67: 42
      LocalVariableTable:
        Start  Length  Slot  Name   Signature
            2      41     0     a   I
            4      39     1     b   I
           35       8     2   src   Ljava/lang/String;
      StackMapTable: number_of_entries = 1
        frame_type = 253 /* append */
          offset_delta = 11
          locals = [ int, int ]
}
SourceFile: "StringAdd.java"
That is to say, starting from jdk7, string splicing in some cases will indeed be optimized to have only one StringBuilder object, but in for and other circular cases, each string splicing will produce a new StringBuilder object.
So in the future, we should try to use Stringbuilder instead of string splicing
try-finally
/**
	 public static java.lang.String f1();
    descriptor: ()Ljava/lang/String;
    flags: ACC_PUBLIC, ACC_STATIC
    Code:
      stack=1, locals=3, args_size=0
         0: ldc           #34                 // String hello
         2: astore_0
         3: aload_0
         4: astore_2
         5: ldc           #36                 // String imooc
         7: astore_0
         8: aload_2
         9: areturn
        10: astore_1    // Stored abnormal information, if any
        11: ldc           #36                 // String imooc
        13: astore_0
        14: aload_1
        15: athrow
	 * */
	public static String f1() {
		String str = "hello";
        try{
            return str;
        }
        finally{
            str = "imooc";
        }
	}
String Constant Variable
Constant variable of string
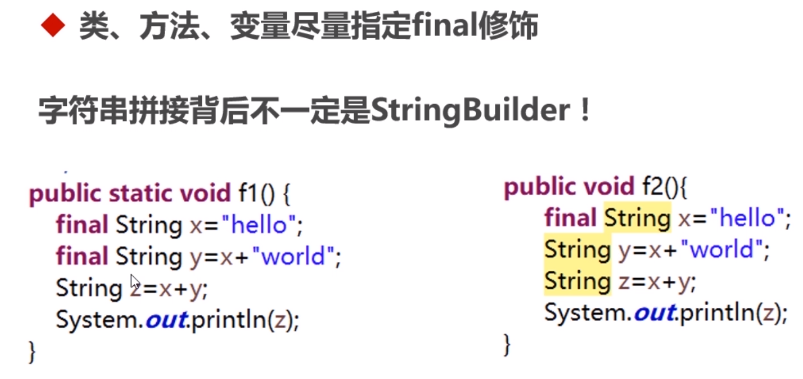
In the higher version of JDK, for example, the method in jdk8 does not need to specify final self-cultivation, and the lower version is only useful
/**
	     0: ldc           #8                  // String hello
         2: astore_0
         3: ldc           #46                 // String helloworld
         5: astore_1
         6: ldc           #48                 // String hellohelloworld
         8: astore_2
         9: getstatic     #31                 // Field java/lang/System.out:Ljava/io/PrintStream;
        12: aload_2
        13: invokevirtual #37                 // Method java/io/PrintStream.println:(Ljava/lang/String;)V
        16: return
	 * */
	public static void f1() {
		final String x="hello";
	    final String y=x+"world";
        //Compile time substitution occurs
	    String z=x+y;
	    System.out.println(z);
	}
	/**
	    0: ldc           #19                 // String hello
         2: astore_1
         3: ldc           #21                 // String helloworld
         5: astore_2
         6: new           #42                 // class java/lang/StringBuilder
         9: dup
        10: ldc           #19                 // String hello
        12: invokespecial #44                 // Method java/lang/StringBuilder."<init>":(Ljava/lang/String;)V
        15: aload_2
        16: invokevirtual #46                 // Method java/lang/StringBuilder.append:(Ljava/lang/String;)Ljava/lang/StringBuilder;
        19: invokevirtual #50                 // Method java/lang/StringBuilder.toString:()Ljava/lang/String;
        22: astore_3
        23: getstatic     #25                 // Field java/lang/System.out:Ljava/io/PrintStream;
        26: aload_3
        27: invokevirtual #31                 // Method java/io/PrintStream.println:(Ljava/lang/String;)V
        30: return
	 * */
	public void f2(){
	      final String x="hello";
	      String y=x+"world";
	      String z=x+y;
	      System.out.println(z);
	}
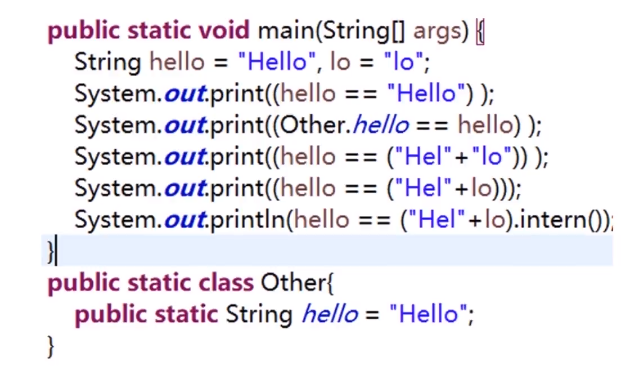
After the above code is executed, only Hello = ("hello" + LO) results in false
Because lo is a variable, it is actually a string generated by new StringBuilder,
hello is optimized during compilation. It takes the objects in the string constant pool.
So this is false, and the rest are true
intern()
String.intern
https://blog.csdn.net/goldenfish1919/article/details/80410349
That is to say, when the inern method is called, if the constant pool has the string, the string will be taken, otherwise a string will be generated and put into the constant pool
String remove weights
https://blog.csdn.net/goldenfish1919/article/details/20233263
Common code optimization methods

If we can know the maximum capacity, we can initialize it and improve the efficiency of program execution. Avoid expansion.

For example, the length of the set here will be repeatedly calculated


The System.arraycopy bottom layer calls the native code to execute.


Because the jvm compiler actually uses the Integer method instead of the direct int
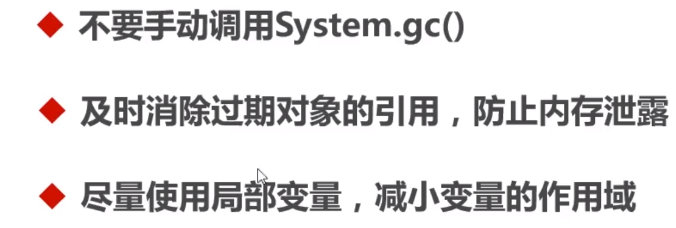

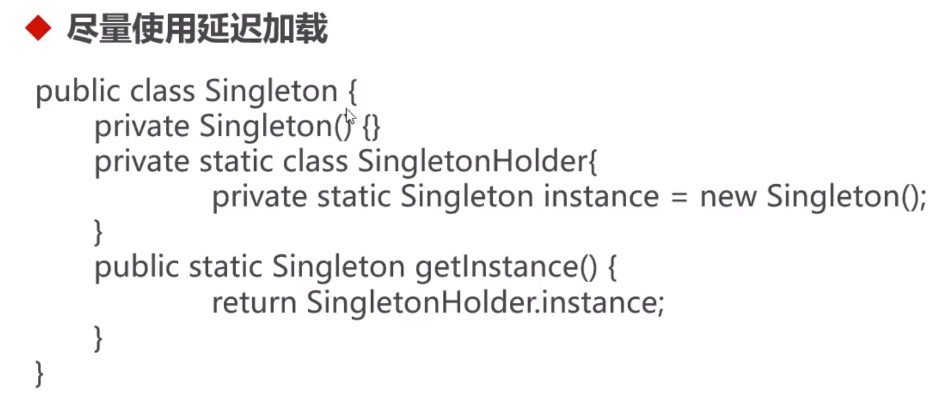


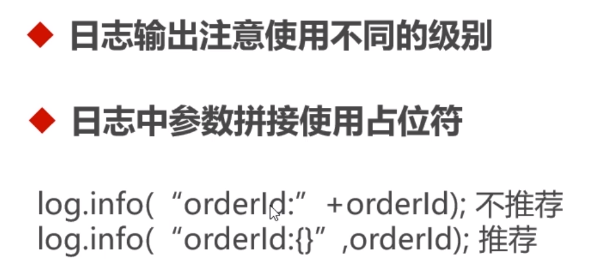
TIP: you need to make a direct trade-off between development efficiency and performance. In most cases, there will be no performance problem. Try not to reduce the development efficiency for the ultimate performance.
Reference tool and resource address
Chapter 1
//nothing
//The second chapter
jdk8 Toolset
https://docs.oracle.com/javase/8/docs/technotes/tools/unix/index.html
Troubleshooting
https://docs.oracle.com/javase/8/docs/technotes/guides/troubleshoot/
jps
https://docs.oracle.com/javase/8/docs/technotes/tools/unix/jps.html
jinfo
https://docs.oracle.com/javase/8/docs/technotes/tools/unix/jinfo.html
jstat
https://docs.oracle.com/javase/8/docs/technotes/tools/unix/jstat.html
jmap:
https://docs.oracle.com/javase/8/docs/technotes/tools/unix/jmap.html
mat:
http://www.eclipse.org/mat/downloads.php
jstack:
https://docs.oracle.com/javase/8/docs/technotes/tools/unix/jstack.html
java State of thread
https://docs.oracle.com/javase/8/docs/technotes/guides/troubleshoot/tooldescr034.html
java Thread state conversion:
https://mp.weixin.qq.com/s/GsxeFM7QWuR--Kbpb7At2w
//High CPU load due to dead cycle
https://blog.csdn.net/goldenfish1919/article/details/8755378
//Regular expression causes a dead loop:
https://blog.csdn.net/goldenfish1919/article/details/49123787
//The third chapter
jvisualVM:
https://docs.oracle.com/javase/8/docs/technotes/guides/visualvm/index.html
https://visualvm.github.io/documentation.html
jvisulaVM How to add a plug-in
https://visualvm.github.io/index.html
//The fourth chapter
btrace download
https://github.com/btraceio/btrace
https://github.com/btraceio/btrace/releases/tag/v1.3.11
//The fifth chapter
jdwp Agreement:
https://www.ibm.com/developerworks/cn/java/j-lo-jpda3/
tomcat-manager:
{tomcat}/webapps/docs/manager-howto.html
psi-probe:
https://github.com/psi-probe/psi-probe
tomcat Optimize relevant parameters:
${tomcat}/webapps/docs/config/http.html
${tomcat}/webapps/docs/config/host.html
${tomcat}/webapps/docs/config/context.html
${tomcat}/webapps/docs/connectors.html
apr Connector:
http://apr.apache.org/
//The sixth chapter
nginx Official website documents
http://nginx.org/en/docs/
nginx Installation:
http://nginx.org/en/linux_packages.html
ngx_http_stub_status:
http://nginx.org/en/docs/http/ngx_http_stub_status_module.html
ngxtop:
https://github.com/lebinh/ngxtop
nginx-rdd
http://www.linuxde.net/2012/04/9537.html
//The seventh chapter
jvm Runtime data area for
https://docs.oracle.com/javase/specs/jvms/se8/html/index.html
Metaspace
http://ifeve.com/jvm-troubleshooting-guide-4/
//Compress class space
https://blog.csdn.net/jijijijwwi111/article/details/51564271
CodeCache
https://blog.csdn.net/yandaonan/article/details/50844806
http://engineering.indeedblog.com/blog/2016/09/job-search-web-app-java-8-migration/
GC Tuning Guide:
https://docs.oracle.com/javase/8/docs/technotes/guides/vm/gctuning/toc.html
//How to choose a garbage collector
https://docs.oracle.com/javase/8/docs/technotes/guides/vm/gctuning/collectors.html
G1 Best practices
https://docs.oracle.com/javase/8/docs/technotes/guides/vm/gctuning/g1_gc_tuning.html#recommendations
G1 GC Some key technologies of
https://zhuanlan.zhihu.com/p/22591838
CMS Log format
https://blogs.oracle.com/poonam/understanding-cms-gc-logs
G1 Log format
https://blogs.oracle.com/poonam/understanding-g1-gc-logs
GC Log analysis tool
http://gceasy.io/
GCViewer
https://github.com/chewiebug/GCViewer
ZGC:
http://openjdk.java.net/jeps/333
//The eighth chapter
java Virtual machine specification
https://docs.oracle.com/javase/specs/jvms/se8/html/index.html
java language norm
https://docs.oracle.com/javase/specs/jls/se8/html/index.html
javap:
https://docs.oracle.com/javase/8/docs/technotes/tools/unix/javap.html
//Field descriptor
https://docs.oracle.com/javase/specs/jvms/se8/html/jvms-4.html#jvms-4.3.2
//Method Descriptor
https://docs.oracle.com/javase/specs/jvms/se8/html/jvms-4.html#jvms-4.3.3
//Bytecode instruction:
https://docs.oracle.com/javase/specs/jvms/se8/html/jvms-6.html
//Constant pool:
https://docs.oracle.com/javase/specs/jvms/se8/html/jvms-4.html#jvms-4.4
//Local variable table:
https://docs.oracle.com/javase/specs/jvms/se8/html/jvms-2.html#jvms-2.6.1
https://docs.oracle.com/javase/specs/jvms/se8/html/jvms-4.html#jvms-4.7.13
//Operand stack:
https://docs.oracle.com/javase/specs/jvms/se8/html/jvms-2.html#jvms-2.6.2
Code Properties:
https://docs.oracle.com/javase/specs/jvms/se8/html/jvms-4.html#jvms-4.7.3
LineNumberTable:
https://docs.oracle.com/javase/specs/jvms/se8/html/jvms-4.html#jvms-4.7.12
constant variable:
https://docs.oracle.com/javase/specs/jls/se8/html/jls-4.html#jls-4.12.4
//Constant expression
https://docs.oracle.com/javase/specs/jls/se8/html/jls-15.html#jls-15.28
String.intern
https://blog.csdn.net/goldenfish1919/article/details/80410349
String Duplicate removal
https://blog.csdn.net/goldenfish1919/article/details/20233263

