This series of notes is mainly based on "deep understanding of Java virtual machine: JVM advanced features and best practices version 2", which is the reading notes of this book.
jmap command is used to generate memory heap dump snapshot, which is generally called heapdump or dump file.
In addition to the jmap command, you can also use some JVM parameters to let the virtual machine dump the snapshot file automatically when memory overflows.
| parameter | Explain |
|---|---|
| -XX:+HeapDumpOnOutOfMemoryError | Automatically export memory snapshot when memory overflows |
| -XX:HeapDumpPath=E:/dumps/ | Path saved when memory snapshot is exported |
All JDK tools can be found on the Oracle official website Java Tools Reference This is the main reference, including command format, parameter content, output information and so on.
jmap command format:
jmap [ options ] pid
jmap [ options ] executable core
jmap [ options ] [ pid ] server-id@ ] remote-hostname-or-IP
jmap help information:
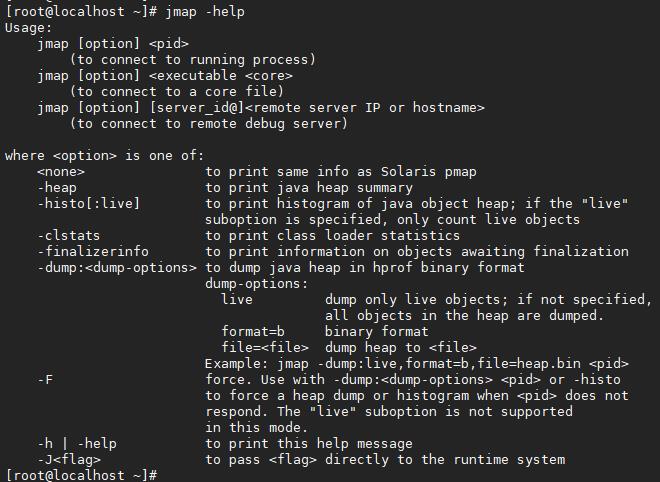
jmap -dump
jmap command uses - dump parameter to generate memory snapshot, and the format of - dump parameter is as follows:
-dump:[live,] format=b, file=filename
For example:
jmap -dump:format=b,file=/dumps/jmap.hprof 21060
The output is as follows:
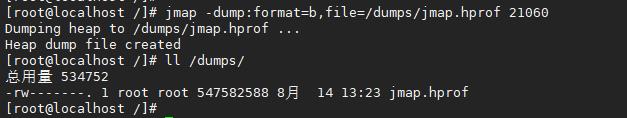
As you can see, the heap snapshot file is generated under the specified directory dumps.
jmap -heap
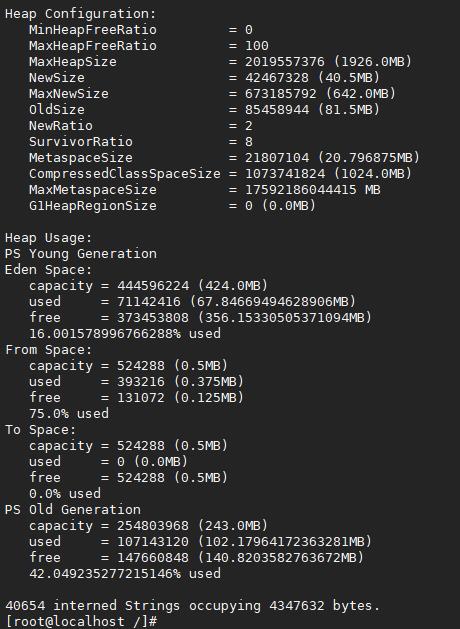
The jmap command uses the - heap parameter to view the configuration information of heap memory and the usage of various areas in the heap, such as the Eden and Survivor areas of the new generation and the old generation.
-The heap parameters are as follows:
jmap -heap 21060
The output is as follows:
Other parameters
jmap command has many other parameters, which can be referred to Java Tools Reference Documents are listed as follows:
<no option>
    When no option is used, the jmap command prints shared object mappings. For each shared object loaded in the target JVM, the start address, size of the mapping, and the full path of the shared object file are printed. This behavior is similar to the Oracle Solaris pmap utility.

-dump:[live,] format=b, file=filename
    Dumps the Java heap in hprof binary format to filename. The live suboption is optional, but when specified, only the active objects in the heap are dumped. To browse the heap dump, you can use the jhat(1) command to read the generated file.

-finalizerinfo
    Prints information about objects that are awaiting finalization.

-heap
    Prints a heap summary of the garbage collection used, the head configuration, and generation-wise heap usage. In addition, the number and size of interned Strings are printed.

-histo[:live]
    Prints a histogram of the heap. For each Java class, the number of objects, memory size in bytes, and the fully qualified class names are printed. The JVM internal class names are printed with an asterisk (*) prefix. If the live suboption is specified, then only active objects are counted.

-clstats
    Prints class loader wise statistics of Java heap. For each class loader, its name, how active it is, address, parent class loader, and the number and size of classes it has loaded are printed.

-F
    Force. Use this option with the jmap -dump or jmap -histo option when the pid does not respond. The live suboption is not supported in this mode.

-h
    Prints a help message.

-help
    Prints a help message.

-Jflag
    Passes flag to the Java Virtual Machine where the jmap command is running.