1. Why should we optimize the jvm?
In the local development environment, we rarely encounter the need to optimize the jvm, but in the production environment, we may have the following requirements:
-
The running application is "stuck", the log does not output, and the program does not respond
-
The CPU load of the server suddenly increases
-
How to allocate the number of threads in multithreaded applications?
-
...
Note: the jdk version used is 1.0 8 .
2. Operating parameters of jvm
There are many parameters that can be set in the jvm, so that the jvm can run efficiently in various environments. Most parameters can be left as default.
2.1. Three parameter types
The parameter types of jvm are divided into three categories:
-
Standard parameters
- help
- version
-
-X parameter (non-standard parameter)
- Xint
- Xcomp
-
-XX parameter (high utilization rate)
- XX:newSize
- XX:+UseSerialGC
2. Standard parameters
The standard parameters of the JVM are generally very stable and will not change in future JVM versions. You can use java - help to retrieve all the standard parameters.
[root@node01 ~]# java ‐help
 usage: java [‐options] class [args...]
					(Execution class)
or java [‐options] ‐jar jarfile [args...]
			(implement jar file)
Options include:
‐d 32       Using 32-bit data model (If available)
‐d 64       Using 64 bit data model (If available)
‐server choice "server" VM
				default VM yes server,
				Because you are running on a server computer.
‐cp <Catalogue and zip/jar Class search path for file>
‐classpath <Catalogue and zip/jar Class search path for file>
			use : Delimited directory, JAR archives
			and ZIP File list, Used to search for class files.
‐D<name>=<value>
			Set system properties
‐verbose:[class|gc|jni]
			Enable verbose output
‐version Output product version and exit
‐version:<value>
			warning: This feature is obsolete, Will be in
			Removed from future releases.
			The specified version is required to run
‐showversion Output product version and continue
‐jre‐restrict‐search | ‐no‐jre‐restrict‐search
			warning: This feature is obsolete, Will be in
			Removed from future releases.
			Include in version search/Exclude user specific JRE
‐? ‐help Output this help message
‐X Output help for nonstandard options
‐ea[:<packagename>...|:<classname>]
‐enableassertions[:<packagename>...|:<classname>]
			Enables assertions at the specified granularity
‐da[:<packagename>...|:<classname>]
‐disableassertions[:<packagename>...|:<classname>]
			Disables assertions with the specified granularity
-esa | ‐enablesystemassertions
			Start system assertion
‐dsa | ‐disablesystemassertions
			Disable system assertion
‐agentlib:<libname>[=<option>]
			Load native agent Library <libname>, for example ‐agentlib:hprof
			See also  ‐agentlib:jdwp=help and ‐agentlib:hprof=help
‐agentpath:<pathname>[=<option>]
			Load native agent library by full pathname
‐javaagent:<jarpath>[=<option>]
			load Java Programming language agent, see also java.lang.instrument
‐splash:<imagepath>
			Displays the startup screen using the specified image
2. 2. 1. Actual combat
Actual combat 1: check the jvm version
[root@node01 ~]# java ‐version
java version "1.8.0_141"
Java(TM) SE Runtime Environment (build 1.8.0_141‐b15)
Java HotSpot(TM) 64‐Bit Server VM (build 25.141‐b15, mixed mode)
#- the showversion parameter means that the version information is printed first and then the following commands are executed. It is very useful during debugging,
It will be used later.
Actual combat 2: set system attribute parameters through - D
public class TestJVM {

	public static void main(String[] args) {
		String str = System.getProperty("str");
		if (str == null) {
			System.out.println("zhangcc");
		} else {
			System.out.println(str);
		}
	}
}
Compile and test:
[root@node01 test]# javac TestJVM.java
#test
[root@node01 test]# java TestJVM
zhangcc
[root@node01 test]# java ‐Dstr=123 TestJVM
123
2. 2. 2. - server and - client parameters
You can set the running parameters of the jvm through - server or - client.
-
The difference between them is that the initial heap space of the Server VM will be larger. By default, the parallel garbage collector is used, which is slow to start and fast to run.
-
The Client VM will be relatively conservative and the initial heap space will be smaller. The serial garbage collector is used to make the JVM start faster, but the running speed will be slower than the Serverm mode.
-
When the JVM starts, it will automatically choose whether to use Server or Client type JVM according to the hardware and operating system.
-
32-bit operating system
-
In the case of a Windows system, the Client type JVM is used by default regardless of the hardware configuration
-
If the machine is configured with more than 2 GB of memory and more than 2 CPU s on other operating systems, the server mode is used by default, otherwise the client mode is used.
-
-
64 bit operating system
- Only server type, not client type.
Test:
[root@node01 test]# java ‐client ‐showversion TestJVM
java version "1.8.0_141"
Java(TM) SE Runtime Environment (build 1.8.0_141‐b15)
Java HotSpot(TM) 64‐Bit Server VM (build 25.141‐b15, mixed mode)
zhangcc
[root@node01 test]# java ‐server ‐showversion TestJVM
java version "1.8.0_141"
Java(TM) SE Runtime Environment (build 1.8.0_141‐b15)
Java HotSpot(TM) 64‐Bit Server VM (build 25.141‐b15, mixed mode)
zhangcc
#Because the machine is a 64 bit system, the client mode is not supported
2.3, - X parameter
The - x parameter of the jvm is a non-standard parameter. The parameters may be different in different versions of the jvm. You can view the non-standard parameters through java -X.
[root@node 01  test]# java ‐X
    -Xmixed           Mixed mode execution (default)
    -Xint             Interpretation mode execution only
    -Xbootclasspath:<use ; Separate directories and zip/jar file>
                      Set the search path to guide classes and resources
    -Xbootclasspath/a:<use ; Separate directories and zip/jar file>
                      Append to the end of the boot classpath
    -Xbootclasspath/p:<use ; Separate directories and zip/jar file>
                      Before the boot classpath
    -Xdiag            Display additional diagnostic messages
    -Xnoclassgc       Disable class garbage collection
    -Xincgc           Enable incremental garbage collection
    -Xloggc:<file>    take GC The status is recorded in the file (Time stamped)
    -Xbatch           Disable background compilation
    -Xms<size>        Set initial Java Heap size
    -Xmx<size>        Set maximum Java Heap size
    -Xss<size>        set up Java Thread stack size
    -Xprof            output cpu Profile data
    -Xfuture          Enable the most stringent checks, Expected future defaults
    -Xrs              reduce Java/VM Use of operating system signals (Refer to the documentation)
    -Xcheck:jni       yes JNI Function to perform additional checks
    -Xshare:off       Do not attempt to use shared class data
    -Xshare:auto      Use shared class data where possible (default)
    -Xshare:on        Require shared data, Otherwise, it will fail.
    -XshowSettings    Show all settings and continue
    -XshowSettings:all
                      Show all settings and continue
    -XshowSettings:vm Show all and vm Relevant settings and continue
    -XshowSettings:properties
                      Show all property settings and continue
    -XshowSettings:locale
                      Show all locale related settings and continue

-X Options are nonstandard, If there is any change, Without notice.
2. 3. 1 ,-Xint,-Xcomp,-Xmixed
-
In interpreted mode, the - Xint flag forces the JVM to execute all bytecodes. Of course, this will slow down the running speed, usually 10 times or more.
-
Xcomp parameter is just the opposite (- Xint). When used for the first time, the JVM will compile all bytecodes into local code, resulting in maximum optimization.
- However, many applications will also suffer some performance losses when using - xcomp. Of course, this is less than using - Xint, because - xcomp does not enable the JVM to enable all the functions of the JIT compiler. The JIT compiler can judge whether to compile or not. If all code is compiled, it is meaningless for some code that is executed only once.
-
Xmixed is a mixed mode, which mixes interpretation mode with compilation mode. It is up to the jvm to decide
The default mode of jvm is also the recommended mode.
Example: force set operation mode
# Force set to interpretation mode
[root@node 01  test]# java ‐showversion ‐Xint TestJVM
java version " 1. 8. 0 _ 141 "
Java(TM) SE Runtime Environment (build  1. 8. 0 _ 141 ‐b 15 )
Java HotSpot(TM)  64 ‐Bit Server VM (build  25. 141 ‐b 15 , interpreted mode)

zhangcc

#Force to compile mode
[root@node 01  test]# java ‐showversion ‐Xcomp TestJVM
java version " 1. 8. 0 _ 141 "
Java(TM) SE Runtime Environment (build  1. 8. 0 _ 141 ‐b 15 )
Java HotSpot(TM)  64 ‐Bit Server VM (build  25. 141 ‐b 15 , compiled mode)

zhangcc
#Note: in compilation mode, the first execution will be slower than that in interpretation mode. Pay attention to observation.

#Default blend mode
[root@node 01  test]# java ‐showversion TestJVM
java version " 1. 8. 0 _ 141 "
Java(TM) SE Runtime Environment (build  1. 8. 0 _ 141 ‐b 15 )
Java HotSpot(TM)  64 ‐Bit Server VM (build  25. 141 ‐b 15 , mixed mode)
zhangcc
2.4, - XX parameters
-XX parameter is also a non-standard parameter, which is mainly used for jvm tuning and debug ging.
-There are two ways to use XX parameter, one is boolean type and the other is non boolean type:
-
boolean type
- Format: - XX: [±] < name > indicates that the < name > attribute is enabled or disabled
- For example: - XX:+DisableExplicitGC means that manual calling GC operation is disabled, that is, calling system Invalid gc()
-
Non boolean type
- Format: - XX: < name > = < value > indicates that the value of < name > attribute is < value >
- For example: - XX:NewRatio= 1 indicates the ratio of the new generation to the old generation
Usage:
[root@node 01  test]# java ‐showversion ‐XX:+DisableExplicitGC TestJVM
java version " 1. 8. 0 _ 141 "
Java(TM) SE Runtime Environment (build  1. 8. 0 _ 141 ‐b 15 )
Java HotSpot(TM)  64 ‐Bit Server VM (build  25. 141 ‐b 15 , mixed mode)
zhangcc
2.5, - Xms and - Xmx parameters
-Xms and - Xmx are the initial size and maximum size of the heap memory of the jvm, respectively.
-Xmx 2048 m: equivalent to - XX:MaxHeapSize. Set the maximum heap memory of the JVM to 2048 M.
-Xms 512 m: equivalent to - XX:InitialHeapSize. Set the JVM's initial heap memory to 512 M.
Properly adjusting the memory size of the jvm can make full use of server resources and make the program run faster.
Example:
[root@node 01  test]# java ‐Xms 512 m ‐Xmx 2048 m TestJVM
zhangcc
2.6. View the operating parameters of the jvm
Sometimes we need to check the operating parameters of the jvm. There may be two situations for this requirement:
First, print out the running parameters when running the java command;
Second, check the parameters of the running java process;
2. 6. 1. Print parameters when running java command
When running the java command to print parameters, you need to add the - XX: + printflagfinal parameter.
[Global flags]
    uintx AdaptiveSizeDecrementScaleFactor          = 4                                   {product}
    uintx AdaptiveSizeMajorGCDecayTimeScale         = 10                                  {product}
    uintx AdaptiveSizePausePolicy                   = 0                                   {product}
    uintx AdaptiveSizePolicyCollectionCostMargin    = 50                                  {product}
    uintx AdaptiveSizePolicyInitializingSteps       = 20                                  {product}
    uintx AdaptiveSizePolicyOutputInterval          = 0                                   {product}
    uintx AdaptiveSizePolicyWeight                  = 10                                  {product}
    uintx AdaptiveSizeThroughPutPolicy              = 0                                   {product}
    uintx AdaptiveTimeWeight                        = 25                                  {product}
     bool AdjustConcurrency                         = false                               {product}
     bool AggressiveOpts                            = false                               {product}
     intx AliasLevel                                = 3                                   {C2 product}
     bool AlignVector                               = false                               {C2 product}
     intx AllocateInstancePrefetchLines             = 1                                   {product}
     intx AllocatePrefetchDistance                  = 192                                 {product}
     intx AllocatePrefetchInstr                     = 3                                   {product}
     intx AllocatePrefetchLines                     = 4                                   {product}
     intx AllocatePrefetchStepSize                  = 64                                  {product}
     intx AllocatePrefetchStyle                     = 1                                   {product}
     bool AllowJNIEnvProxy                          = false                               {product}
     bool AllowNonVirtualCalls                      = false                               {product}
     bool AllowParallelDefineClass                  = false                               {product}
     bool AllowUserSignalHandlers                   = false                               {product}
     bool AlwaysActAsServerClassMachine             = false                               {product}
     bool AlwaysCompileLoopMethods                  = false                               {product}
     bool AlwaysLockClassLoader                     = false                               {product}
     bool AlwaysPreTouch                            = false                               {product}
     bool AlwaysRestoreFPU                          = false                               {product}
     bool AlwaysTenure                              = false                               {product}
     bool AssertOnSuspendWaitFailure                = false                               {product}
     bool AssumeMP                                  = false                               {product}
     intx AutoBoxCacheMax                           = 128                                 {C2 product}
    uintx AutoGCSelectPauseMillis                   = 5000                                {product}
     intx BCEATraceLevel                            = 0                                   {product}
     intx BackEdgeThreshold                         = 100000                              {pd product}
     bool BackgroundCompilation                     = true                                {pd product}
    uintx BaseFootPrintEstimate                     = 268435456                           {product}
     intx BiasedLockingBulkRebiasThreshold          = 20                                  {product}
     intx BiasedLockingBulkRevokeThreshold          = 40                                  {product}
     intx BiasedLockingDecayTime                    = 25000                               {product}
     intx BiasedLockingStartupDelay                 = 4000                                {product}
     bool BindGCTaskThreadsToCPUs                   = false                               {product}
     bool BlockLayoutByFrequency                    = true                                {C2 product}
     intx BlockLayoutMinDiamondPercentage           = 20                                  {C2 product}
     bool BlockLayoutRotateLoops                    = true                                {C2 product}
     bool BranchOnRegister                          = false                               {C2 product}
     bool BytecodeVerificationLocal                 = false                               {product}
..............................
uintx YoungGenerationSizeSupplement             = 80                                  {product}
uintx YoungGenerationSizeSupplementDecay        = 8                                   {product}
    uintx YoungPLABSize                             = 4096                                {product}
     bool ZeroTLAB                                  = false                               {product}
     intx hashCode                                  = 5                                   {product}
java version "1.8.0_141"
Java(TM) SE Runtime Environment (build 1.8.0_141-b12)
Java HotSpot(TM) 64-Bit Server VM (build 25.141-b12, mixed mode)
It can be seen from the above information that the parameters have boolean type and number type, and the value operator is = or: =, representing the default value and the modified value respectively.
Example:
java ‐XX:+PrintFlagsFinal ‐XX:+VerifySharedSpaces ‐version
intx ValueMapInitialSize =  11
{C 1  product}
intx ValueMapMaxLoopSize =  8
{C 1  product}
intx ValueSearchLimit =  1000
{C 2  product}
bool VerifyMergedCPBytecodes = true
{product}
bool VerifySharedSpaces := true
{product}
intx WorkAroundNPTLTimedWaitHang =  1
{product}
uintx YoungGenerationSizeIncrement =  20
{product}
uintx YoungGenerationSizeSupplement =  80
{product}
uintx YoungGenerationSizeSupplementDecay =  8
{product}
uintx YoungPLABSize =  4096
{product}
bool ZeroTLAB = false
{product}
intx hashCode =  5
{product}
java version " 1. 8. 0 _ 141 "
Java(TM) SE Runtime Environment (build  1. 8. 0 _ 141 ‐b 15 )
Java HotSpot(TM)  64 ‐Bit Server VM (build  25. 141 ‐b 15 , mixed mode)

#You can see that the parameter VerifySharedSpaces has been modified.
2. 6. 2. View running jvm parameters
If you want to view the running jvm, you need to view it with the help of jinfo command.
First, observe the parameters of tomcat to start the next test on the virtual machine.
#View all parameters. Usage: jinfo ‐ flags < process ID >
#View java processes through jps or jps ‐ l
[root@node 01  bin]# jps
6346  Jps
6219  Bootstrap

[root@node 01  bin]# jps ‐l
6358  sun.tools.jps.Jps
6219  org.apache.catalina.startup.Bootstrap

[root@node 01  bin]# jinfo ‐flags
Attaching to process ID  6219 , please wait...
Debugger attached successfully.
Server compiler detected.
JVM version is  25. 141 ‐b 15
Non‐default VM flags: ‐XX:CICompilerCount= 2  ‐XX:InitialHeapSize= 31457280
‐XX:MaxHeapSize= 488636416  ‐XX:MaxNewSize= 162529280  ‐
XX:MinHeapDeltaBytes= 524288  ‐XX:NewSize= 10485760  ‐XX:OldSize= 20971520  ‐
XX:+UseCompressedClassPointers ‐XX:+UseCompressedOops ‐
XX:+UseFastUnorderedTimeStamps ‐XX:+UseParallelGC
Command line: ‐Djava.util.logging.config.file=/tmp/apache‐tomcat‐
7. 0. 57 /conf/logging.properties ‐
Djava.util.logging.manager=org.apache.juli.ClassLoaderLogManager ‐
Djava.endorsed.dirs=/tmp/apache‐tomcat‐ 7. 0. 57 /endorsed ‐
Dcatalina.base=/tmp/apache‐tomcat‐ 7. 0. 57  ‐Dcatalina.home=/tmp/apache‐
tomcat‐ 7. 0. 57  ‐Djava.io.tmpdir=/tmp/apache‐tomcat‐ 7. 0. 57 /temp

#View the value of a parameter. Usage: jinfo ‐ flag < parameter name > < process ID >
[root@node 01  bin]# jinfo ‐flag MaxHeapSize
‐XX:MaxHeapSize= 488636416
3. Memory model of jvm
The memory model of jvm is quite different between 1.7 and 1.8. Although this course takes 1.8 as an example, we also need to understand the memory model of 1.7, so in the next, we will learn the memory model of 1.7 first and then 1.8.
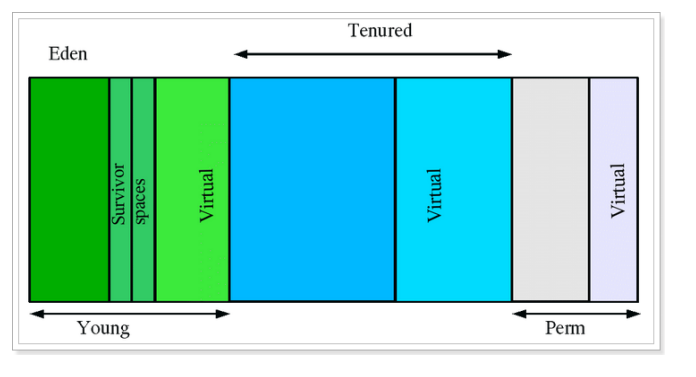
3. 1 ,jdk 1. 7 heap memory model
-
Young youth district (generation)
The Young area is divided into three parts: Eden area and two Survivor areas with the same size. In the Survivor area, only one of them is used at a certain time, and the other is reserved for copying objects during garbage collection. When the Eden area becomes full, the GC will move the surviving objects to the idle Survivor area. According to the strategy of the JVM, After several garbage collections, objects that still survive will be moved to the Tenured section.
-
Tenured elderly area
The Tenured area mainly stores objects with a long life cycle, generally old objects. When some objects are copied and transferred in Young for a certain number of times, the objects will be transferred to the Tenured area. Generally, if the application level cache is used in the system, the objects in the cache will often be transferred to this area. -
Perm permanent area
The perm generation mainly saves class, method and filed objects. Generally, this part of the space will not overflow unless many classes are loaded at one time. However, when it comes to hot deployed application servers, sometimes Java Lang. outofmemoryerror: the error of permgen space may be caused by redeployment every time, but the class of the class is not uninstalled after redeployment, resulting in a large number of class objects saved in perm. In this case, restarting the application server can solve the problem. -
Virtual zone:
The difference between the maximum memory and the initial memory is the Virtual area.
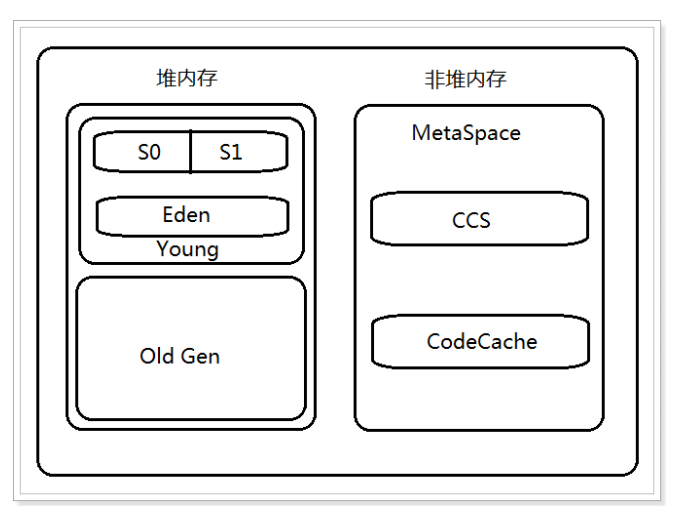
3. 2 ,jdk 1. 8 heap memory model
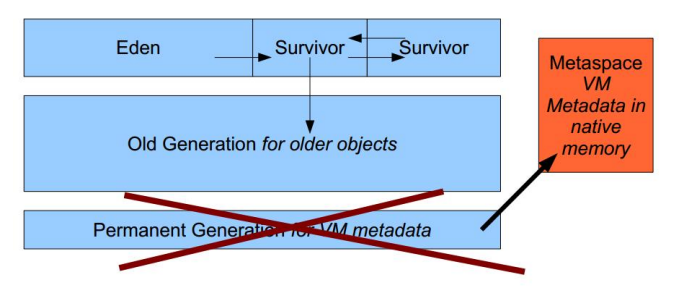
As can be seen from the above figure, the memory model of jdk 1.8 consists of two parts, young generation + old generation.
Younger generation: Eden + 2 *Survivor
Old generation: OldGen
In JDK 1 The Perm area with the largest change in 8 is replaced with Metaspace.
It should be noted that the memory space occupied by Metaspace is not in the virtual machine, but in the local memory space, which is also the same as 1 The biggest difference between the permanent generation of 7.
3. Why should it be abandoned 1 Permanent area in 7?
The official website explains: http://openjdk.java.net/jeps/ one hundred and twenty-two
This is part of the JRockit and Hotspot convergence effort. JRockit
customers do not need to configure the permanent generation (since JRockit
does not have a permanent generation) and are accustomed to not
configuring the permanent generation.

Removing the permanent generation is for fusion HotSpot JVM And JRockit VM And make efforts because JRockit There is no permanent generation,
Permanent generation does not need to be configured.
In real use, because the permanent generation memory is often insufficient or memory leakage occurs, an exception is reported lang.OutOfMemoryError: PermGen. Based on this, the permanent area is discarded, and the meta space is used instead, and the local memory space is used instead.
3. 4. Check the heap memory usage through jstat command
The jstat command can view the usage of various parts of heap memory and the number of loaded classes. The format of the command is as follows:
jstat [- command options] [vmid] [interval / MS] [query times]
3. 4. 1. View class loading statistics
[root@node 01  ~]# jps
7080  Jps
6219  Bootstrap

[root@node 01  ~]# jstat ‐class
Loaded Bytes Unloaded Bytes Time
  3273  7122. 3        0     0. 0       3. 98
explain:
-
Loaded: the number of class es loaded
-
Bytes: occupied space
-
Unloaded: unloaded quantity
-
Bytes: occupied space not loaded
-
Time: time
3. 4. 2. View compilation statistics
[root@node 01  ~]# jstat ‐compiler
Compiled Failed Invalid Time FailedType FailedMethod
    2376      1       0     8. 04          1
org/apache/tomcat/util/IntrospectionUtils setProperty
explain:
-
Compiled: compiled quantity.
-
Failed: number of failures
-
Invalid: unavailable quantity
-
Time: time
-
FailedType: failure type
-
FailedMethod: failed method
3. 4. 3. Garbage collection statistics
[root@node 01  ~]# jstat ‐gc
S 0 C S 1 C S 0 U S 1 U EC EU OC OU MC
MU CCSC CCSU YGC YGCT FGC FGCT GCT
9216. 0 8704. 0  0. 0   6127. 3 62976. 0   3560. 4   33792. 0    20434. 9
23808. 0 23196. 1 2560. 0 2361. 6      7    1. 078   1      0. 244    1. 323

#You can also specify the interval and times of printing, printing once every 1 second, a total of 5 times
[root@node 01  ~]# jstat ‐gc  621 9 10 00
S 0 C S 1 C S 0 U S 1 U EC EU OC OU MC
MU CCSC CCSU YGC YGCT FGC FGCT GCT
9216. 0 8704. 0  0. 0   6127. 3 62976. 0   3917. 3   33792. 0    20434. 9
23808. 0 23196. 1 2560. 0 2361. 6      7    1. 078   1      0. 244    1. 323
9216. 0 8704. 0  0. 0   6127. 3 62976. 0   3917. 3   33792. 0    20434. 9
23808. 0 23196. 1 2560. 0 2361. 6      7    1. 078   1      0. 244    1. 323
9216. 0 8704. 0  0. 0   6127. 3 62976. 0   3917. 3   33792. 0    20434. 9
23808. 0 23196. 1 2560. 0 2361. 6      7    1. 078   1      0. 244    1. 323
9216. 0 8704. 0  0. 0   6127. 3 62976. 0   3917. 3   33792. 0    20434. 9
23808. 0 23196. 1 2560. 0 2361. 6      7    1. 078   1      0. 244    1. 323
9216. 0 8704. 0  0. 0   6127. 3 62976. 0   3917. 3   33792. 0    20434. 9
23808. 0 23196. 1 2560. 0 2361. 6      7    1. 078   1      0. 244    1. 323
explain:
-
S 0 C: the size of the first Survivor area (KB)
-
S 1 C: the size of the second Survivor area (KB)
-
S 0 U: use size of the first Survivor area (KB)
-
S 1 U: usage size of the second Survivor area (KB)
-
EC: Eden zone size (KB)
-
EU: used size of Eden area (KB)
-
OC: Old area size (KB)
-
OU: Old usage size (KB)
-
MC: method area size (KB)
-
MU: method area usage size (KB)
-
CCSC: compressed class space size (KB)
-
CCU: compressed class space usage size (KB)
-
YGC: garbage collection times of young generation
-
YGCT: waste collection time of young generation
-
FGC: garbage collection times in old age
-
FGCT: waste collection time in old age
-
GCT: total time consumed by garbage collection
4. jmap usage and memory overflow analysis
jstat can be used to statistically analyze the memory of jvm heap, while jmap can obtain more detailed contents, such as summary of memory usage, location and analysis of memory overflow.
4. 1. Check the memory usage
[root@node^01 ~]# jmap ‐heap 6219
Attaching to process ID  6219 , please wait...
Debugger attached successfully.
Server compiler detected.
JVM version is  25. 141 ‐b 15

using thread‐local object allocation.
Parallel GC with  2  thread(s)

Heap Configuration: #Heap memory configuration information
	MinHeapFreeRatio =  0
	MaxHeapFreeRatio =  100
	MaxHeapSize =  488636416  ( 466. 0 MB)
	NewSize =  10485760  ( 10. 0 MB)
	MaxNewSize =  162529280  ( 155. 0 MB)
	OldSize =  20971520  ( 20. 0 MB)
	NewRatio =  2
	SurvivorRatio =  8
	MetaspaceSize =  21807104  ( 20. 796875 MB)
	CompressedClassSpaceSize =  1073741824  ( 1024. 0 MB)
	MaxMetaspaceSize =  17592186044415  MB
	G 1 HeapRegionSize =  0  ( 0. 0 MB)

Heap Usage: # Heap memory usage
	PS Young Generation #Young generation
	Eden Space:
	capacity =  123731968  ( 118. 0 MB)
	used =  1384736  ( 1. 320587158203125 MB)
	free =  122347232  ( 116. 67941284179688 MB)
  	 1. 1191416594941737 % used
From Space:
	capacity =  9437184  ( 9. 0 MB)
	used =  0  ( 0. 0 MB)
	free =  9437184  ( 9. 0 MB)
   	0. 0 % used
To Space:
	capacity =  9437184  ( 9. 0 MB)
	used =  0  ( 0. 0 MB)
	free =  9437184  ( 9. 0 MB)
   	0. 0 % used
PS Old Generation #Tenured
	capacity =  28311552  ( 27. 0 MB)
	used =  13698672  ( 13. 064071655273438 MB)
	free =  14612880  ( 13. 935928344726562 MB)
   	48. 38545057508681 % used
	13648  interned Strings occupying  1866368  bytes.
4.2. Check the number and size of objects in memory
#View all objects, both active and inactive
jmap ‐histo <pid> | more

#View active objects
jmap ‐histo:live <pid> | more

[root@node 01  ~]# jmap ‐histo:live  6219  | more

  num #instances #bytes class name
‐‐‐‐‐‐‐‐‐‐‐‐‐‐‐‐‐‐‐‐‐‐‐‐‐‐‐‐‐‐‐‐‐‐‐‐‐‐‐‐‐‐‐‐‐‐
   1 :          37437        7914608   [C
   2 :          34916         837984   java.lang.String
   3 :            884         654848   [B
   4 :          17188         550016   java.util.HashMap$Node
   5 :           3674         424968   java.lang.Class
   6 :           6322         395512   [Ljava.lang.Object;
   7 :           3738         328944   java.lang.reflect.Method
   8 :           1028         208048   [Ljava.util.HashMap$Node;
   9 :           2247         144264   [I
  10 :           4305         137760
java.util.concurrent.ConcurrentHashMap$Node
  11 :           1270         109080   [Ljava.lang.String;
  12 :             64          84128
[Ljava.util.concurrent.ConcurrentHashMap$Node;
  13 :           1714          82272   java.util.HashMap
  14 :           3285          70072   [Ljava.lang.Class;
  15 :           2888          69312   java.util.ArrayList
  16 :           3983          63728   java.lang.Object
  17 :           1271          61008
org.apache.tomcat.util.digester.CallMethodRule
  18 :           1518          60720   java.util.LinkedHashMap$Entry
  19 :           1671          53472
com.sun.org.apache.xerces.internal.xni.QName
  20 :             88          50880   [Ljava.util.WeakHashMap$Entry;
  21 :            618          49440   java.lang.reflect.Constructor
  22 :           1545          49440   java.util.Hashtable$Entry
  23 :           1027          41080   java.util.TreeMap$Entry
  24 :            846          40608
	..............ellipsis........
#Object description
B byte
C char
D double
F float
I int
J long
Z boolean
[ Array, such as[I express int[]
[L+Class name other objects
4. 3. dump the memory usage into the file
Sometimes we need to dump the current memory of the jvm into a file, and then analyze it. jmap also supports dump into a file.
#Usage:
    jmap ‐dump:format=b,file=dumpFileName <pid>

#Examples
    jmap ‐dump:format=b,file=/tmp/dump.dat  6219
You can see that dump has been generated under / tmp Dat file.
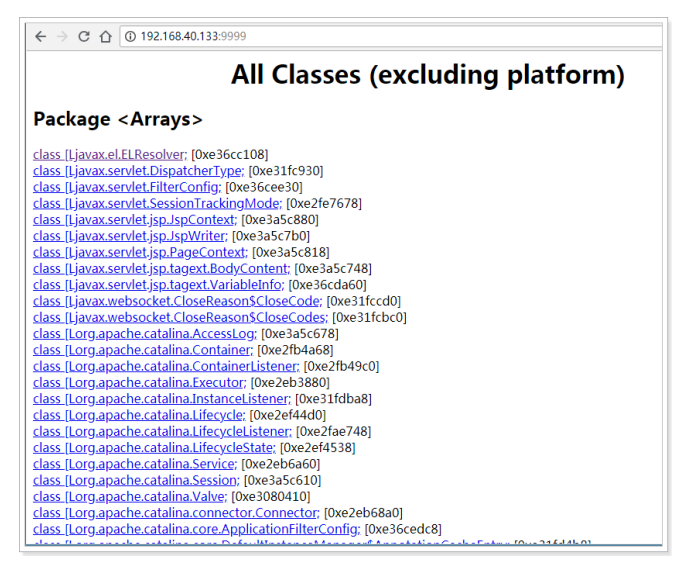
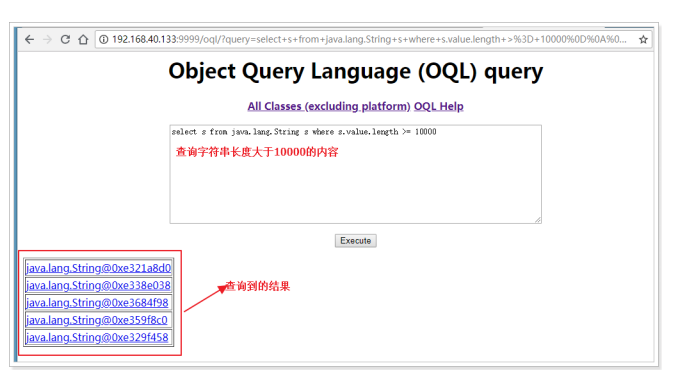
4. Analyze dump file through jhat
In the previous section, we dump the memory of the jvm into a file. This file is a binary file, which is inconvenient to view. At this time, we can view it with the help of jhat tool.
#Usage:
    jhat ‐port <port> <file>
#Example:
[root@node 01  tmp]# jhat ‐port  9999  /tmp/dump.dat
Reading from /tmp/dump.dat...
Dump file created Mon Sep  10 01 : 04 : 21  CST  2018
Snapshot read, resolving...
Resolving  204094  objects...
Chasing references, expect  40
dots........................................
Eliminating duplicate references........................................
Snapshot resolved.
Started HTTP server on port  9999
Server is ready.
Open a browser to access: http: / / 192 168. 40. 133 : 9999 /
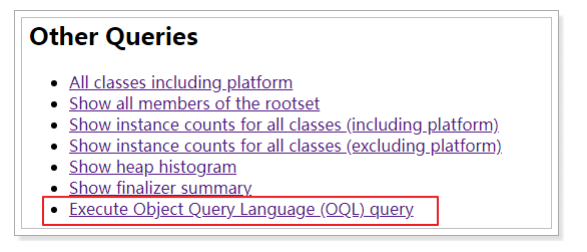
OQL query function is at the end.
4.5. Analyze dump file through MAT tool
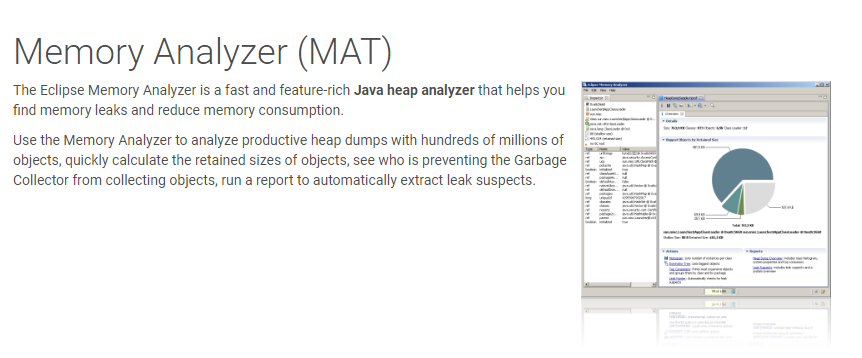
4. 5. 1. Introduction to MAT tool
MAT(Memory Analyzer Tool), a memory analysis tool based on Eclipse, is a fast and feature rich JAVA heap analysis tool, which can help us find memory leaks and reduce memory consumption. Use the memory analysis tool to analyze from a large number of objects, quickly calculate the occupation size of objects in memory, see who prevented the garbage collector from recycling, and visually view the objects that may cause this result through the report.
Official website address: https://www.eclipse.org/mat/
4. 5. 2. Download and install
Download address: https://www.eclipse.org/mat/downloads.php
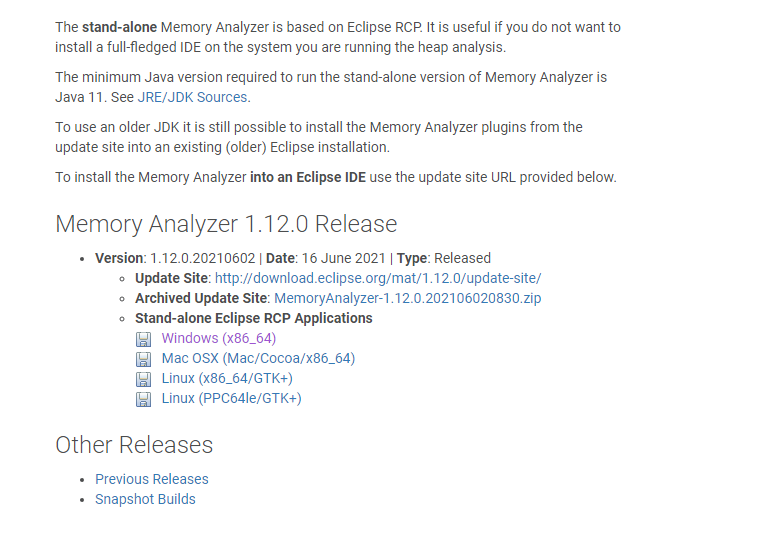
Will download the obtained memoryanalyzer-1.8.0.20180604-win32 win32. x86_ Unzip 64.zip:
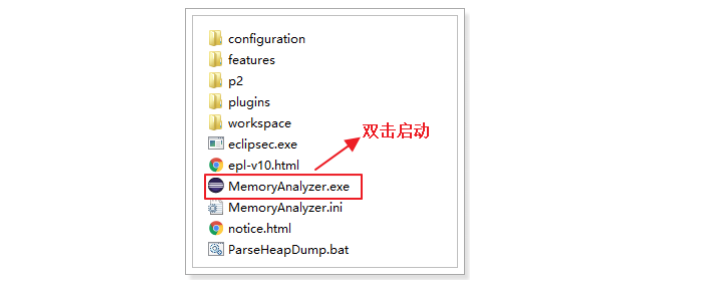
4. 5. 3. Use
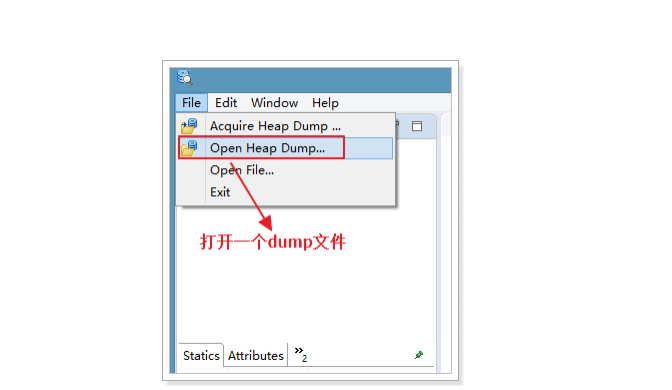
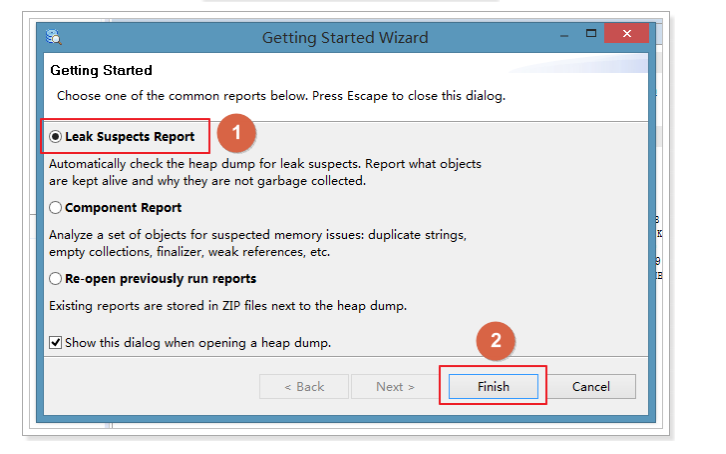

To view an object and its dependencies:
To view an analysis of possible memory leaks:
5. Actual combat: location and analysis of memory overflow
Memory overflow is often encountered in the actual production environment. For example, constantly writing data to a collection, dead circulation, reading oversized files and so on may cause memory overflow.
If there is a memory overflow, first of all, we need to locate the link where the memory overflow occurs and analyze whether it is normal or abnormal. If it is a normal demand, we should consider increasing the memory setting. If it is an abnormal demand, we should modify the code and fix the bug.
First, we have to learn how to locate the problem before we analyze it. How to locate the problem? We need to use jmap and MAT tools for location analysis.
Next, we simulate the memory overflow scenario.
5.1. Simulate memory overflow
Write code to add 1 million strings to the List set, each consisting of 1000 UUID s. If the program can execute normally, print ok at last.
package cn.zhangcc.jvm;

import java.util.ArrayList;
import java.util.List;
import java.util.UUID;

public class TestJvmOutOfMemory {
    public static void main(String[] args) {
		List<Object> list = new ArrayList<>();
			for (int i =  0 ; i <  10000000 ; i++) {
				String str = "";
				for (int j =  0 ; j <  1000 ; j++) {
					str += UUID.randomUUID().toString();
				}
				list.add(str);
			}
			System.out.println("ok");
	}
}
#The parameters are as follows:
-Xms8m -Xmx8m -XX:+HeapDumpOnOutOfMemoryError
5.2. Operation test
The test results are as follows:
java.lang.OutOfMemoryError: Java heap space
Dumping heap to java_pid 5348 .hprof ...
Heap dump file created [ 8137186  bytes in  0. 032  secs]
Exception in thread "main" java.lang.OutOfMemoryError: Java heap space
at java.util.Arrays.copyOf(Arrays.java: 3332 )
at
java.lang.AbstractStringBuilder.ensureCapacityInternal(AbstractStringBuil
der.java: 124 )
at
java.lang.AbstractStringBuilder.append(AbstractStringBuilder.java: 448 )
at java.lang.StringBuilder.append(StringBuilder.java: 136 )
at cn.itcast.jvm.TestJvmOutOfMemory.main(TestJvmOutOfMemory.java: 14 )

Process finished with exit code  1
You can see that when a memory overflow occurs, the dump file will be to java_pid 5348 .hprof.
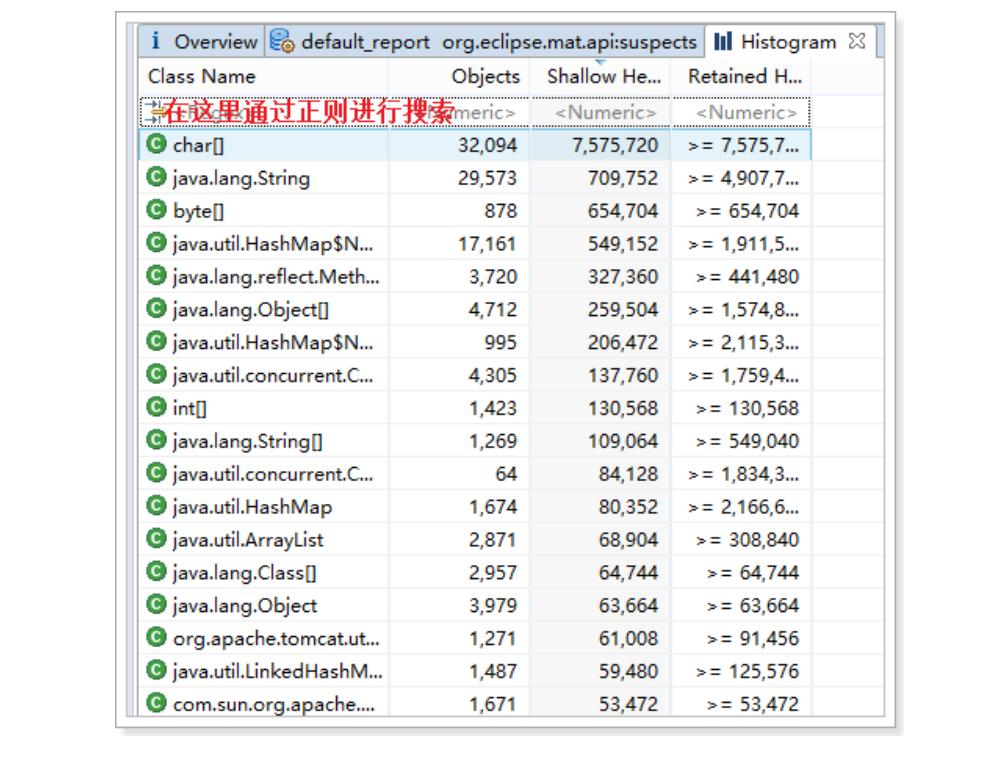
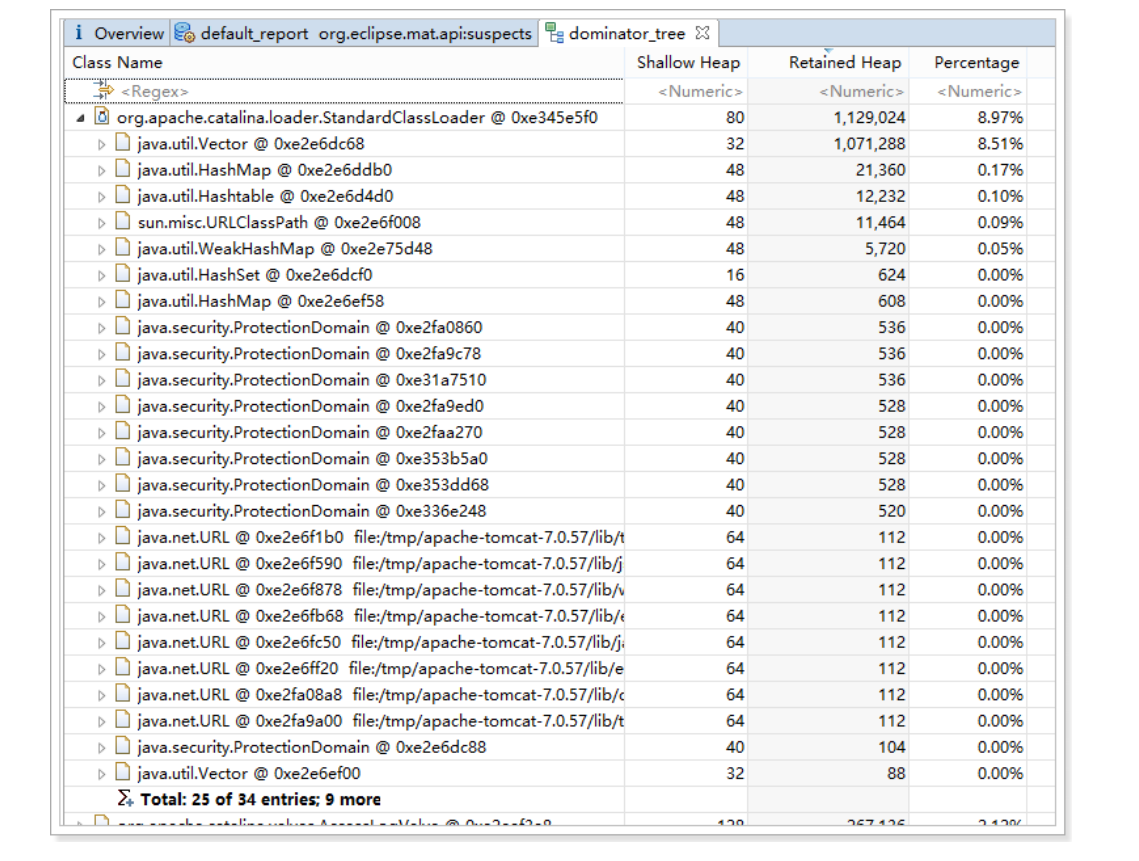
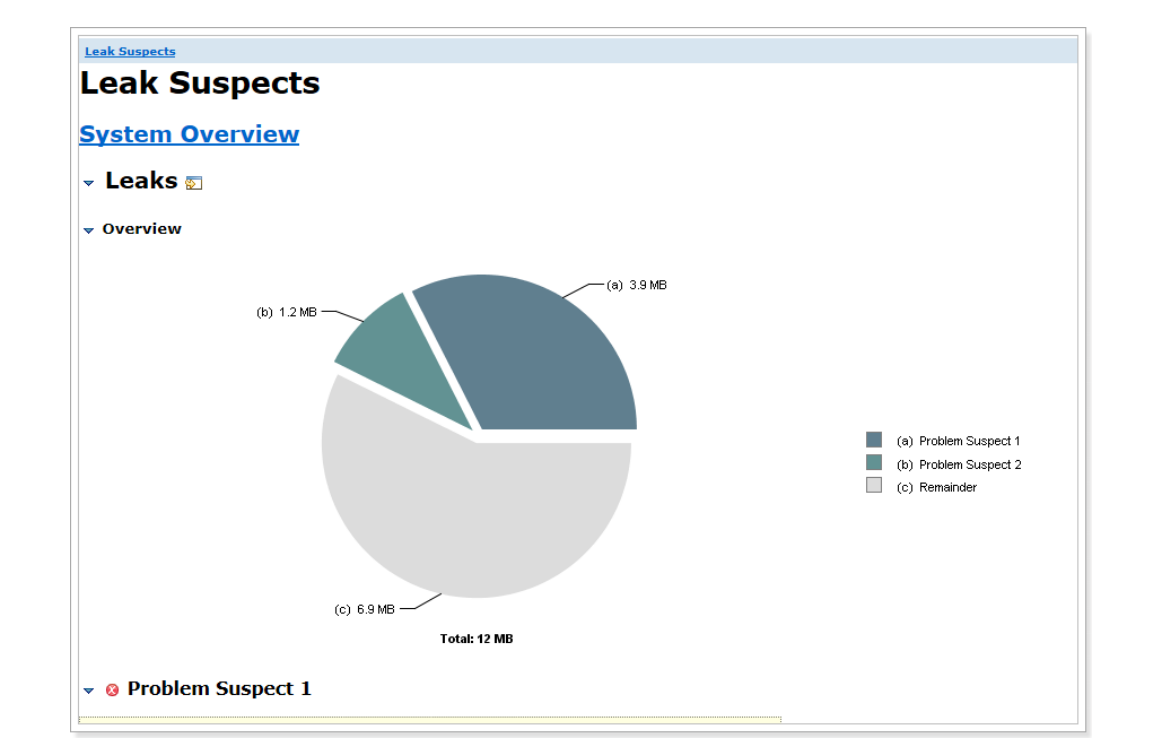
5.3. Import into MAT tool for analysis
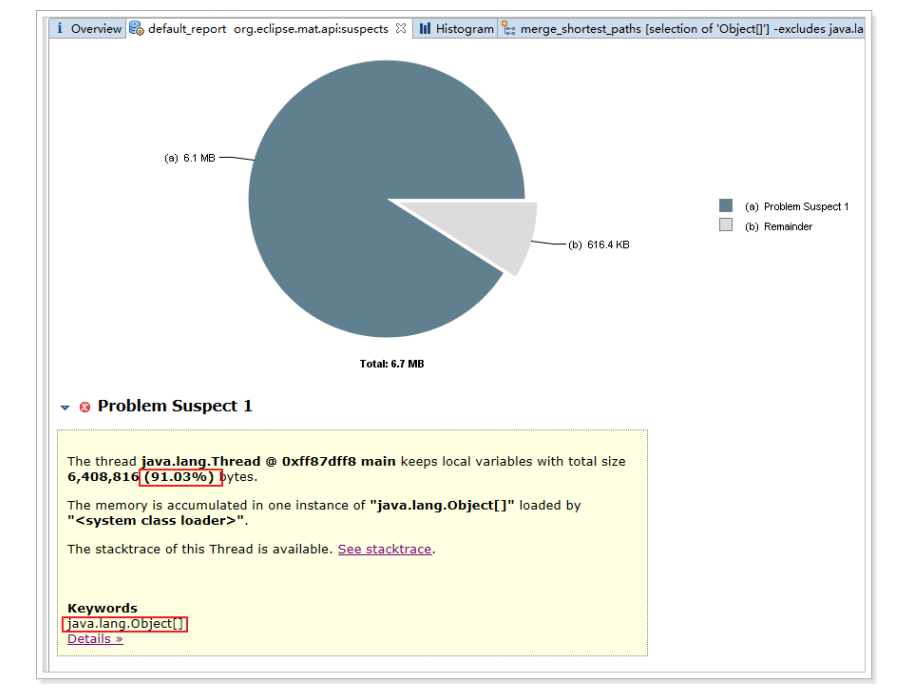
It can be seen that 91.03% of the memory is occupied by the Object [] array, so it is suspicious.
Analysis: this suspicion is correct, because it has occupied more than 90% of the memory, which is very likely to have memory overflow.
View Details:

You can see that a large number of uuid strings are stored in the collection.
6. Use of jstack
Sometimes we need to check the thread execution in the jvm. For example, we find that the CPU load of the server suddenly increases, deadlocks and loops occur. How can we analyze them?
Since the program runs normally without any output, and there is no problem in the log, you need to look at the execution of the internal thread of the jvm, and then analyze it to find out the reason.
At this time, you need to use the jstack command. The function of jstack is to take a snapshot of the threads of the running jvm and print it:
#Usage: jstack < PID >

[root@node 01  bin]# jstack  2203
Full thread dump Java HotSpot(TM)  64 ‐Bit Server VM ( 25. 141 ‐b 15  mixed mode):

"Attach Listener" # 24  daemon prio= 9  os_prio= 0  tid= 0 x 00007 fabb 4001000
nid= 0 x 906  waiting on condition [ 0 x 0000000000000000 ]
java.lang.Thread.State: RUNNABLE

 "http‐bio‐ 8080 ‐exec‐ 5 " # 23  daemon prio= 5  os_prio= 0  tid= 0 x 00007 fabb 057 c 000
nid= 0 x 8 e 1  waiting on condition [ 0 x 00007 fabd 05 b 8000 ]
java.lang.Thread.State: WAITING (parking)
at sun.misc.Unsafe.park(Native Method)
‐ parking to wait for < 0 x 00000000 f 8508360 > (a
java.util.concurrent.locks.AbstractQueuedSynchronizer$ConditionObject)
at java.util.concurrent.locks.LockSupport.park(LockSupport.java: 175 )
at
java.util.concurrent.locks.AbstractQueuedSynchronizer$ConditionObject.awa
it(AbstractQueuedSynchronizer.java: 2039 )
at
java.util.concurrent.LinkedBlockingQueue.take(LinkedBlockingQueue.java: 44
2 )
at org.apache.tomcat.util.threads.TaskQueue.take(TaskQueue.java: 104 )
at org.apache.tomcat.util.threads.TaskQueue.take(TaskQueue.java: 32 )
at
java.util.concurrent.ThreadPoolExecutor.getTask(ThreadPoolExecutor.java: 1074 )
at
java.util.concurrent.ThreadPoolExecutor.runWorker(ThreadPoolExecutor.java: 1134 )
at
java.util.concurrent.ThreadPoolExecutor$Worker.run(ThreadPoolExecutor.java: 624 )
at
org.apache.tomcat.util.threads.TaskThread$WrappingRunnable.run(TaskThread.java: 61 )
at java.lang.Thread.run(Thread.java: 748 )

"http‐bio‐ 8080 ‐exec‐ 5 " # 23  daemon prio= 5  os_prio= 0  tid= 0 x 00007 fabb 057 c 000
nid= 0 x 8 e 1  waiting on condition [ 0 x 00007 fabd 05 b 8000 ]
java.lang.Thread.State: WAITING (parking)
at sun.misc.Unsafe.park(Native Method)
‐ parking to wait for < 0 x 00000000 f 8508360 > (a
java.util.concurrent.locks.AbstractQueuedSynchronizer$ConditionObject)
at java.util.concurrent.locks.LockSupport.park(LockSupport.java: 175 )
at
java.util.concurrent.locks.AbstractQueuedSynchronizer$ConditionObject.awa
it(AbstractQueuedSynchronizer.java: 2039 )
at
java.util.concurrent.LinkedBlockingQueue.take(LinkedBlockingQueue.java: 442 )
at org.apache.tomcat.util.threads.TaskQueue.take(TaskQueue.java: 104 )
at org.apache.tomcat.util.threads.TaskQueue.take(TaskQueue.java: 32 )
at
java.util.concurrent.ThreadPoolExecutor.getTask(ThreadPoolExecutor.java: 1074 )
at
java.util.concurrent.ThreadPoolExecutor.runWorker(ThreadPoolExecutor.java: 1134 )
at
java.util.concurrent.ThreadPoolExecutor$Worker.run(ThreadPoolExecutor.java: 624 )
at
org.apache.tomcat.util.threads.TaskThread$WrappingRunnable.run(TaskThread.java: 61 )
at java.lang.Thread.run(Thread.java: 748 )
..........slightly........................
6.1. Thread status
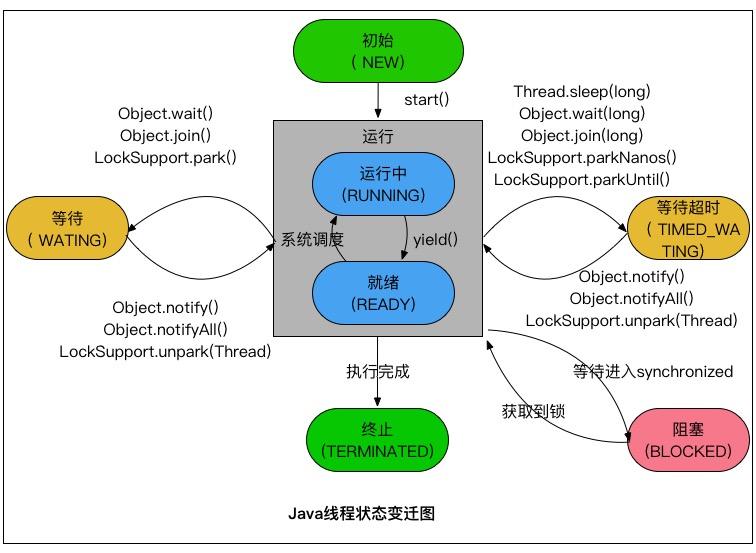
In Java, thread states are divided into six types:
-
Initial state (NEW)
- When a Thread object is created, but start() has not been called to start the Thread, the Thread is in the initial state.
-
RUNNABLE: in Java, RUNNABLE includes ready state and running state.
-
Ready
-
The thread in this state has obtained all the resources required for execution, and can run as long as the CPU allocates execution rights.
-
All ready threads are stored in the ready queue.
-
-
Running state
- Get the CPU execution right and the thread being executed.
- Since a CPU can only execute one thread at a time, each CPU has only one running thread at each time.
-
-
BLOCKED
-
When an executing thread fails to request a resource, it will enter the blocking state.
-
In Java, blocking state refers to the state entered when the request for lock fails.
-
A blocking queue stores all threads in blocking state.
-
The thread in the blocking state will constantly request resources. Once the request is successful, it will enter the ready queue and wait for execution.
-
-
WAITING
-
When the wait, join and park functions are invoked in the current thread, the current thread will enter the wait state.
-
There is also a waiting queue to store all waiting threads.
-
A thread in a waiting state indicates that it needs to wait for instructions from other threads to continue running.
-
Threads entering the waiting state will release CPU execution rights and resources (such as locks)
-
-
TIMED_WAITING
-
When the running thread calls sleep(time), wait, join, parkNanos and parkUntil, it will enter this state;
-
Like the waiting state, it is not because the resource cannot be requested, but actively enters, and needs other threads to wake up after entering;
-
After entering this state, release the CPU Execution Authority ^ and the resources occupied by ^.
-
The difference from the waiting state: after the timeout, it automatically enters the blocking queue and starts competing for locks.
-
-
TERMINATED
- The state of a thread after its execution ends.
6.2. Actual combat: deadlock problem
If a deadlock occurs in the production environment, we will see that the deployed program has no response. At this time, we can analyze it with the help of jstack. Let's find the cause of the deadlock in actual combat.
6. 2. 1. Construct deadlock
Write code and start two threads. Thread 1 gets the obj 1 lock. When it is ready to get the obj 2 lock, obj 2 has been locked by Thread 2, so a deadlock is sent.
public class TestDeadLock {

    private static Object obj 1  = new Object();

    private static Object obj 2  = new Object();

    public static void main(String[] args) {
		new Thread(new Thread 1 ()).start();
		new Thread(new Thread 2 ()).start();
	}

    private static class Thread1  implements Runnable{
		@Override
		public void run() {
			synchronized (obj 1 ){
				System.out.println("Thread 1  Got it obj 1  My lock!");
    			try {
                    // The meaning of pausing for 2 seconds is to let the Thread 2 thread get the lock of obj 2
                    Thread.sleep( 2000 );
                } catch (InterruptedException e) {
                    e.printStackTrace();
                }
            synchronized (obj 2 ){
				System.out.println("Thread 1  Got it obj 2  My lock!");
			}
		}
	}
    private static class Thread 2  implements Runnable{
		@Override
		public void run() {
			synchronized (obj2 ){
				System.out.println("Thread 2  Got it obj 2  My lock!");
        	try {
                // The meaning of pausing for 2 seconds is to let Thread 1 get the lock of obj 1
             	Thread.sleep( 2000 );
			} catch (InterruptedException e) {
				e.printStackTrace();
			}
		}
           synchronized (obj 1 ){
				System.out.println("Thread 2  Got it obj 1  My lock!");
			}
		}
	}
}
6. 2. 2. Running on linux
[root@node 01  test]# javac TestDeadLock.java
[root@node 01  test]# ll
 Total consumption 28
‐rw‐r‐‐r‐‐.  1  root root   184 9 November 10 : 39  TestDeadLock$ 1 .class
‐rw‐r‐‐r‐‐.  1  root root   843 9 November 10 : 39  TestDeadLock.class
‐rw‐r‐‐r‐‐.  1  root root  1567 9 November 10 : 39  TestDeadLock.java
‐rw‐r‐‐r‐‐.  1  root root  1078 9 November 10 : 39  TestDeadLock$Thread 1 .class
‐rw‐r‐‐r‐‐.  1  root root  1078 9 November 10 : 39  TestDeadLock$Thread 2 .class
‐rw‐r‐‐r‐‐.  1  root root   573 9 month    9 10 : 21  TestJVM.class
‐rw‐r‐‐r‐‐.  1  root root   261 9 month    9 10 : 21  TestJVM.java

[root@node 01  test]# java TestDeadLock
Thread 1  Got it obj 1  My lock!
Thread 2  Got it obj 2  My lock!
#There is a deadlock and the program will wait
6. 2. 3. Analysis using jstack
[root@node 01  ~]# jstack  3256
Full thread dump Java HotSpot(TM)  64 ‐Bit Server VM ( 25. 141 ‐b 15  mixed mode):

................slightly..................
"Thread‐1":
	at TestDeadLock$Thread2.run(TestDeadLock.java:47)
	‐ waiting to lock <0x00000000f655dc40> (a java.lang.Object)
	‐ locked <0x00000000f655dc50> (a java.lang.Object)
	at java.lang.Thread.run(Thread.java:748)
"Thread‐0":
	at TestDeadLock$Thread1.run(TestDeadLock.java:27)
	‐ waiting to lock <0x00000000f655dc50> (a java.lang.Object)
	‐ locked <0x00000000f655dc40> (a java.lang.Object)
	at java.lang.Thread.run(Thread.java:748)
................slightly..................
Found 1 deadlock.
In the output information, it has been seen that one deadlock is found, which can be clearly seen:
Thread 2 acquired the lock of < 0x00000000f655dc50 >, waiting for the lock of < 0 x 00000000f655dc40 >
Thread 1 has acquired the lock of < 0x00000000f655dc40 >, waiting to acquire the lock of < 0x00000000f655dc50 >
It can be seen that a deadlock has occurred.
7. Use of VisualVM tools
VisualVM can monitor the thread and memory, view the CPU time of the method and the objects in memory, the objects that have been GC, and reverse the allocated stack (for example, which objects allocate 100 String objects).
VisualVM is easy to use, almost 0 configured, and has rich functions, almost including all the functions of other JDK commands.
-
Memory information
-
Thread information
-
Dump heap (local process)
-
Dump thread (local process)
-
Open heap Dump. Heap Dump can be generated by jmap.
-
Open thread Dump
-
Generate application snapshot (including memory information, thread information, etc.)
-
Performance analysis. CPU analysis (calling time of each method, checking which methods take more time), memory analysis (memory occupied by various objects, checking which classes occupy more memory)
-
...
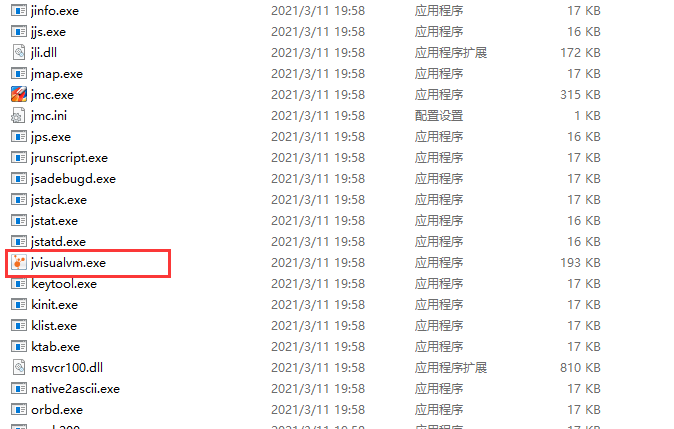
7.1. Startup
Under the bin directory of the jdk installation directory, find jvisualvm Exe, double click to open it.
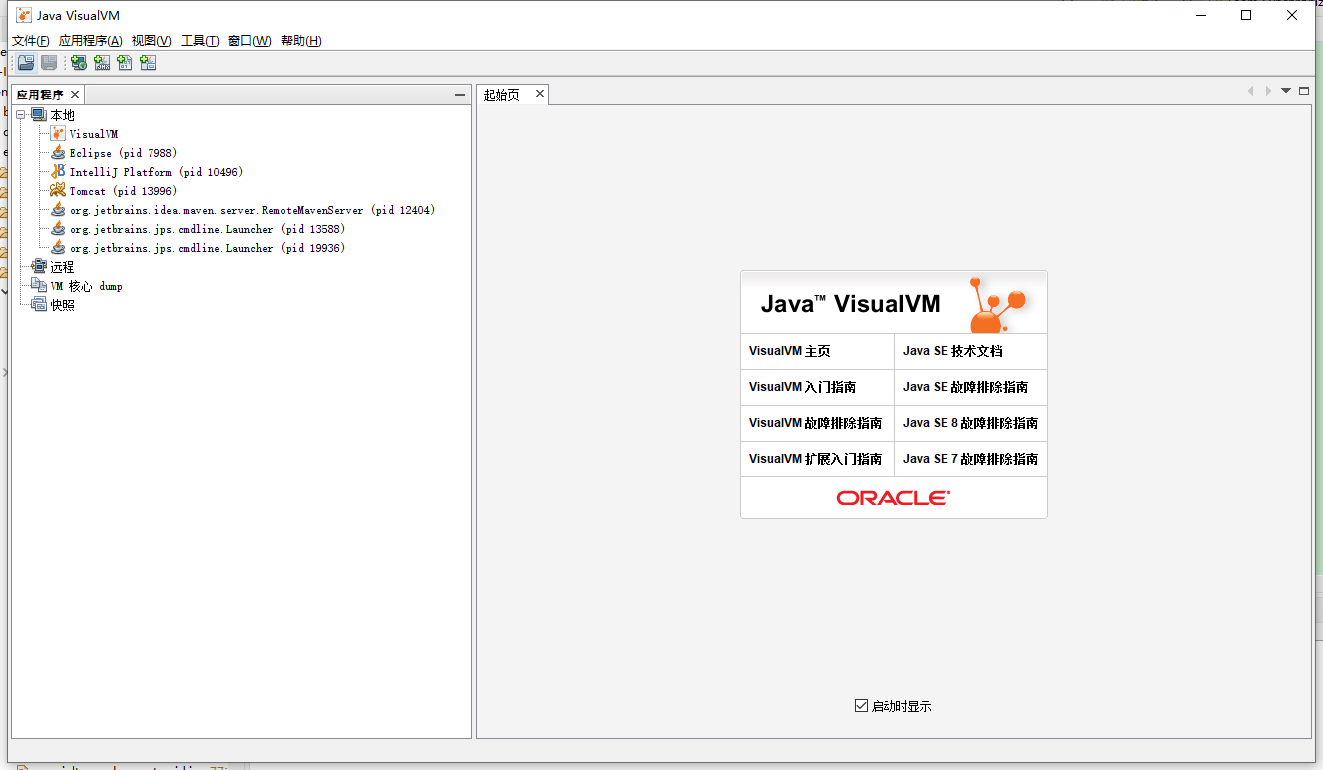
7.2. View local processes
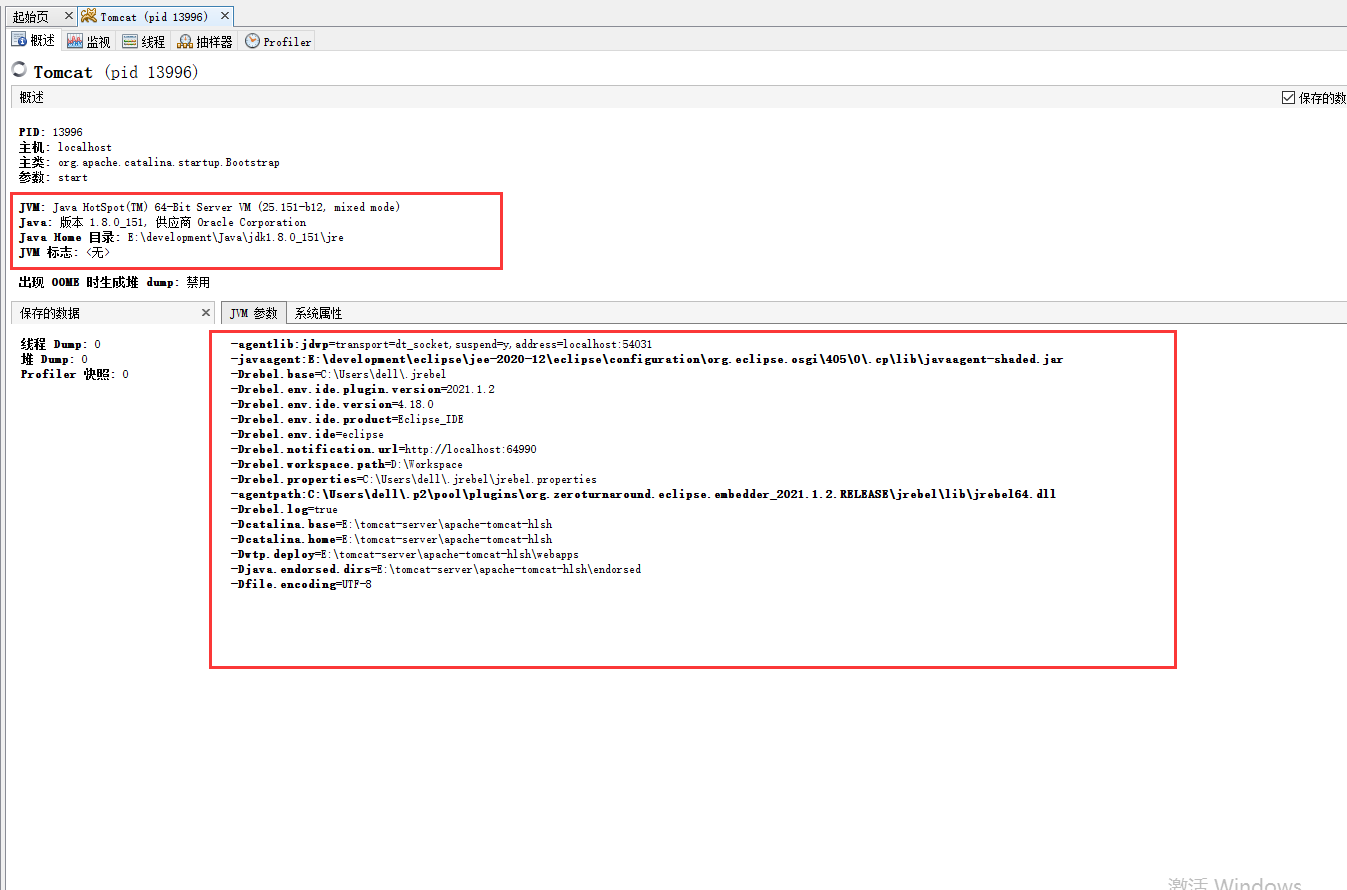
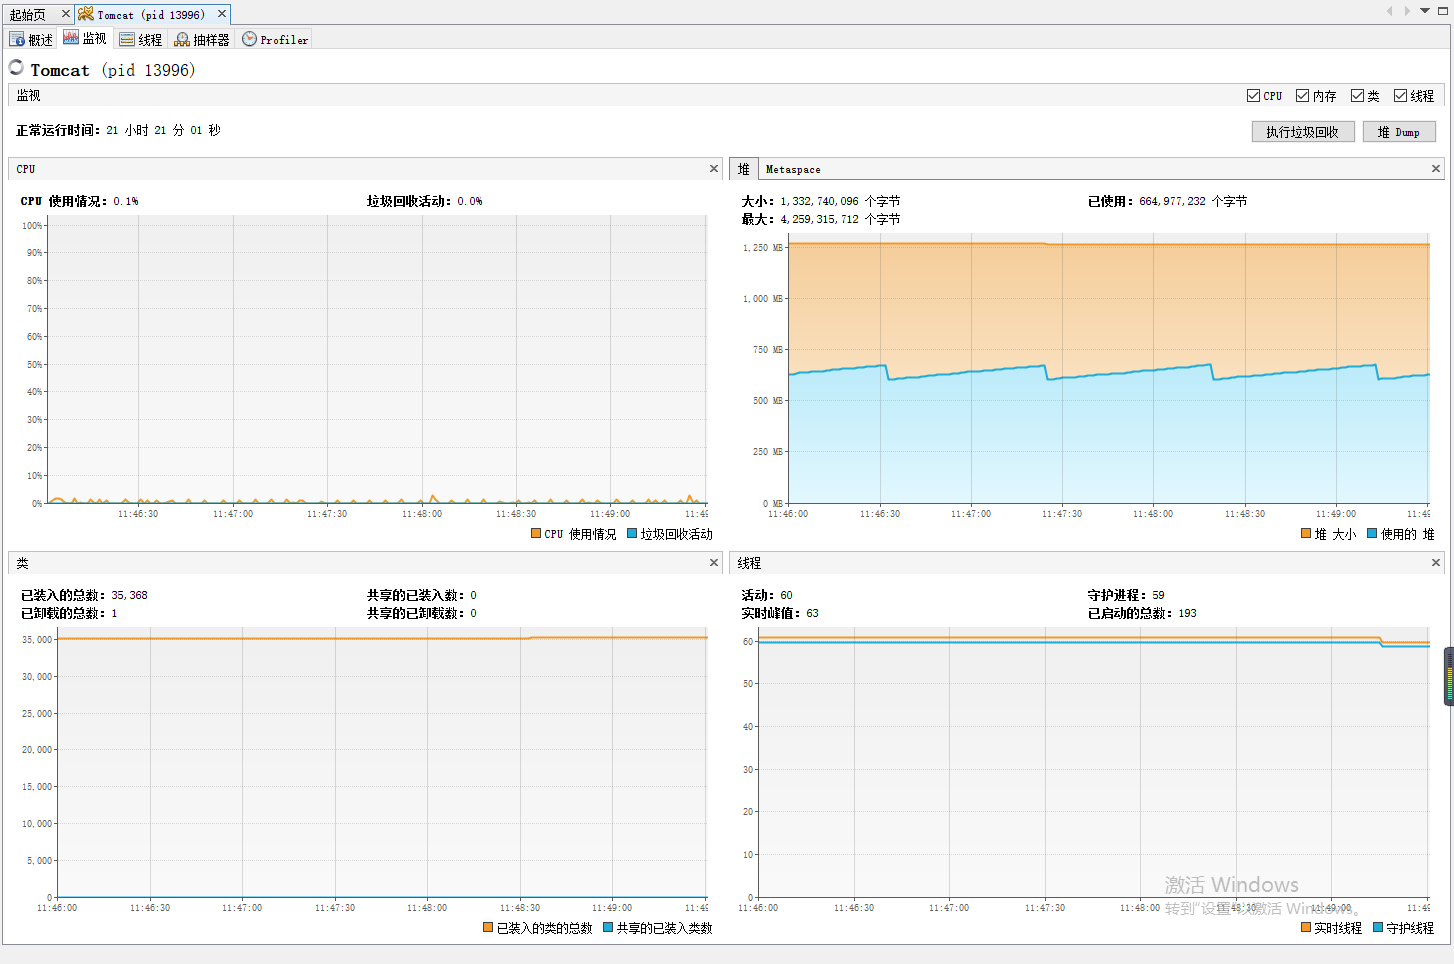
7.3. View CPU, memory, class and thread operation information

7.4. View Thread details
You can also click the Dump button in the upper right corner to export the thread information, which is actually the executed jstack command.
7.5 sampler
The sampler can sample the CPU and memory for analysis within a period of time.

7.6. Monitor the remote jvm
Visual jvm can monitor not only local jvm processes, but also remote jvm processes. It needs to be implemented with the help of JMX technology.
7. 6. 1. What is JMX?
MX (Java Management Extensions) is a framework for implanting management functions for applications, devices, systems, etc. JMX can span a series of heterogeneous operating system platforms, system architectures and network transmission protocols, and flexibly develop seamless integrated system, network and service management applications.
7. 6. 2. Monitoring remote tomcat
To monitor the remote tomcat, you need to configure JMX in the remote Tomcat as follows:
#In the bin directory of tomcat, modify Catalina SH, add the following parameters

JAVA_OPTS="‐Dcom.sun.management.jmxremote ‐
Dcom.sun.management.jmxremote.port= 9999  ‐
Dcom.sun.management.jmxremote.authenticate=false ‐
Dcom.sun.management.jmxremote.ssl=false"

#These parameters mean:
#‐Dcom.sun.management.jmxremote: allows remote management using JMX
#‐Dcom.sun.management.jmxremote.port= 9999: JMX remote connection port
#‐Dcom.sun.management.jmxremote.authenticate=false: any user can connect without identity authentication
#‐Dcom.sun.management.jmxremote.ssl=false: do not use ssl
Save, exit and restart tomcat.
7. 6. 2. Monitoring remote tomcat
Add remote host:
Connection succeeded. The usage method is the same as before. You can monitor the remote tomcat process the same as monitoring the local jvm process.