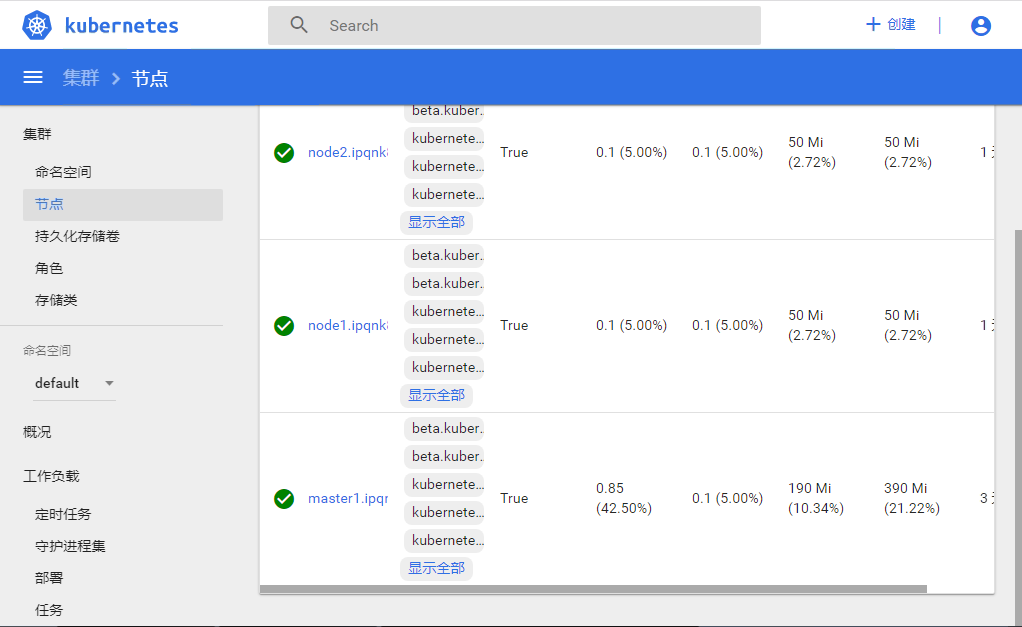
After successfully deploying k8s, I intend to redeploy the k8s web UI: dashboard.
The main deployment method on the web is some dashboard services generated by IT using yaml files.Then all the articles are a bit problematic, either because the steps are different, the content or file is out of date, or the author thinks that some content is understood by everyone and skips some steps, but I can't go on any further.
The first is the problem of pulling mirrors. The dashboard image is still not pulled down directly from the server of a well-known foreign search engine, so it is still solved by using the docker tag command to change the name after downloading from the mirror server.
The official mirror address is k8s.gcr.io/kubernetes-dashboard-amd64:v1.10.1
I found an address for the mirror: mirrorgooglecontainers (download command: docker pull mirrorgooglecontainers/kubernetes-dashboard-amd64:v1.10.1)
Next is renaming
docker tag mirrorgooglecontainers/kubernetes-dashboard-amd64:v1.10.1 k8s.gcr.io/kubernetes-dashboard-amd64:v1.10.1
docker rmi mirrorgooglecontainers/kubernetes-dashboard-amd64:v1.10.1
Then with the mirror, turn on dashboard's pod.There are also various versions of yaml files on the web, and the most reliable I've tried is the following.Name it kubernetes-dashboard.yaml.
kind: Service
apiVersion: v1
metadata:
  labels:
    k8s-app: kubernetes-dashboard
  name: kubernetes-dashboard
  namespace: kube-system
spec:
  type: NodePort
  ports:
    - port: 443
      targetPort: 8443
      nodePort: 30001
  selector:
    k8s-app: kubernetes-dashboard
Among them, 30001 can change itself to the port you want within the allowable range of k8s.This port is used on the physical machine, not the pod network.Clusters that are not k8s clusters can be accessed through this port (after all, browsers do.)I started without changing ports, but I didn't realize that port 30001 was occupied by other services, so the yaml file didn't work much after it was run.I've chosen a port 30012 here.
Use this file to install dashboard
kubectl create -f kubernetes-dashboard.yaml
The next step is to log in with a browser and first find out which node dashboard is running on.
kubectl get pods --all-namespaces -o wide | grep dashboard | awk '{print $8}'Then access the node in the browser.Web address to be addedHttps://<ip or domain name of the node>: <value of nodePort in previous yaml file> .The browser I use is chrome, which immediately displays the "Certificate is not trusted" page, and I cannot access it without the Continue option in the Advanced Options.Check the Internet for a solution to this problem because only firefox can add exceptions when the certificate expires (the certificate opened on Jan. 3, 0001, 2000 + years in its entirety).The real solution is to replace the certificate.The best ways to find them on the web are as follows.
mkdir key && cd key
openssl genrsa -out dashboard.key 2048

openssl req -new -out dashboard.csr -key dashboard.key -subj '/CN=172.19.0.48'

openssl x509 -req -in dashboard.csr -signkey dashboard.key -out dashboard.crt

kubectl delete secret kubernetes-dashboard-certs -n kube-system

kubectl create secret generic kubernetes-dashboard-certs --from-file=dashboard.key --from-file=dashboard.crt -n kube-system  #New Certificate

kubectl delete pod kubernetes-dashboard-746dfd476-b2r5f -n kube-system    #Restart Service
There are some places to change according to the actual situation, such as the IP address of the third sentence to be changed to a node node, and the deletion of the pod name in the last sentence to be changed.The command obtained is
kubectl get pods --all-namespaces -o wide | grep dashboard | awk '{print $2}'Then you can skip the certificate trustworthiness issue in your browser.The next question is the login interface, there are two ways to login, personal feel or token this convenient point.There are also experts on the web who summarize how to get the token command.
kubectl -n kube-system describe $(kubectl -n kube-system get secret -n kube-system -o name | grep namespace) | grep token
Copy the acquired token into the browser's interface and you can log in to dashboard.
