Machine learning experiment 6 report of Shandong University
Experimental hours: 4 experimental date: November 29, 2021
Experiment 6: k-means
Experimental purpose
In this exercise, you will use K-means to compress an image by reducing the
number of colors it contains
Use K-means to compress the image by reducing the number of colors
Experimental environment
software environment
Windows 10 + Matlab R2020a
CPU: Intel® Core™ i5-8300H CPU @ 2.30GHz 2.30 GHz
Experimental steps and contents
Understanding K-Means
K-Means (Lloyd 1957)
-
Update Class K of each point: by calculating each data point X i X_i Xi# to the center point of each category μ k \mu_k μ k , to select which category a point belongs to

-
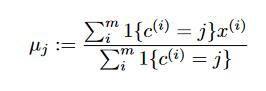
Update each cluster means: that is, calculate the mean according to the points of the current category to obtain the center point
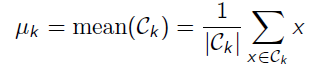
-
When μ k \mu_k μ When k ^ or Loss remains unchanged, the iteration is considered to be completed.
Loss:

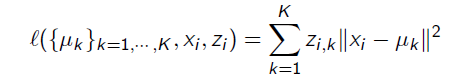
Loss Function
μ k \mu_k μ K is considered to be the centroid of the k-th cluster, z i , k z_{i,k} zi,k , think so x i x_i xi. Whether it belongs to C k C_k An indication of Ck , and then there will be one for each piece of data z i z_i zi, so define a data x i x_i xi l o s s loss loss is:
Overall L o s s F u n c t i o n : Loss Function: LossFunction: where X i s N × D X \, is \, N \times D\, XisN × D then Z i s N × K And μ i s K × D Z\, is \, N \times K and \ mu \, is \, K \times D ZisN × K and μ isK × D
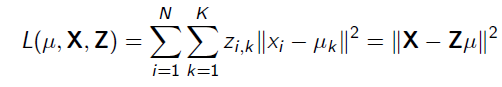
It means that X represents all D-dimensional data, and Z represents the cluster category indication of all N data, μ \mu μ Represents the D-dimensional center point of K clusters. K-Means is to minimize the Loss Function
K-Means Objective
K-Means is a heuristic method to solve this NP hard problem, and it is a non solve problem with many local minima
The algorithm is described as:

Choosing K
Choosing the number of clusters is also a problem.
-
You can draw a Loss diagram under different K values by trying different K values, and select elbow point.
-
AIC can also be used to solve the calculation
Task Description:
Your task is to compute 16 cluster centroids from this image, with each centroid being a vector of length three that holds a set of RGB values.
16 clusters are calculated, and each center point is one s i z e = 3 × 1 size = 3 \times 1 size=3 × RGB of 1 p i x e l pixel Pixel pixel v a l u e value Value represents the RGB value
In view of the calculation 538 × 538 × 3 538 \times 538 \times 3 five hundred and thirty-eight × five hundred and thirty-eight × The center point of the picture of 3 will take a lot of time, so start with the small picture ( 128 × 128 × 3 ) (128\times128\times3) (128 × one hundred and twenty-eight × 3) After training, apply it to the large picture to get a new picture represented by only 16 color s
Experimental steps :
K-Means Algorithm
-
Random initialization: randomly select 16 pixel s from the whole picture as the iterative center of initialization. The random number scheme I adopted can realize no repeated sampling.
function code:
%% Random selection of initial points return K * 3 function sample_Datas = sample_random(num,datas,dimx,dimy) % datas For raw data num Number of targets sample_Datas = zeros(num,3); a = rand(dimx,1); b = rand(dimy,1); [vala,posa] = sort(a); [valb,posb] = sort(b); chose_x = posa(1:num,1); chose_y = posb(1:num,1); for i=1:num sample_Datas(i,:) = datas(chose_x(i),chose_y(i),:); end end -
Calculate the nearest point of each pixel: traverse each pixel, and each pixel has one R G B v e c t o r RGB \, vector RGBvector and s i z e = 3 × 1 size = 3\times 1 size=3 × 1 then calculate the distance from all the center points, and select the K of the center point corresponding to the minimum distance as the class of the pixel

function code:
%% Calculate each pixel Category of return Clusters: N * N val For category function Clusters = calculate_Ci(centroids,dimx,dimy,datas,K) Clusters = []; % Traverse each pixel Calculate a z(i,j) for i= 1:dimy for j = 1:dimx % obtain xi pixel_rgb = [datas(i,j,1),datas(i,j,2),datas(i,j,3)]; diff = ones(K,1)*pixel_rgb - centroids; distance = sum(diff.^2,2); [~,class] = min(distance); % Get the smallest corresponding category index Clusters(i,j) = class; end end end -
Update center point μ \mu μ adopt
Function code:
%% Update center point return 16 * 3
function newcenters = updatemeans(Clusters,dimx,dimy,dimz,datas,K)
    newcenters = zeros(K,dimz);
    nums =  zeros(K);
    sumred = zeros(K,1);
    sumgreen = zeros(K,1);
    sumblue = zeros(K,1);
    for i=1:dimx
        for j=1:dimy
            class = Clusters(i,j);
            nums(class) = nums(class) + 1;
            sumred(class) = sumred(class) + datas(i,j,1);
            sumgreen(class) = sumgreen(class) + datas(i,j,2);
            sumblue(class) = sumblue(class) + datas(i,j,3);
        end
    end
    for i=1:K
        if nums(i) ~= 0
            sumred(i) = sumred(i) / nums(i);
            sumgreen(i) = sumgreen(i) / nums(i);
            sumblue(i) = sumblue(i) / nums(i);
        end
    end
    newcenters = [sumred,sumgreen,sumblue];
    newcenters = round(newcenters);
end
-
Judge Convergence:
I set the maximum number of convergence to 150 times, or according to the sum of squares before and after all center points are updated< 1 0 − 5 10^{-5} 10 − 5 is considered as unchanged and convergent.
Programming to achieve the above process, and finally get the corresponding image of each pixel** C l u s t e r s , s i z e = N × N Clusters,size = N \times N Clusters,size=N × N * * and RGB value of each center point: C e n t r o i d s , s i z e = K ∗ 3 Centroids,size = K*3 Centroids,size=K∗3
Reassigning Colors to The Large Image
Here, I deal with both small and large graphs respectively.
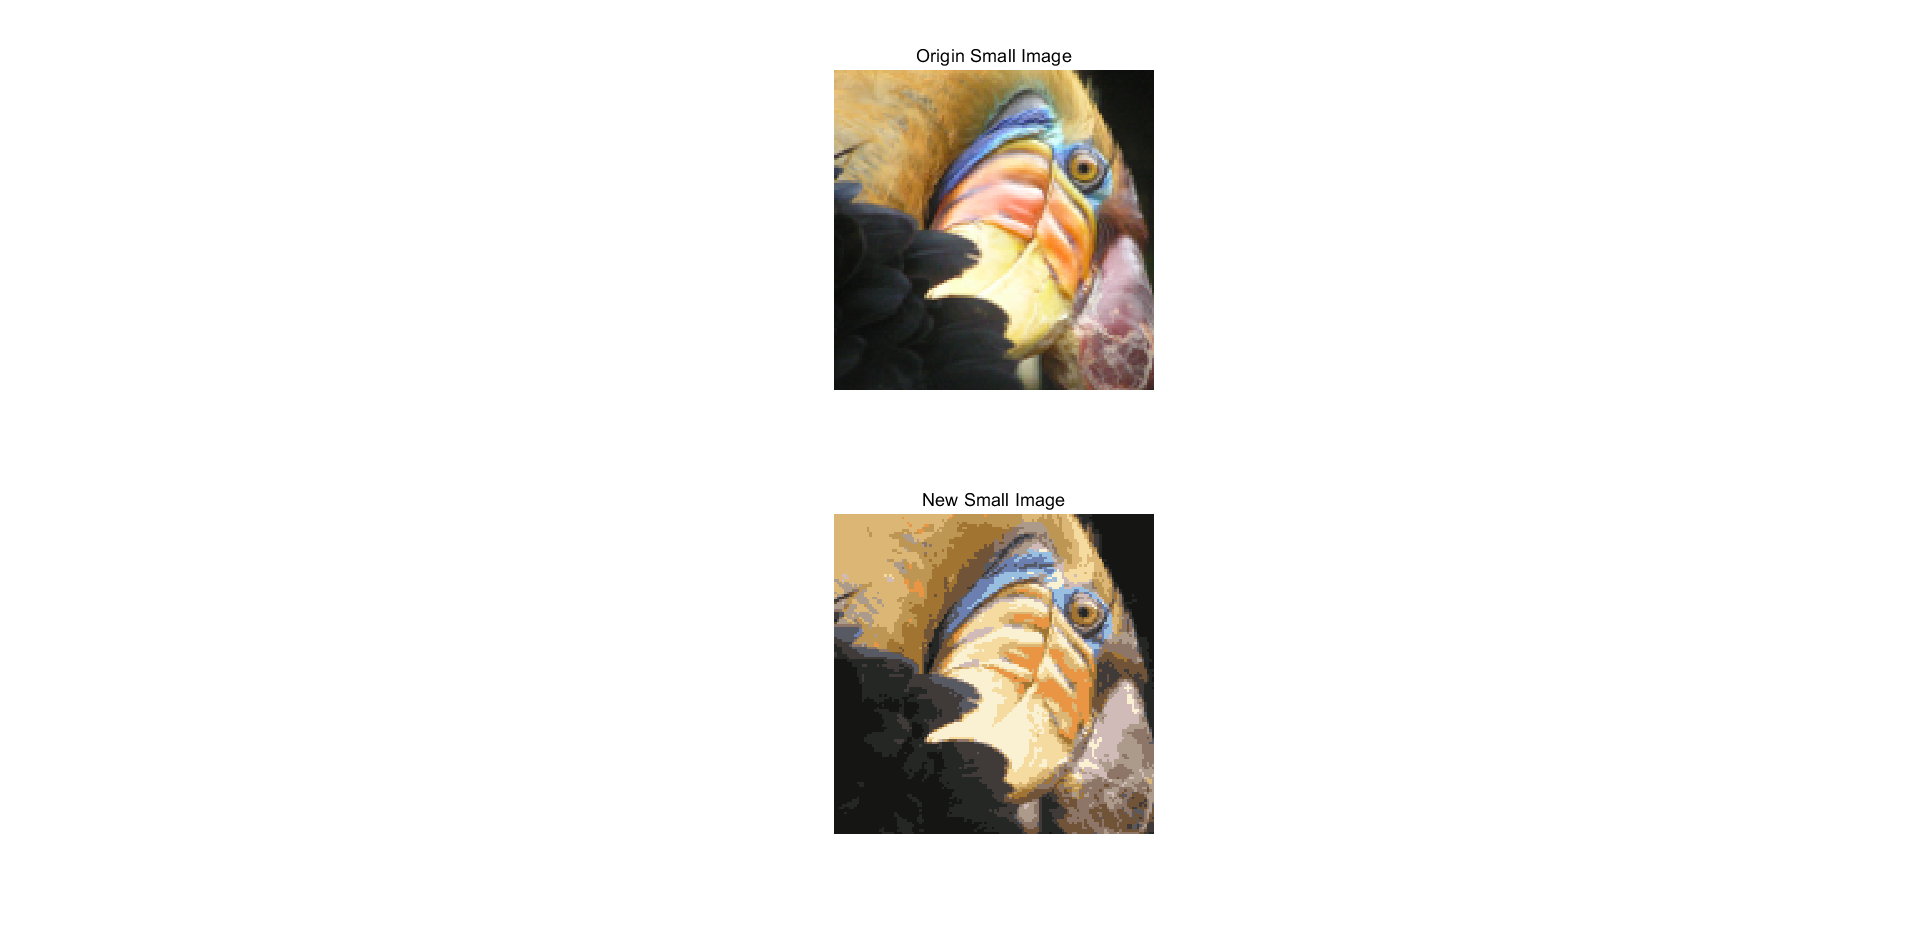
Small picture: convert each pixel to the RGB value of the corresponding class
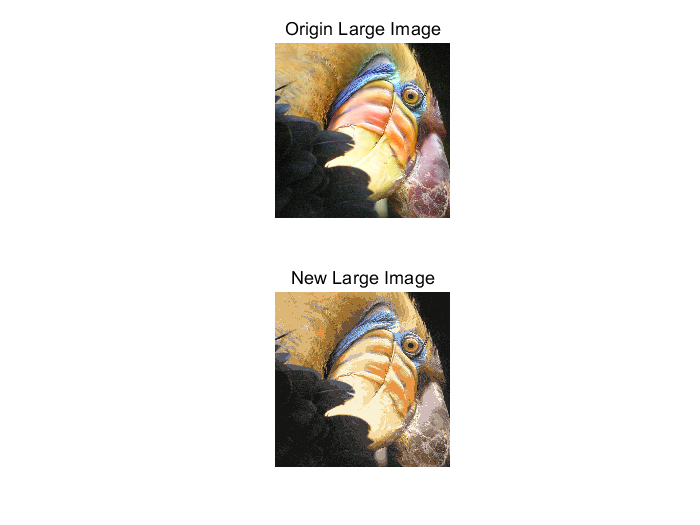
Large picture: first calculate the nearest point of each pixel and the trained center point, and then change the RGB value to get a new picture.
Effect of random initial value:
Small picture:
Large image: higher resolution
Choosing A Good Initial Point
Select a good initial point, so I cycle the above process and set the number of times. It is intended to choose a better initial point.
After the final picture is calculated each time, the RGB difference of pixel is solved one by one with the original picture, and then the square mean of RGB is calculated to calculate the loss, so as to obtain the picture with the lowest loss
As Best New Small / Large Image
The effects are as follows:
Small picture:

Large picture:
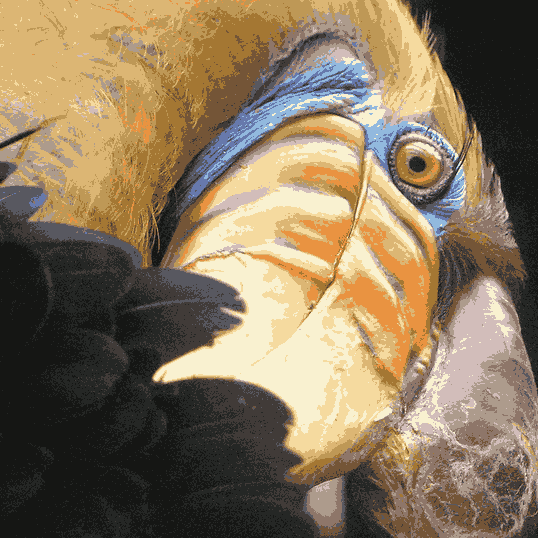
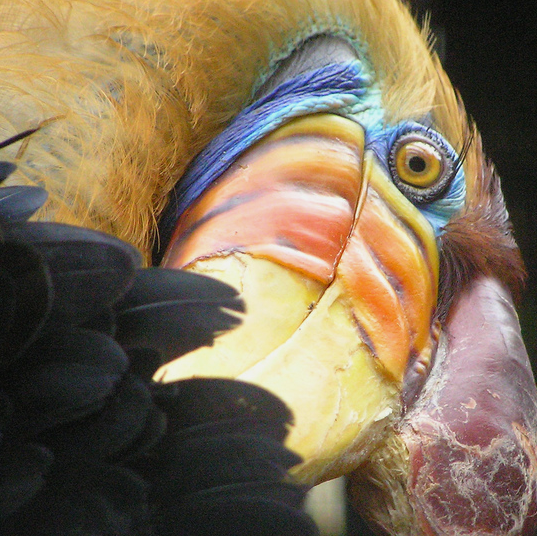
Compared with the original drawing, the effect is good:
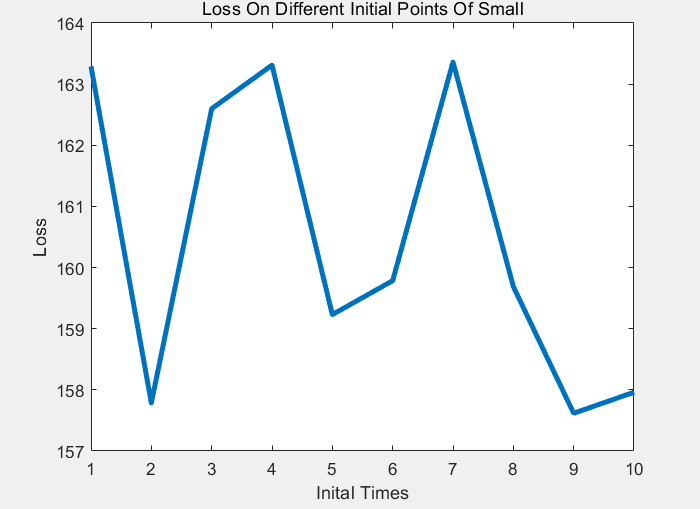
At the same time, record the relationship between the following Loss and different times of random initialization, and draw a chart:
It can be seen that the overall effect is related to the initial of the initial point, and there may be Local Mininum
Conclusion analysis and experience
K-Means overall algorithm architecture
Namely:
Fix the center point each time, and then update the category of each point
Or fix the category of each point and update the position information of the center point accordingly
Some Limitations Of K-Means
K-Means has application scope:
- It is applicable to each cluster with similar scale, and the effect will be good at this time
- The effect is good in round shaped
At the same time, it doesn't perform well in non convex shapes
Kernel K-Means
That is, high-dimensional mapping is carried out to solve the non convex problem. At the same time, it will not be explicitly projected, but with K K K
Hierarchical Clustering
Hierarchical clustering, bottom-up, top-down
Experimental source code
Lab61.m
clear,clc
%% K-means
% small_img : 128 * 128 * 3
% large_img : 538 * 538 * 3
small_img = imread('bird_small.tiff');
large_img = imread('bird_large.tiff');
% Convert to double matrix A(50,33,3) express y = 50 x =33 of Blue of val
small_img_matrix = double(small_img);
large_img_matrix = double(large_img);
%% show image
% imshow(large_img)
%%
K = 16; % 16 individual class
[small_dimx,small_dimy,small_dimz] = size(small_img_matrix);
[large_dimx,large_dimy,large_dimz] = size(large_img_matrix);
max_iter_times = 200;
convergence_condition = 10^-5;
[centroids,Clusters] = kmeans(K,small_img_matrix,max_iter_times,convergence_condition);
%% Redisplay small pictures
new_small_pic=[];
new_large_pic=[];
% Small picture processing
for i=1:small_dimx
    for j=1:small_dimy
        new_small_pic(i,j,:) =  centroids(Clusters(i,j),:);
    end
end

% Large picture processing
for i=1:large_dimy
    for j=1:large_dimy
        pixel_rgb = [large_img_matrix(i,j,1),large_img_matrix(i,j,2),large_img_matrix(i,j,3)];
        diff = ones(K,1)*pixel_rgb - centroids;
        distance = sum(diff.^2,2);
        [~,class] = min(distance); % Get category
        new_large_pic(i,j,:) =  centroids(class,:);
    end
end
%% Show small and large pictures
figure
subplot(2,1,1);
imshow(uint8(small_img_matrix)),title('Origin Small Image');
subplot(2,1,2);
imshow(uint8(new_small_pic)),title('New Small Image')
%%
figure
subplot(2,1,1);
imshow(uint8(large_img_matrix)),title('Origin Large Image');
subplot(2,1,2);
imshow(uint8(new_large_pic)),title('New Large Image')
%% K-Means Fuction Return ?
function [centroids,Clusters] = kmeans(K,datas,max_iter_times,convergence_condition)
    % Return to center point K * dimz
    centroids = [];
    [dimy,dimx,dimz] = size(datas);
    % Random initialization center point K*3
    centroids = sample_random(K,datas,dimx,dimy);
    for it = 1 : max_iter_times
        % calculation its nearest mean
        Clusters = calculate_Ci(centroids,dimx,dimy,datas,K);
        % Update center point
        new_centroids = updatemeans(Clusters,dimx,dimy,dimz,datas,K);
        % See if it converges
        convergence = judge(new_centroids,centroids,convergence_condition);
        centroids = new_centroids;
        if convergence
            break
        end
    end
end

%% Random selection of initial points return K * 3
function sample_Datas = sample_random(num,datas,dimx,dimy)
    % datas For raw data num Number of targets
    sample_Datas = zeros(num,3);
    a = rand(dimx,1);
    b = rand(dimy,1);
    [vala,posa] = sort(a);
    [valb,posb] = sort(b);
    chose_x = posa(1:num,1);
    chose_y = posb(1:num,1);
    for i=1:num
        sample_Datas(i,:) = datas(chose_x(i),chose_y(i),:);
    end

end

%% Calculate each pixel Category of return Clusters: N * N val For category
function Clusters = calculate_Ci(centroids,dimx,dimy,datas,K)
    Clusters = [];
    % Traverse each pixel Calculate a z(i,j)
    for i= 1:dimy
        for j = 1:dimx
            % obtain xi
            pixel_rgb = [datas(i,j,1),datas(i,j,2),datas(i,j,3)];
            diff = ones(K,1)*pixel_rgb - centroids;
            distance = sum(diff.^2,2);
            [~,class] = min(distance); % Get the smallest corresponding category index
            Clusters(i,j) = class;
        end
    end
end

%% Update center point return 16 * 3
function newcenters = updatemeans(Clusters,dimx,dimy,dimz,datas,K)
    newcenters = zeros(K,dimz);
    nums =  zeros(K);
    sumred = zeros(K,1);
    sumgreen = zeros(K,1);
    sumblue = zeros(K,1);
    for i=1:dimx
        for j=1:dimy
            class = Clusters(i,j);
            nums(class) = nums(class) + 1;
            sumred(class) = sumred(class) + datas(i,j,1);
            sumgreen(class) = sumgreen(class) + datas(i,j,2);
            sumblue(class) = sumblue(class) + datas(i,j,3);
        end
    end
    for i=1:K
        if nums(i) ~= 0
            sumred(i) = sumred(i) / nums(i);
            sumgreen(i) = sumgreen(i) / nums(i);
            sumblue(i) = sumblue(i) / nums(i);
        end
    end
    newcenters = [sumred,sumgreen,sumblue];
    newcenters = round(newcenters);
end

%% Judge whether convergence
function convergence = judge(newcenter,oldcenter,condition)
    convergence = 0;
     d = sum(sqrt(sum((newcenter - oldcenter).^2, 2)));
    if d < condition
        convergence = 1;
    end
end

%% Return row and column coordinates
function [row,col] = findrc(Clusters,val)
    [dimx,dimy] = size(Clusters);
    row = [];
    col = [];
    for i=1:dimx
        for j=1:dimy
            if Clusters(i,j) == val
                row = [row;i];
                col = [col;j];
            end
        end
    end
end
Lab62.m (select the best effect after multiple iterations)
clear,clc
%% More times, the purpose is to find the best one with different initial points.
%% K-means
% small_img : 128 * 128 * 3
% large_img : 538 * 538 * 3
small_img = imread('bird_small.tiff');
large_img = imread('bird_large.tiff');
% Convert to double matrix A(50,33,3) express y = 50 x =33 of Blue of val
small_img_matrix = double(small_img);
large_img_matrix = double(large_img);
Best_new_small_pic=[];
Best_new_large_pic=[];
%% show image
% imshow(large_img)
%%
inital_times = 10;
for inital_time = 1 : inital_times
    K = 16; % 16 individual class
    [small_dimx,small_dimy,small_dimz] = size(small_img_matrix);
    [large_dimx,large_dimy,large_dimz] = size(large_img_matrix);
    max_iter_times = 200;
    convergence_condition = 10^-5;
    [centroids,Clusters] = kmeans(K,small_img_matrix,max_iter_times,convergence_condition);
    %% Redisplay small pictures
    loss_small = 1e9;
    loss_large = 1e9;
    new_small_pic=[];
    new_large_pic=[];
    % Small picture processing
    for i=1:small_dimx
        for j=1:small_dimy
            new_small_pic(i,j,:) =  centroids(Clusters(i,j),:);
        end
    end
    new_loss_small = calculate_Kmeans_Loss(small_img_matrix,new_small_pic,small_dimx,small_dimy);
    if new_loss_small < loss_small
        loss_small = new_loss_small;
        Best_new_small_pic = new_small_pic;
    end

    % Large picture processing
    for i=1:large_dimy
        for j=1:large_dimx
            pixel_rgb = [large_img_matrix(i,j,1),large_img_matrix(i,j,2),large_img_matrix(i,j,3)];
            diff = ones(K,1)*pixel_rgb - centroids;
            distance = sum(diff.^2,2);
            [~,class] = min(distance); % Get category
            new_large_pic(i,j,:) =  centroids(class,:);
        end
    end

    new_loss_large = calculate_Kmeans_Loss(large_img_matrix,new_large_pic,large_dimy,large_dimx);
    if new_loss_large < loss_large
        loss_large = new_loss_large;
        Best_new_large_pic = new_large_pic;
    end
end
%% Show small and large pictures
figure
subplot(2,1,1);
imshow(uint8(small_img_matrix)),title('Origin Small Image');
subplot(2,1,2);
imshow(uint8(Best_new_small_pic)),title('Best New Small Image')
imwrite(uint8(Best_new_small_pic),'Best New Small Image.png')

figure
subplot(2,1,1);
imshow(uint8(large_img_matrix)),title('Origin Large Image');
subplot(2,1,2);
imshow(uint8(Best_new_large_pic)),title('Best New Large Image')
imwrite(uint8(Best_new_large_pic),'Best New Large Image.png')
%% K-Means Fuction Return ?
function [centroids,Clusters] = kmeans(K,datas,max_iter_times,convergence_condition)
    % Return to center point K * dimz
    centroids = [];
    [dimy,dimx,dimz] = size(datas);
    % Random initialization center point K*3
    centroids = sample_random(K,datas,dimx,dimy);
    for it = 1 : max_iter_times
        % calculation its nearest mean
        Clusters = calculate_Ci(centroids,dimx,dimy,datas,K);
        % Update center point
        new_centroids = updatemeans(Clusters,dimx,dimy,dimz,datas,K);
        % See if it converges
        convergence = judge(new_centroids,centroids,convergence_condition);
        centroids = new_centroids;
        if convergence
            break
        end
    end
end

%% Random selection of initial points return K * 3
function sample_Datas = sample_random(num,datas,dimx,dimy)
    % datas For raw data num Number of targets
    sample_Datas = zeros(num,3);
    a = rand(dimx,1);
    b = rand(dimy,1);
    [vala,posa] = sort(a);
    [valb,posb] = sort(b);
    chose_x = posa(1:num,1);
    chose_y = posb(1:num,1);
    for i=1:num
        sample_Datas(i,:) = datas(chose_x(i),chose_y(i),:);
    end

end

%% Calculate each pixel Category of return Clusters: N * N val For category
function Clusters = calculate_Ci(centroids,dimx,dimy,datas,K)
    Clusters = [];
    % Traverse each pixel Calculate a z(i,j)
    for i= 1:dimy
        for j = 1:dimx
            % obtain xi
            pixel_rgb = [datas(i,j,1),datas(i,j,2),datas(i,j,3)];
            diff = ones(K,1)*pixel_rgb - centroids;
            distance = sum(diff.^2,2);
            [~,class] = min(distance); % Get the smallest corresponding category index
            Clusters(i,j) = class;
        end
    end
end

%% Update center point return 16 * 3
function newcenters = updatemeans(Clusters,dimx,dimy,dimz,datas,K)
    newcenters = zeros(K,dimz);
    nums =  zeros(K);
    sumred = zeros(K,1);
    sumgreen = zeros(K,1);
    sumblue = zeros(K,1);
    for i=1:dimx
        for j=1:dimy
            class = Clusters(i,j);
            nums(class) = nums(class) + 1;
            sumred(class) = sumred(class) + datas(i,j,1);
            sumgreen(class) = sumgreen(class) + datas(i,j,2);
            sumblue(class) = sumblue(class) + datas(i,j,3);
        end
    end
    for i=1:K
        if nums(i) ~= 0
            sumred(i) = sumred(i) / nums(i);
            sumgreen(i) = sumgreen(i) / nums(i);
            sumblue(i) = sumblue(i) / nums(i);
        end
    end
    newcenters = [sumred,sumgreen,sumblue];
    newcenters = round(newcenters);
end

%% Judge whether convergence
function convergence = judge(newcenter,oldcenter,condition)
    convergence = 0;
     d = sum(sqrt(sum((newcenter - oldcenter).^2, 2)));
    if d < condition
        convergence = 1;
    end
end

%% calculation K-Means After the picture loss: Calculate all pixel of rgb sum then avg
function Loss1 = calculate_Kmeans_Loss(ori_img,new_img,dimx,dimy)
    Loss = zeros(3,1);
    div_num = dimx*dimy;
    for i=1:dimx
        for j = 1 :dimy
            Loss(1) = Loss(1) + (ori_img(i,j,1)-new_img(i,j,1)).^2 / div_num;
            Loss(2) = Loss(2) + (ori_img(i,j,2)-new_img(i,j,2)).^2 / div_num;
            Loss(3) = Loss(3) + (ori_img(i,j,3)-new_img(i,j,3)).^2 / div_num;
        end
    end
    Loss1 = sum(Loss) / 3;
end
n
    convergence = 1;
end
end
%%Calculate the loss of the picture after K-Means: calculate the rgb sum and avg of all pixel s
function Loss1 = calculate_Kmeans_Loss(ori_img,new_img,dimx,dimy)
Loss = zeros(3,1);
div_num = dimx*dimy;
for i=1:dimx
for j = 1 :dimy
Loss(1) = Loss(1) + (ori_img(i,j,1)-new_img(i,j,1)).^2 / div_num;
Loss(2) = Loss(2) + (ori_img(i,j,2)-new_img(i,j,2)).^2 / div_num;
Loss(3) = Loss(3) + (ori_img(i,j,3)-new_img(i,j,3)).^2 / div_num;
end
end
Loss1 = sum(Loss) / 3;
end