Preparation and understanding
Fluent bit is a plug-in, lightweight, multi platform and open source log collection tool written in C. It allows data to be collected from different sources and sent to multiple destinations. Fully compatible with docker and kubernetes ecological environment.
img
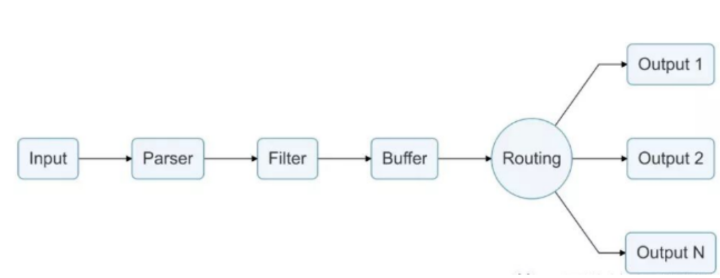
The above figure is a global overview of its workflow. It collects logs through input, transformation, filtering, buffering and routing to output.
By configuring the fluent bit input and output plug-ins, you can collect logs from different channels and output them to the target channel.
Fluent bit itself is written in C language, so it is difficult to extend plug-ins. The official provides the implementation. The official provides fluent bit go, which can write plug-ins in go language. At present, it only supports the writing of output.
To collect K8s container logs using fluent bit, you need to complete the following input configuration in the conf file of fluent bit (the location of container log file running in docker is configured here, and fluent will collect logs in the file and automatically complete simple filtering and cleaning operations):
[INPUT]
 Name              tail #The tail plug-in is used here, which has a similar behavior to the tail -f shell command. The following configuration items will vary depending on the plug-in selected here
 Tag               kube.*  #The tag of the read row
 Path              /var/log/containers/*.log #Specify the path to a specific log file or multiple log files by using generic wildcards.
 Parser            docker #Specifies the name of the parser
 DB                /var/log/flb_kube.db  #Specify a database file to track monitored files and offsets
 Mem_Buf_Limit     5MB    #Set the memory limit that the Tail plug-in can use.
 Skip_Long_Lines   On     #When the monitored file reaches the buffer capacity due to a long line, monitoring is stopped by default
 Refresh_Interval  10 //The interval, in seconds, between refreshing the list of monitored files
The output configuration is completed according to the output plug-in written by yourself (a ClickHouse plug-in is written):
[OUTPUT]
 Name            clickhouse #Plug in name
 Match           * #Matching range
At present, the official output plug-in of fluent bit does not support clickhouse, so it needs to be developed by itself.
Package the output plug-in as an OS package and combine fluent bit to form a docker image. Configure fluent bit to run as a container in k8s by mounting the configMap configuration file. Run a pod on each node node. Fluent bit collects logs through the log collection location configured in the configuration file, After processing, the configured output plug-in is used to store the data in ClickHouse.
According to the user's needs, the user can edit the output plug-in to connect the log to other databases or middleware for output (such as mysql, redis, etc.)
The following output plug-in code supporting clickhouse is attached:
Fluent bit will call the flbpluginregister (plug-in registration, identifying the plug-in name, which should correspond to OUTPUT.Name in fluent bit configuration), flbplugininit (plug-in initialization), flbpluginflush (plug-in output logic, which can simply process log data and complete output operation) and FLBPluginExit (plug-in exit) methods written by the user to complete the output of log data.
package main

import (
   "C"
   "database/sql"
   "fmt"
   "os"
   "strconv"
   "sync"
   "time"
   "unsafe"
   "github.com/fluent/fluent-bit-go/output"
   "github.com/kshvakov/clickhouse"
   klog "k8s.io/klog"
)

var (
   client *sql.DB

   database  string
   table     string
   batchSize int

   insertSQL = "INSERT INTO %s.%s(date, cluster, namespace, app, pod_name, container_name, host, log, ts) VALUES (?, ?, ?, ?, ?, ?, ?, ?, ?)"

   rw     sync.RWMutex
   buffer = make([]Log, 0)
)

const (
   DefaultWriteTimeout string = "20"
   DefaultReadTimeout  string = "10"

   DefaultBatchSize int = 1024
)

type Log struct {
   Cluster   string
   Namespace string
   App       string
   Pod       string
   Container string
   Host      string
   Log       string
   Ts        time.Time
}

//export FLBPluginRegister
func FLBPluginRegister(ctx unsafe.Pointer) int {
   return output.FLBPluginRegister(ctx, "clickhouse", "Clickhouse Output Plugin.!")
}

//export FLBPluginInit
// ctx (context) pointer to fluentbit context (state/ c code)
func FLBPluginInit(ctx unsafe.Pointer) int {

   var host string
   if v := os.Getenv("CLICKHOUSE_HOST"); v != "" {
      host = v
   } else {
      klog.Error("you must set host of clickhouse!")
      return output.FLB_ERROR
   }

   var user string
   if v := os.Getenv("CLICKHOUSE_USER"); v != "" {
      user = v
   } else {
      klog.Error("you must set user of clickhouse!")
      return output.FLB_ERROR
   }

   var password string
   if v := os.Getenv("CLICKHOUSE_PASSWORD"); v != "" {
      password = v
   } else {
      klog.Error("you must set password of clickhouse!")
      return output.FLB_ERROR
   }

   if v := os.Getenv("CLICKHOUSE_DATABASE"); v != "" {
      database = v
   } else {
      klog.Error("you must set database of clickhouse!")
      return output.FLB_ERROR
   }

   if v := os.Getenv("CLICKHOUSE_TABLE"); v != "" {
      table = v
   } else {
      klog.Error("you must set table of clickhouse!")
      return output.FLB_ERROR
   }

   if v := os.Getenv("CLICKHOUSE_BATCH_SIZE"); v != "" {
      size, err := strconv.Atoi(v)
      if err != nil {
         klog.Infof("you set the default bacth_size: %d", DefaultBatchSize)
         batchSize = DefaultBatchSize
      }
      batchSize = size
   } else {
      klog.Infof("you set the default bacth_size: %d", DefaultBatchSize)
      batchSize = DefaultBatchSize
   }

   var writeTimeout string
   if v := os.Getenv("CLICKHOUSE_WRITE_TIMEOUT"); v != "" {
      writeTimeout = v
   } else {
      klog.Infof("you set the default write_timeout: %s", DefaultWriteTimeout)
      writeTimeout = DefaultWriteTimeout
   }

   var readTimeout string
   if v := os.Getenv("CLICKHOUSE_READ_TIMEOUT"); v != "" {
      readTimeout = v
   } else {
      klog.Infof("you set the default read_timeout: %s", DefaultReadTimeout)
      readTimeout = DefaultReadTimeout
   }

   dsn := "tcp://" + host + "?username=" + user + "&password=" + password + "&database=" + database + "&write_timeout=" + writeTimeout + "&read_timeout=" + readTimeout

   db, err := sql.Open("clickhouse", dsn)
   if err != nil {
      klog.Error("connecting to clickhouse: %v", err)
      return output.FLB_ERROR
   }

   if err := db.Ping(); err != nil {
      if exception, ok := err.(*clickhouse.Exception); ok {
         klog.Errorf("[%d] %s \n%s\n", exception.Code, exception.Message, exception.StackTrace)
      } else {
         klog.Errorf("Failed to ping clickhouse: %v", err)
      }
      return output.FLB_ERROR
   }
   // ==
   client = db

   return output.FLB_OK
}

//export FLBPluginFlush
// FLBPluginFlush is called from fluent-bit when data need to be sent. is called from fluent-bit when data need to be sent.
func FLBPluginFlush(data unsafe.Pointer, length C.int, tag *C.char) int {
   rw.Lock()
   defer rw.Unlock()
   if err := client.Ping(); err != nil {
      if exception, ok := err.(*clickhouse.Exception); ok {
         klog.Errorf("[%d] %s \n%s\n", exception.Code, exception.Message, exception.StackTrace)
      } else {
         klog.Errorf("Failed to ping clickhouse: %v", err)
      }
      return output.FLB_ERROR
   }
   var ret int
   var timestampData interface{}
   var mapData map[interface{}]interface{}
   dec := output.NewDecoder(data, int(length))

   for {
      ret, timestampData, mapData = output.GetRecord(dec)
      if ret != 0 {
         break
      }
      var timestamp time.Time
      switch t := timestampData.(type) {
      case output.FLBTime:
         timestamp = timestampData.(output.FLBTime).Time
      case uint64:
         timestamp = time.Unix(int64(t), 0)
      default:
         timestamp = time.Now()
      }

      flattenData, err := Flatten(mapData, "", UnderscoreStyle)
      if err != nil {
         break
      }

      log := Log{}
      for k, v := range flattenData {
         value := ""
         switch t := v.(type) {
         case string:
            value = t
         case []byte:
            value = string(t)
         default:
            value = fmt.Sprintf("%v", v)
         }

         switch k {
         case "cluster":
            log.Cluster = value
         case "kubernetes_namespace_name":
            log.Namespace = value
         case "kubernetes_labels_app":
            log.App = value
         case "kubernetes_labels_k8s-app":
            log.App = value
         case "kubernetes_pod_name":
            log.Pod = value
         case "kubernetes_container_name":
            log.Container = value
         case "kubernetes_host":
            log.Host = value
         case "log":
            log.Log = value
         }

      }

      log.Ts = timestamp
      buffer = append(buffer, log)
   }

   // sink data
   if len(buffer) < batchSize {
      return output.FLB_OK
   }

   sql := fmt.Sprintf(insertSQL, database, table)

   tx, err := client.Begin()
   if err != nil {
      klog.Errorf("begin transaction failure: %s", err.Error())
      return output.FLB_ERROR
   }

   // build statements
   smt, err := tx.Prepare(sql)
   if err != nil {
      klog.Errorf("prepare statement failure: %s", err.Error())
      return output.FLB_ERROR
   }
   for _, l := range buffer {
      _, err = smt.Exec(l.Ts, l.Cluster, l.Namespace, l.App, l.Pod, l.Container, l.Host,
         l.Log, l.Ts)

      if err != nil {
         klog.Errorf("statement exec failure: %s", err.Error())
         return output.FLB_ERROR
      }
   }

   // commit and record metrics
   if err = tx.Commit(); err != nil {
      klog.Errorf("commit failed failure: %s", err.Error())
      return output.FLB_ERROR
   }

   buffer = make([]Log, 0)

   return output.FLB_OK
}

//export FLBPluginExit
func FLBPluginExit() int {
   return output.FLB_OK
}

func main() {
}
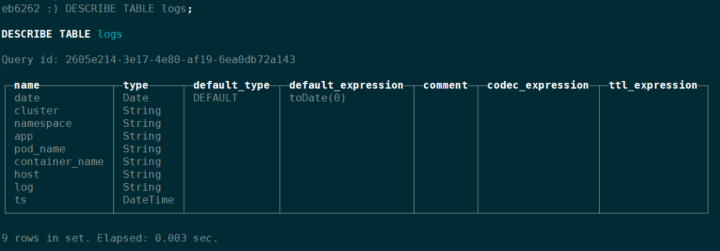
Data structure of ClickHouse
Create table sql
The table structure here can be modified as needed. The specific warehousing operations are developed in the output plug-in.
CREATE DATABASE IF NOT EXISTS scmp;
CREATE TABLE IF NOT EXISTS scmp.logs(
    date Date DEFAULT toDate(0),
    cluster String,namespace String,
    app String,
    pod_name String,
    container_name String,
    host String,log String,
    ts DateTime)
ENGINE = MergeTree() PARTITION BY toYYYYMMDD(date)
ORDER BY (cluster, namespace, app, pod_name, container_name, host,ts);
Table structure
img
Deploy corresponding K8s resources
Mounted profile:
apiVersion: v1
kind: ConfigMap
metadata:
  name: k8s-log-agent-config
  namespace: kube
  labels:
    k8s-app: k8s-log-agent
data:
  # Configuration files: server, input, filters and output
  # ======================================================
  fluent-bit.conf: |
    [SERVICE]
     Flush         1
     Log_Level     error
     Daemon        off
     Parsers_File  parsers.conf
     HTTP_Server   On
     HTTP_Listen   0.0.0.0
     HTTP_Port     2020

    @INCLUDE input-kubernetes.conf
    @INCLUDE filter-kubernetes.conf
    @INCLUDE output-kubernetes.conf

  input-kubernetes.conf: |
    [INPUT]
        Name              tail
        Tag               kube.*
        Path              /var/log/containers/*.log
        Parser            docker
        DB                /var/log/flb_kube.db
        Mem_Buf_Limit     5MB
        Skip_Long_Lines   On
        Refresh_Interval  10

  filter-kubernetes.conf: |
    [FILTER]
     Name                kubernetes
     Match               *
     Kube_URL            https://kubernetes.default.svc.cluster.local:443
     Merge_Log           On
     Annotations         Off
     Kube_Tag_Prefix     kube.var.log.containers.
     Merge_Log_Key       log_processed

    [FILTER]
     Name                modify
     Match               *
     Set  cluster  ${CLUSTER_NAME}
  output-kubernetes.conf: |
    [OUTPUT]
     Name            clickhouse
     Match           *
  parsers.conf: |
    [PARSER]
     Name   apache
     Format regex
     Regex  ^(?<host>[^ ]*) [^ ]* (?<user>[^ ]*) \[(?<time>[^\]]*)\] "(?<method>\S+)(?: +(?<path>[^\"]*?)(?: +\S*)?)?" (?<code>[^ ]*) (?<size>[^ ]*)(?: "(?<referer>[^\"]*)" "(?<agent>[^\"]*)")?$
     Time_Key time
     Time_Format %d/%b/%Y:%H:%M:%S %z

    [PARSER]
     Name   apache2
     Format regex
     Regex  ^(?<host>[^ ]*) [^ ]* (?<user>[^ ]*) \[(?<time>[^\]]*)\] "(?<method>\S+)(?: +(?<path>[^ ]*) +\S*)?" (?<code>[^ ]*) (?<size>[^ ]*)(?: "(?<referer>[^\"]*)" "(?<agent>[^\"]*)")?$
     Time_Key time
     Time_Format %d/%b/%Y:%H:%M:%S %z

    [PARSER]
     Name   apache_error
     Format regex
     Regex  ^\[[^ ]* (?<time>[^\]]*)\] \[(?<level>[^\]]*)\](?: \[pid (?<pid>[^\]]*)\])?( \[client (?<client>[^\]]*)\])? (?<message>.*)$

    [PARSER]
     Name   nginx
     Format regex
     Regex ^(?<remote>[^ ]*) (?<host>[^ ]*) (?<user>[^ ]*) \[(?<time>[^\]]*)\] "(?<method>\S+)(?: +(?<path>[^\"]*?)(?: +\S*)?)?" (?<code>[^ ]*) (?<size>[^ ]*)(?: "(?<referer>[^\"]*)" "(?<agent>[^\"]*)")?$
     Time_Key time
     Time_Format %d/%b/%Y:%H:%M:%S %z

    [PARSER]
     Name   json
     Format json
     Time_Key time
     Time_Format %d/%b/%Y:%H:%M:%S %z

    [PARSER]
     Name         docker
     Format       json
     Time_Key     time
     Time_Format  %Y-%m-%dT%H:%M:%S.%L
     Time_Keep    On

    [PARSER]
     Name        syslog
     Format      regex
     Regex       ^\<(?<pri>[0-9]+)\>(?<time>[^ ]* {1,2}[^ ]* [^ ]*) (?<host>[^ ]*) (?<ident>[a-zA-Z0-9_\/\.\-]*)(?:\[(?<pid>[0-9]+)\])?(?:[^\:]*\:)? *(?<message>.*)$
     Time_Key    time
     Time_Format %b %d %H:%M:%S
Resource permission control:
apiVersion: rbac.authorization.k8s.io/v1
kind: ClusterRoleBinding
metadata:
    name: k8s-log-agent-read
roleRef:
  apiGroup: rbac.authorization.k8s.io
  kind: ClusterRole
  name: k8s-log-agent-read
subjects:
  - kind: ServiceAccount
    name: k8s-log-agent
    namespace: kube-system

---

apiVersion: rbac.authorization.k8s.io/v1
kind: ClusterRole
metadata:
  name: k8s-log-agent-read
rules:
  - apiGroups: [""]
    resources:
      - namespaces
      - pods
    verbs: ["get", "list", "watch"]

---


apiVersion: v1
kind: ServiceAccount
metadata:
  name:k8s-log-agent
  namespace: kube
Start the container on each node:
apiVersion: apps/v1
kind: DaemonSet
metadata:
  name: k8s-log-agent
  namespace: kube
  labels:
    k8s-app: k8s-log-agent
    version: v1
    kubernetes.io/cluster-service: "true"
spec:
  selector:
    matchLabels:
      k8s-app: k8s-log-agent
  template:
    metadata:
      labels:
        k8s-app: k8s-log-agent
        version: v1
        kubernetes.io/cluster-service: "true"
      annotations:
        prometheus.io/scrape: "true"
        prometheus.io/port: "2020"
        prometheus.io/path: /api/v1/metrics/prometheus
    spec:
      containers:
        - name: fluent-bit
          image: iyacontrol/fluent-bit-ck:1.2.2
          imagePullPolicy: Always
          ports:
            - containerPort: 2020
          resources:
            limits:
              cpu: 200m
              memory: 200Mi
            requests:
              cpu: 200m
              memory: 200Mi
          env:
            - name: CLUSTER_NAME
              value: "clickhouse"
            - name: CLICKHOUSE_HOST
              value: "10.1.62.62:9150"
            - name: CLICKHOUSE_USER
              value: "oms"
            - name: CLICKHOUSE_PASSWORD
              value: "EBupt123"
            - name: CLICKHOUSE_DATABASE
              value: "scmp"
            - name: CLICKHOUSE_TABLE
              value: "logs"
            - name: NODENAME
              valueFrom:
                fieldRef:
                  fieldPath: spec.nodeName
          volumeMounts:
            - name: varlog
              mountPath: /var/log
            - name: varlibdockercontainers
              mountPath: /var/lib/docker/containers
              readOnly: true
            - name: k8s-log-agent-config
              mountPath: /fluent-bit/etc/
      terminationGracePeriodSeconds: 10
      volumes:
      - name: varlog
        hostPath:
          path: /var/log
      - name: varlibdockercontainers
        hostPath:
          path: /var/lib/docker/containers
      - name: k8s-log-agent-config
        configMap:
          name: k8s-log-agent-config
      serviceAccountName: k8s-log-agent
      tolerations:
      - key: node-role.kubernetes.io/master
        operator: Exists
        effect: NoSchedule
Database storage results
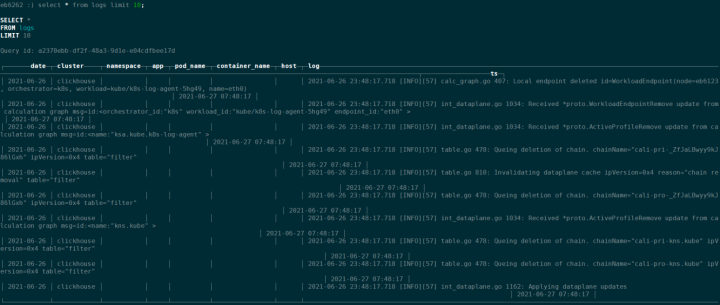
img
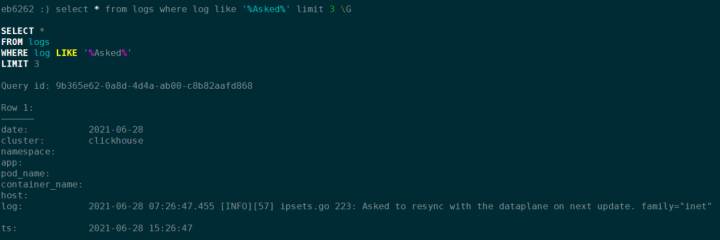
img
fluent simple performance test
Test preparation
FLB input plug-in configuration:
Name              Tail  #Using tail mode
Buffer_Chunk_Size 32k   #Set the initial buffer size to read file data. The default is 32
Buffer_Max_Siz    32k   #Set the buffer size limit for each monitored file. The default is 32
Mem_Buf_Limit     5MB   #Set the memory limit that the Tail plug-in can use when attaching data to the engine. If the limit is reached, suspend; When the data is refreshed, it is restored. No default
Skip_Long_Lines   On    #When the length of a log line exceeds buffer_ Max_ When size is set to no, stop monitoring the file. Set to on to skip long lines and continue processing other lines suitable for the buffer size. The default off is to stop monitoring the file
Refresh_Interval  10    #The time interval for getting the log again is 60 by default
Read_from_Head    False #For newly discovered files at the beginning (without database offset / location), read the contents from the head of the file instead of the tail. The default is False
Rotate_Wait       5      #Specifies the extra time to monitor the file once when some pending data is refreshed. The default is 5
DB                /var/log/flb_kube.db  #Specify a database file to record monitored files and offsets
DB.sync           normal    #Set the default synchronization (I/O) method to normal
DB.locking        false     #The specified database can only be accessed by Fluent Bit. The default is false
DB.journal_mode   WAL       #Set the log mode of the database to default wal
exit_on_eof       false     #When reading a file, it exits the default false immediately when it reaches the end of the file
FLB filter configuration:
Name                kubernetes #Using tail mode
Match               * #Matching rules
Kube_URL            https://kubernetes.default.svc.cluster.local:443 #k8s API server endpoint
Merge_Log           On   #When enabled, it checks whether the content of the log field is a JSON string mapping, and if so, attaches the mapping field as part of the log structure.
Annotations         On   #Include the Kubernetes resource annotation in the additional metadata. The default is on
Kube_Tag_Prefix     kube.var.log.containers. #When the source record is from the Tail input plug-in, this option specifies the prefix used in the Tail configuration
Merge_Log_Key       log_processed #Enable merge_ After log, the filter will try to assume that the log field in the incoming message is a JSON string message, and structurally represent it at the same level of the log field in the mapping. After setting the key, all new structured fields extracted from the original log content will be inserted under the new key
No upper limit is set for cpu and mem of FLB operating environment
Test start
Record the change range of cpu and memory within 10 minutes under FLB no-load, log printing frequency of 5000 pieces / s, 1000 pieces / s, 500 pieces / s, 200 pieces / s, 50 pieces / s and 1 piece / s, the time from the beginning of log recording to the beginning of retention under various conditions, and the number of log retention in a period of time after retention.
The test is performed directly using the htop command
The number of detained entries after 3 minutes is not recorded within the number of logs generated in 10 seconds
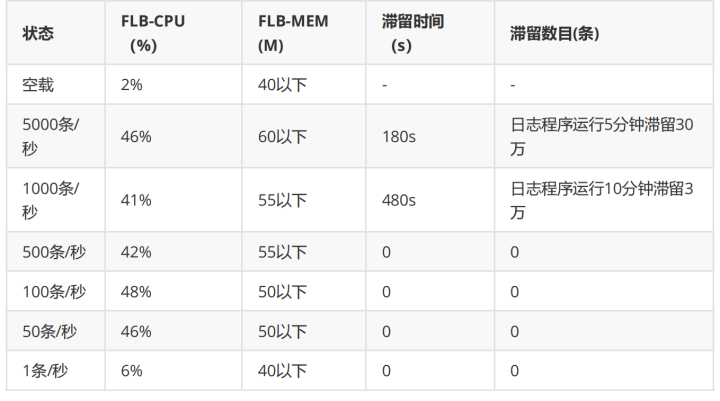
img
An interesting point found in the test is that when the log printing frequency is in the range of 1000 / s and 500 / s, the fluctuation of cpu is relatively stable, not more than 10%. However, in other conditions, in the states of 5000 / s and 100 / s and 50 / s, the fluctuation range of cpu is very large, the highest value can reach 52 and the lowest value can reach 35, This special value occurs more times than 1000 and 500 per second.
In combination with the previous tests, the stability interval of cpu at 1000 bars / S is lower than that at 500 bars / s.