1, Understanding of multi Maser cluster architecture
As a container cluster system, Kubernetes realizes the self-healing ability of Pod fault through the health check + restart strategy. It realizes the distributed deployment of Pod through the scheduling algorithm, maintains the expected number of copies, and automatically pulls up Pod in other nodes according to the Node failure status, realizing the high availability of the application layer.
For Kubernetes cluster, high availability should also include the following two aspects: high availability of Etcd database and high availability of Kubernetes Master component. For Etcd, we have used three nodes to form a cluster to achieve high availability. This blog will explain and implement the high availability of the Master node.
The Master node acts as the Master control center and maintains the healthy working state of the whole cluster by continuously communicating with Kubelet on the work node. If the Master node fails, you will not be able to use kubectl tools or API s for any cluster management.
The Master node mainly has three services: Kube apiserver, Kube controller mansger and Kube scheduler. The Kube controller mansger and Kube scheduler components have achieved high availability through the selection mechanism. Therefore, the Master high availability is mainly for the Kube apiserver component, which provides services through HTTP API. Therefore, the high availability is similar to that of Web server, Add a load balancer to balance the load, and the capacity can be expanded horizontally.
2, master2 node deployment
Follow the above experiment: see blog Kubernetes binary deployment single node
Environmental preparation:
| node | IP address | install |
| master01 | 192.168.229.90 | kube-apiserver,kube-controller-manager,kube-scheduler,etcd |
| node1 | 192.168.229.80 | kubelet,kube-proxy,docker etcd |
| node1 | 192.168.229.70 | kubelet,kube-proxy,docker etcd |
| master02 | 192.168.229.60 | kube-apiserver,kube-controller-manager,kube-scheduler,etcd |
| lb01 | 192.168.229.50 | Nginx L4 ,keepalived |
| lb02 | 192.168.229.40 | Nginx L4 ,keepalived |
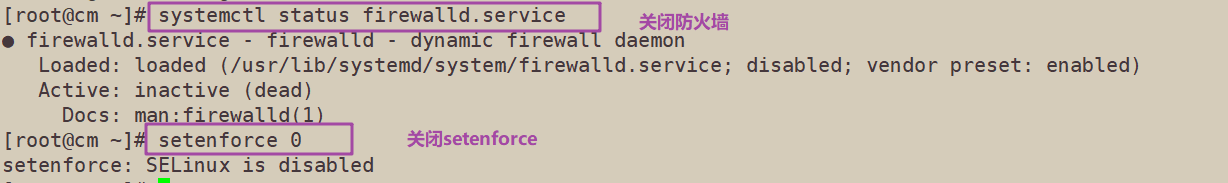
Turn off firewall
systemctl stop firewalld
systemctl disable firewalld
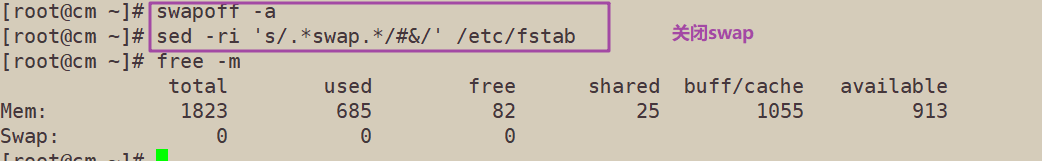
Close swap
swapoff -a
sed -ri 's/.*swap.*/#&/' /etc/fstab
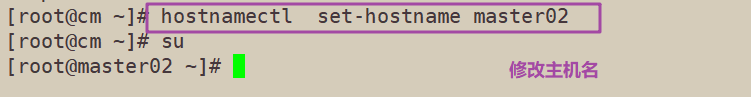
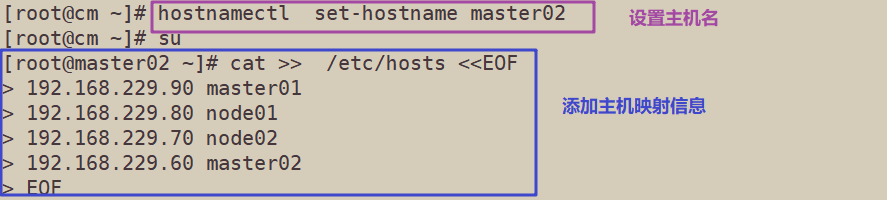
Set the host name according to the plan
hostnamectl set-hostname master02
Add hosts to the master Node and each Node
cat >>  /etc/hosts <<EOF
192.168.229.90 master01
192.168.229.80 node01
192.168.229.70 node02
192.168.229.60 master02
EOF

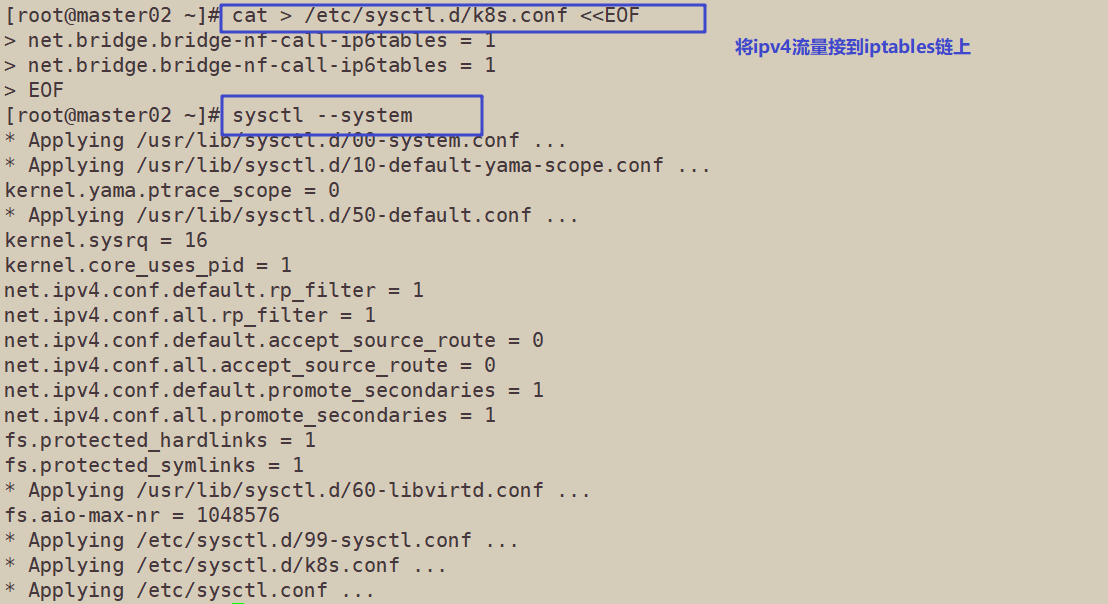
The chain that passes bridged IPv4 traffic to iptables
cat > /etc/sysctl.d/k8s.conf <<EOF
net.bridge.bridge-nf-call-ip6tables = 1
net.bridge.bridge-nf-call-ip6tables = 1
EOF
sysctl --system
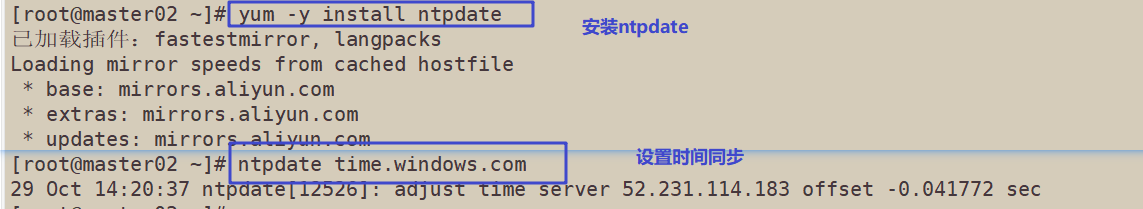
time synchronization
yum -y install ntpdate
ntpdate time.windows.com
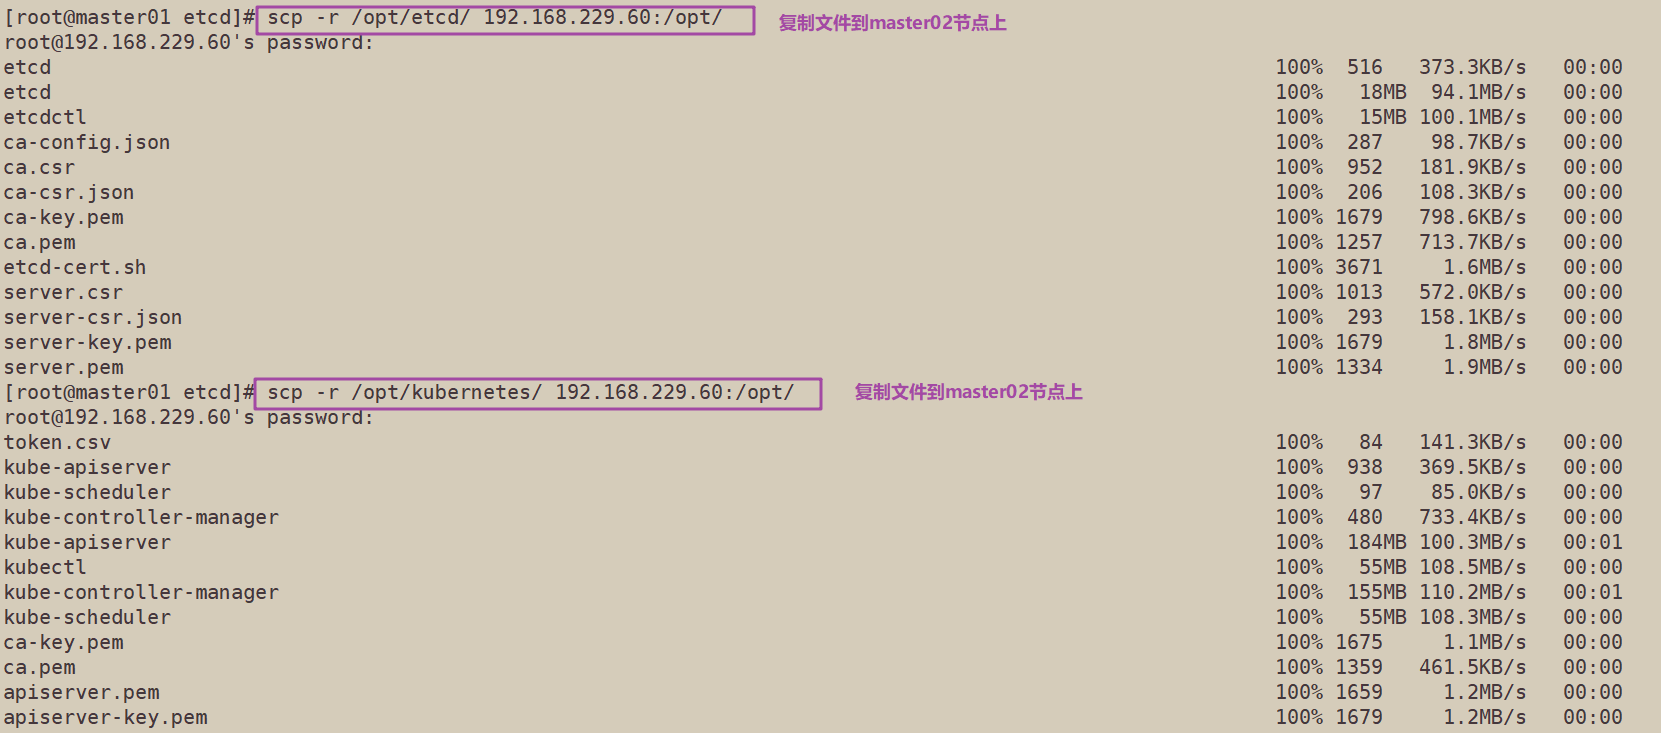
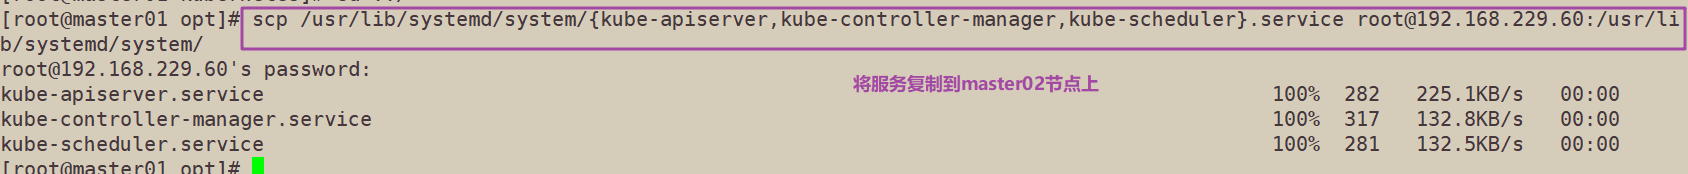
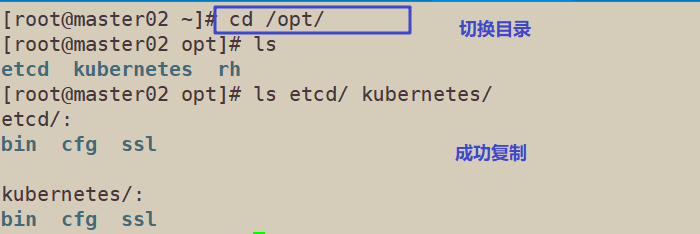
1. Copy the certificate file, configuration file and service management file of each master component from the master 01 node to the master 02 node
scp -r /opt/etcd/ root@192.168.229.60:/opt/
scp -r /opt/kubernetes/ root@192.168.229.60:/opt,
scp /usr/lib/systemd/system/{kube-apiserver,kube-controller-manager,kube-scheduler}.service root@192.168.229.60:/usr/lib/systemd/system/
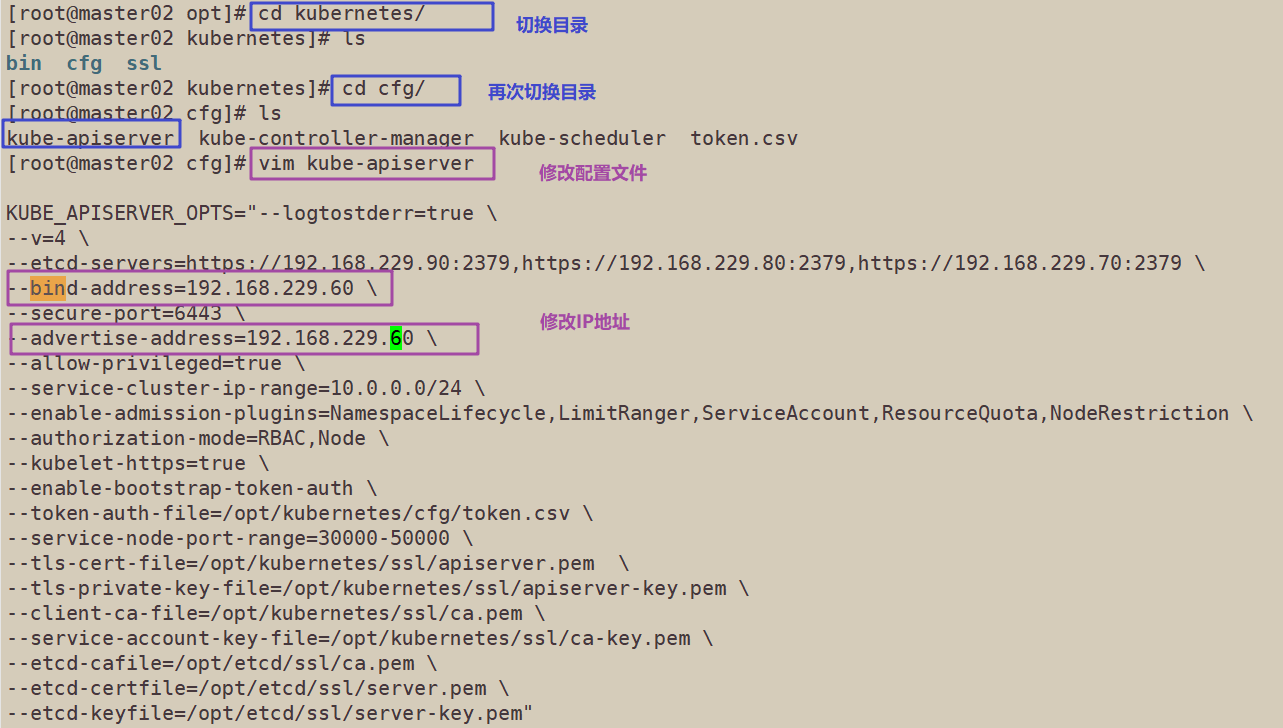
2. Modify the IP address in the configuration file Kube apiserver
vim /opt/kubernetes/cfg/kube-apiserver
KUBE_APISERVER_OPTS="--logtostderr=true \
--v=4 \
--etcd-servers=https://192.168.229.90:2379,https://192.168.229.80:2379,https://192.168.229.70:2379 \
--bind-address=192.168.229.60 \	#modify
--secure-port=6443 \
--advertise-address=192.168.229.60 \	#modify
......
3. Start the services on the master02 node and set the startup and self startup
systemctl daemon-reload
systemctl enable --now kube-apiserver.service kube-controller-manager.service kube-scheduler.service

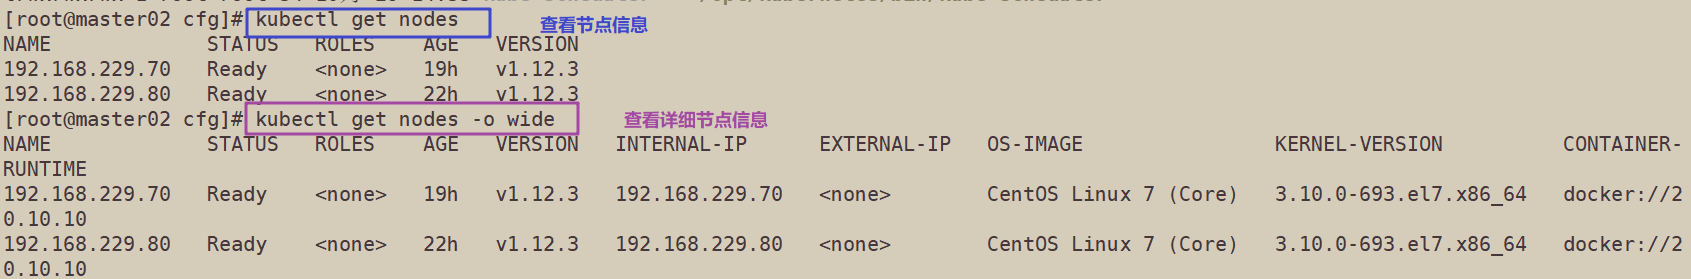
4. View node status
ln -s /opt/kubernetes/bin/* /usr/local/bin/
kubectl get nodes
kubectl get nodes -o wide	#-o=wide: output additional information; For Pod, the Node name where the Pod is located will be output
At this time, the node node status found in the master 02 node is only the information found from the etcd. At this time, the node node does not actually establish a communication connection with the master 02 node. Therefore, a VIP needs to be used to associate the node node with the master node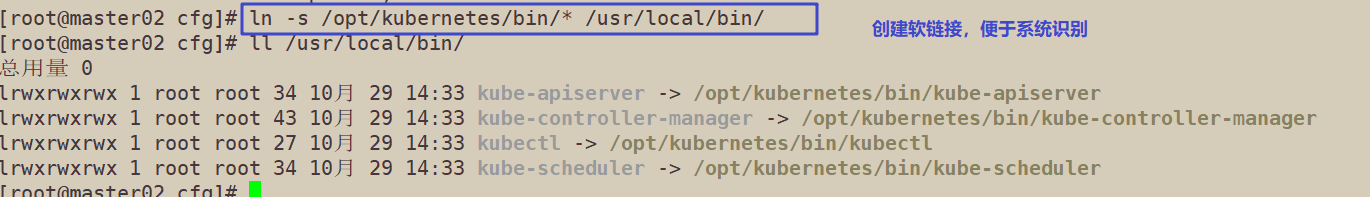
3, Load balancing deployment
Configure load balancer cluster dual machine hot standby load balancing (nginx realizes load balancing and keepalived realizes dual machine hot standby)
#####Operate on nodes lb01 and lb02#####
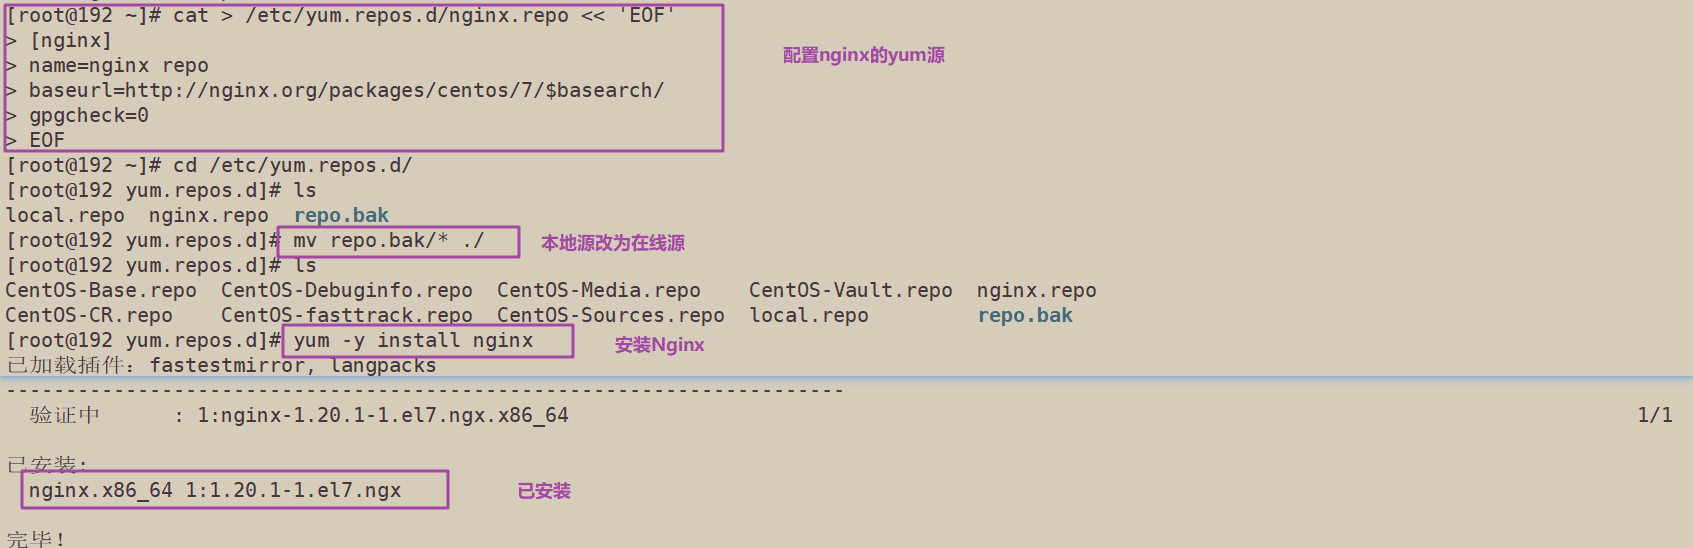
1. Configure the official online Yum source of nginx and the yum source of local nginx
cat > /etc/yum.repos.d/nginx.repo << 'EOF'
[nginx]
name=nginx repo
baseurl=http://nginx.org/packages/centos/7/$basearch/
gpgcheck=0
EOF

yum install nginx -y
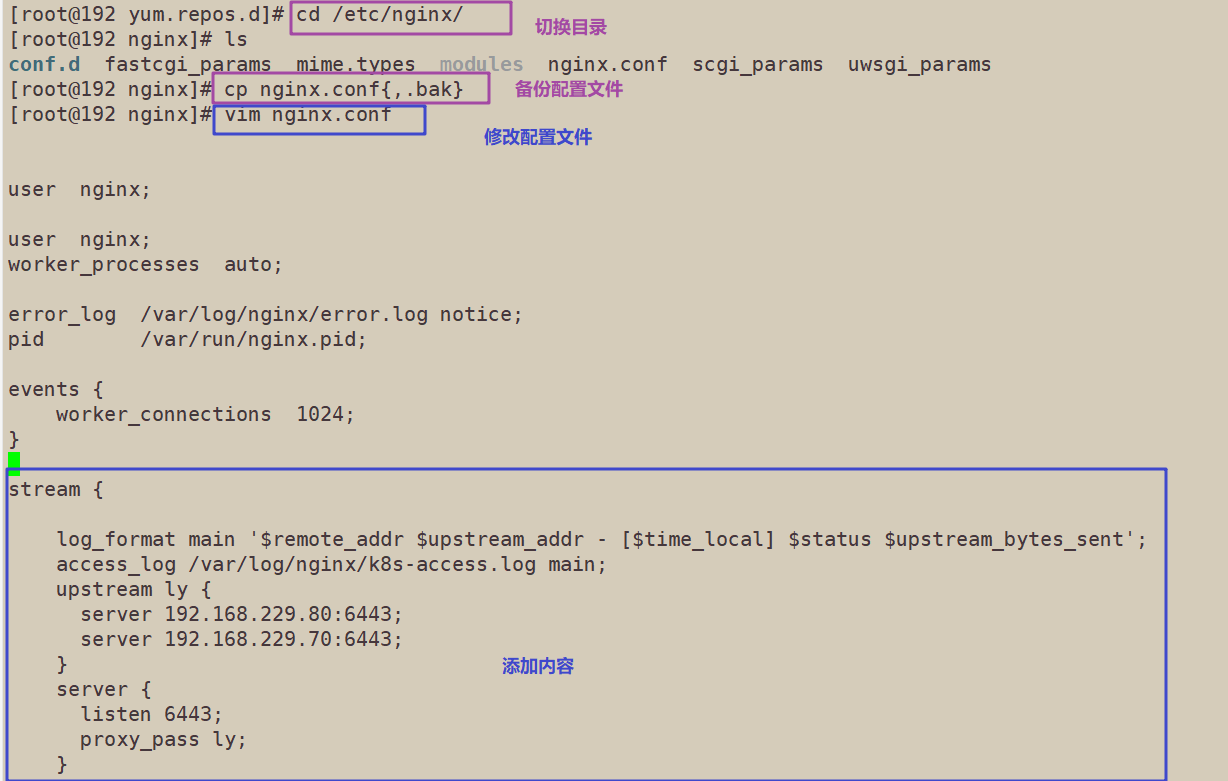
2. Modify the nginx configuration file, configure the four layer reverse proxy load balancing, and specify the node ip and 6443 port of the two master servers in the k8s cluster
vim /etc/nginx/nginx.conf
events {
worker_connections 1024;
}

#add to
stream {
log_format main '$remote_addr $upstream_addr - [$time_local] $status $upstream_bytes_sent';

access_log /var/log/nginx/k8s-access.log main;

upstream k8s-apiserver {
server 192.168.229.90:6443;
server 192.168.229.60:6443;
}
server {
listen 6443;
proxy_pass k8s-apiserver;
}
}

http {
......
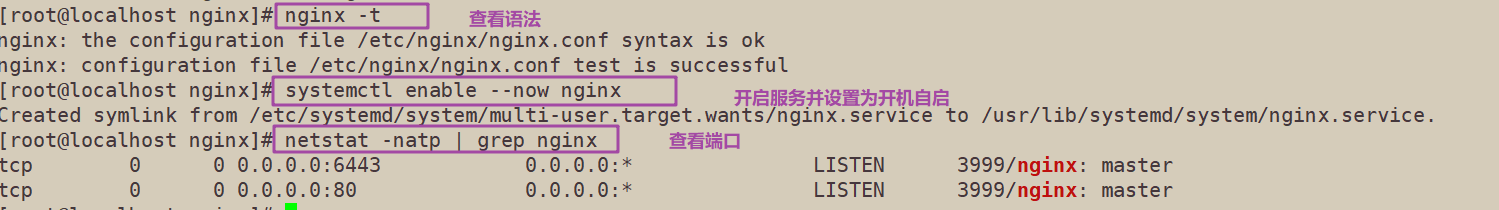
3. Check configuration file syntax
nginx -t

4. Start nginx service and check that 6443 port has been monitored
systemctl start nginx
systemctl enable nginx
netstat -natp | grep nginx

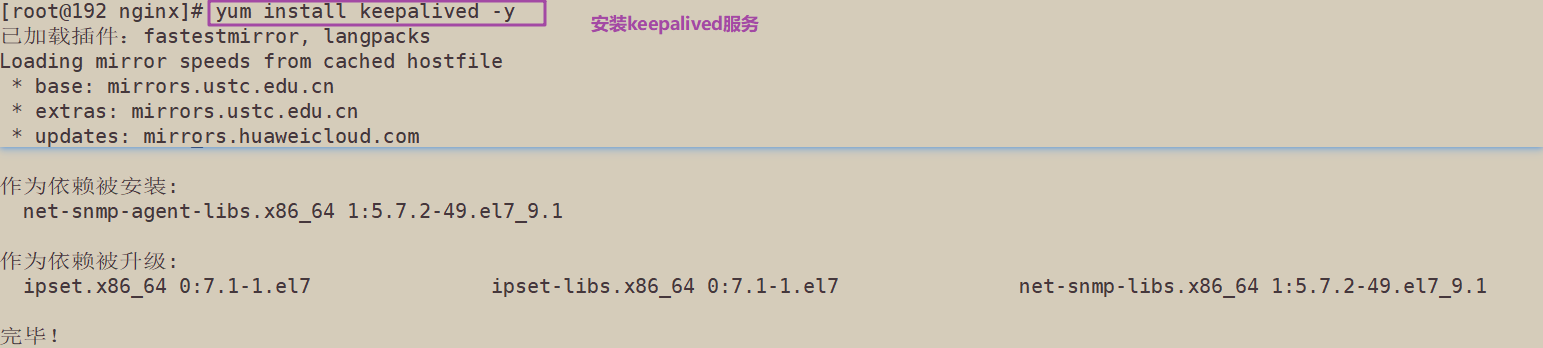
5. Deploy keepalived service
yum install keepalived -y
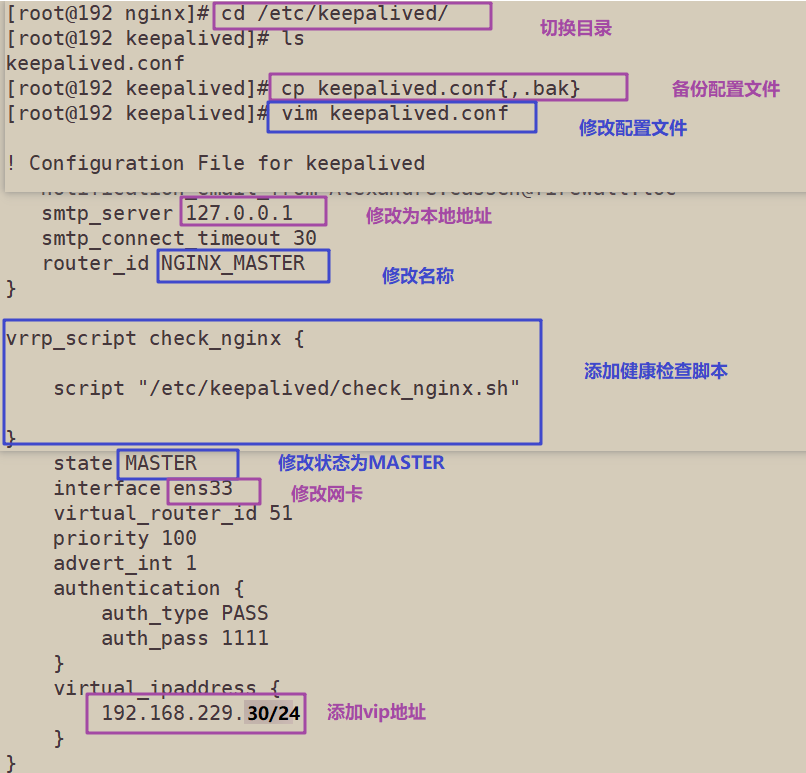
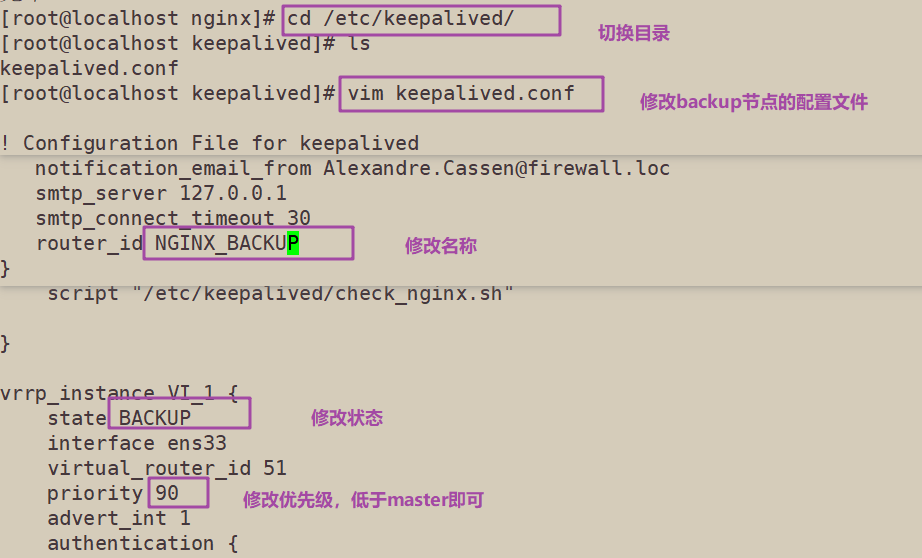
6. Modify the keepalived configuration file
vim /etc/keepalived/keepalived.conf
! Configuration File for keepalived
global_defs {
# Receiving email address
notification_email {
acassen@firewall.loc
failover@firewall.loc
sysadmin@firewall.loc
}
# Email address
notification_email_from Alexandre.Cassen@firewall.loc
smtp_server 127.0.0.1
smtp_connect_timeout 30
router_id NGINX_MASTER #lb01 node is NGINX_MASTER, lb02 node is NGINX_BACKUP
}
#Add a script that executes periodically
vrrp_script check_nginx {
script "/etc/keepalived/check_nginx.sh" #Specifies the script path to check nginx survival
}
vrrp_instance VI_1 {
state MASTER #MASTER for node lb01 and BACKUP for node lb02
interface ens33 #Specify the network card name ens33
virtual_router_id 51 #Specify vrid, and the two nodes should be consistent
priority 100 #100 for lb01 node and 90 for lb02 node
advert_int 1
authentication {
auth_type PASS
auth_pass 1111
}
virtual_ipaddress {
192.168.80.30/24 #Specify VIP
}
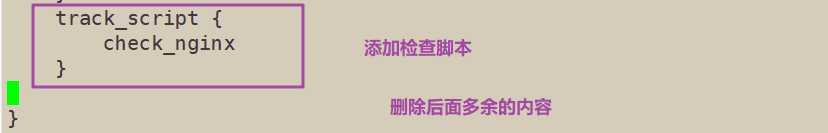
track_script {
check_nginx #Specify vrrp_script configured script
}
}
Other redundant configurations are deleted

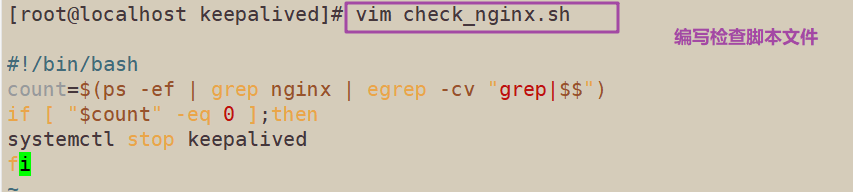
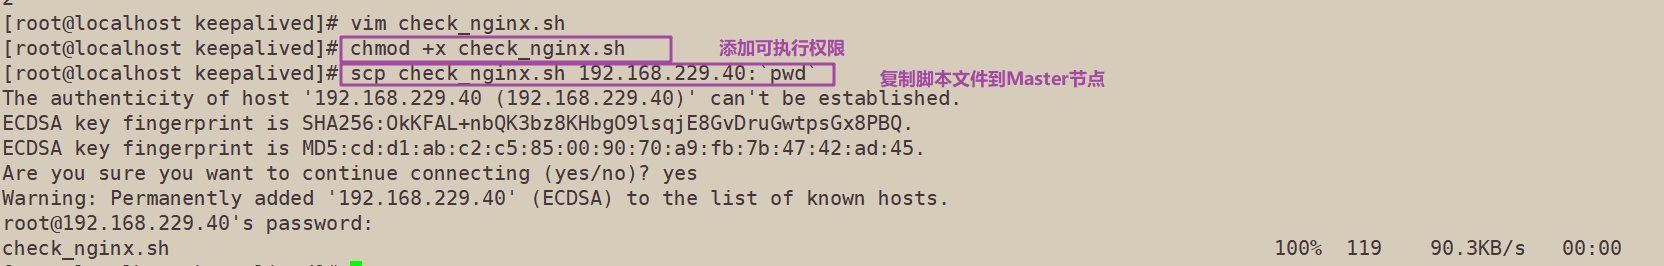
7. Create nginx status check script
vim /etc/keepalived/check_nginx.sh
#!/bin/bash
#egrep -cv "grep $$" is used to filter out the current Shell process ID containing grep or $$
count=$(ps -ef | grep nginx | egrep -cv "grep|$$")

if [ "$count" -eq 0 ];then
systemctl stop keepalived
fi


chmod +x /etc/keepalived/check_nginx.sh
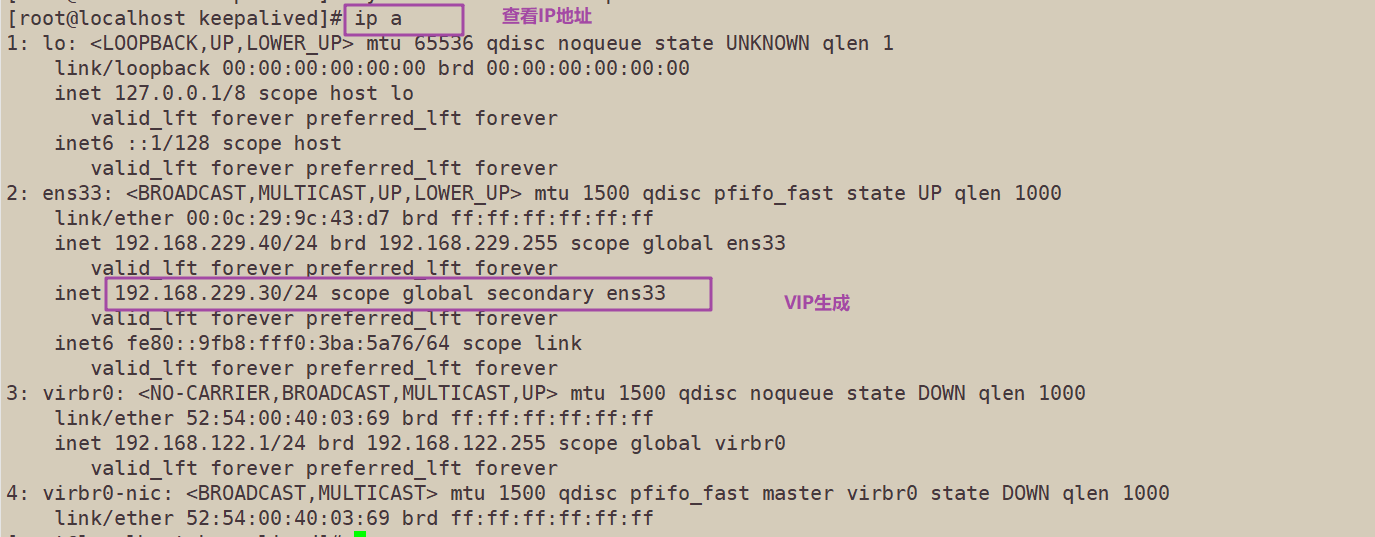
8. Start the keepalived service (be sure to start the nginx service before starting the keepalived service)
systemctl start keepalived
systemctl enable keepalived
ip a	#Check whether VIP is generated

10. Modify the bootstrap.kubeconfig on the node node, and the kubelet.kubeconfig configuration file is VIP
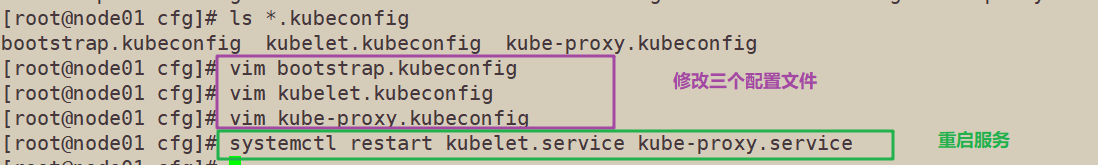
cd /opt/kubernetes/cfg/
vim bootstrap.kubeconfig
server: https://192.168.229.30:6443

vim kubelet.kubeconfig
server: https://192.168.229.30:6443

vim kube-proxy.kubeconfig
server: https://192.168.229.30:6443
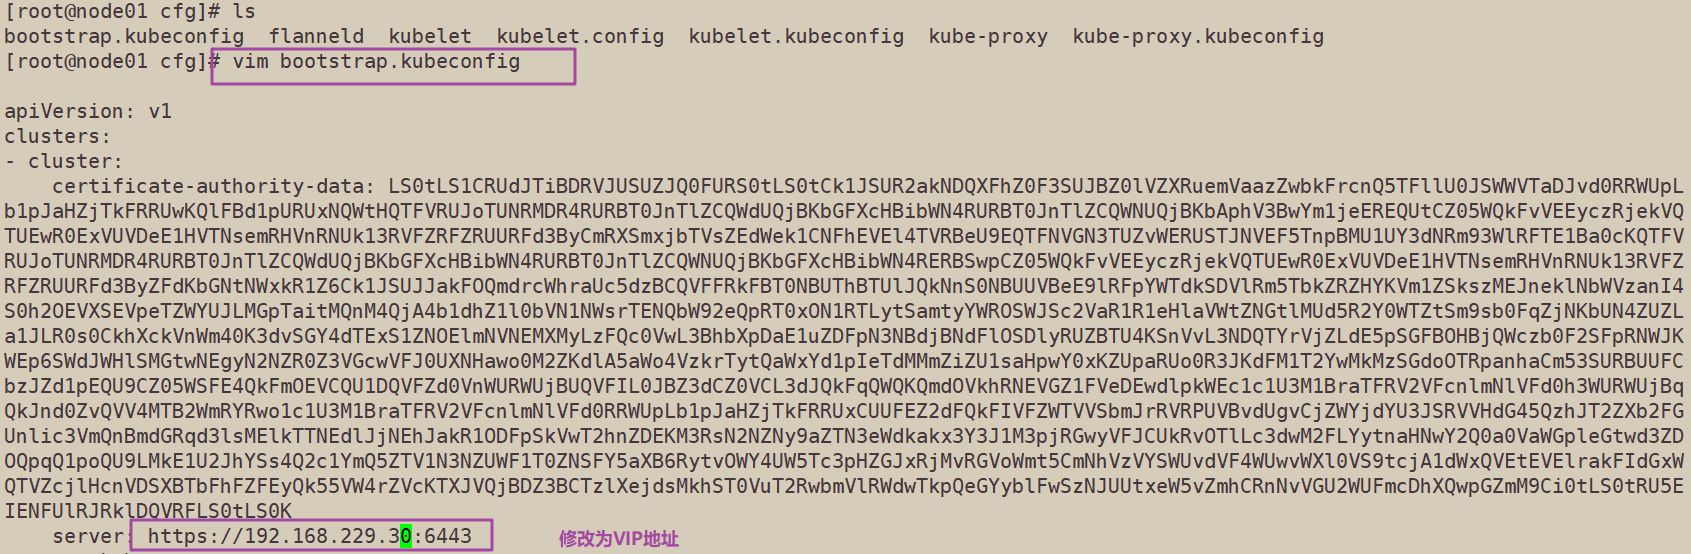
The three configuration files can be modified as virtual VIP s. Only one file is displayed here; Both nodes need to be modified
11. Restart kubelet and Kube proxy services
systemctl restart kubelet.service
systemctl restart kube-proxy.service
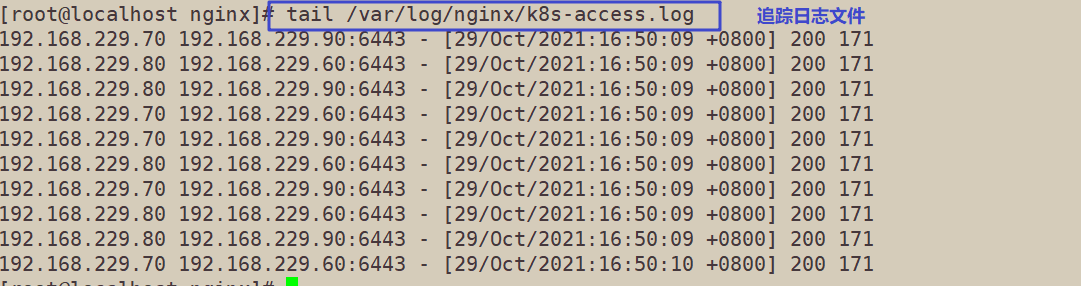
12. View nginx's k8s log on lb01
tail /var/log/nginx/k8s-access.log
======Operate on the master02 node======
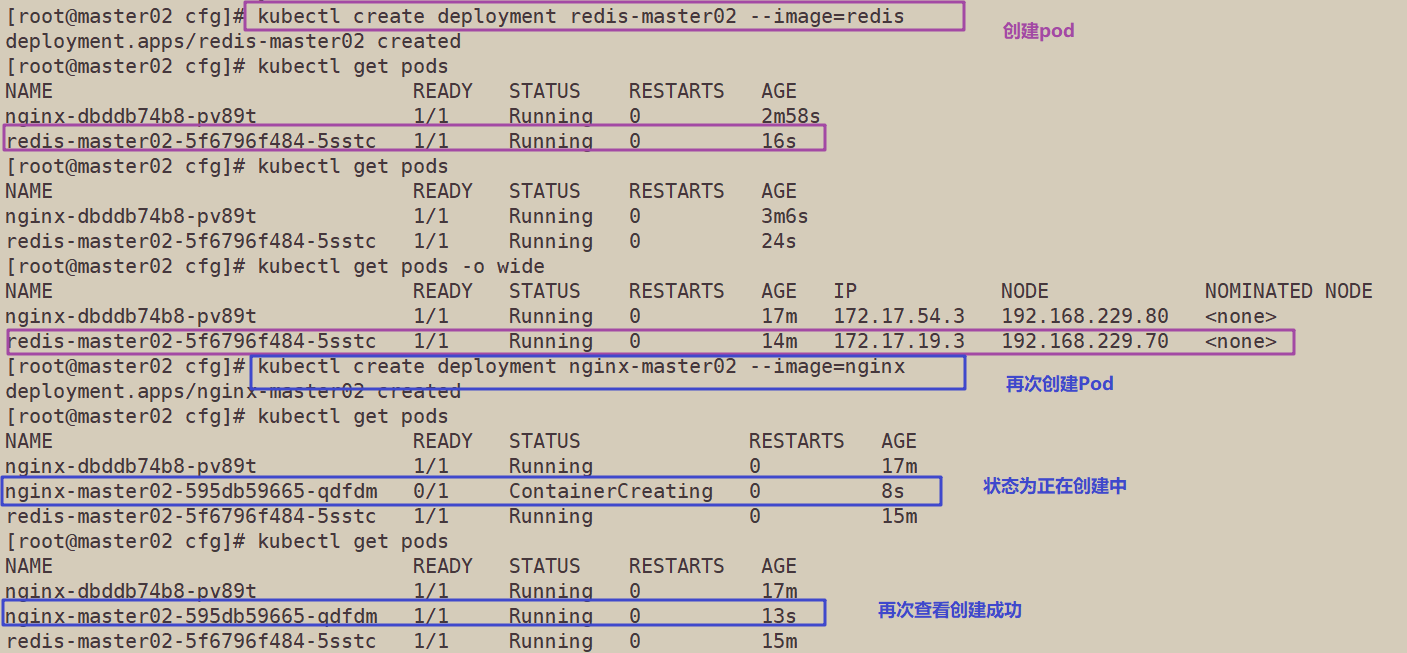
13. Test create pod
kubectl create deployment redis-master02 --image=redis
14. View status information of Pod
kubectl get pods
NAME READY STATUS RESTARTS AGE
nginx-dbddb74b8-nf9sk 0/1 ContainerCreating 0 33s #Creating
kubectl get pods
NAME READY STATUS RESTARTS AGE
nginx-dbddb74b8-nf9sk 1/1 Running 0 80s #Creation completed, running

kubectl get pods -o wide
NAME READY STATUS RESTARTS AGE IP NODE NOMINATED NODE
nginx-dbddb74b8-26r9l 1/1 Running 0 10m 172.17.36.2 192.168.80.15 <none>
//READY is 1 / 1, indicating that there is one container in this Pod

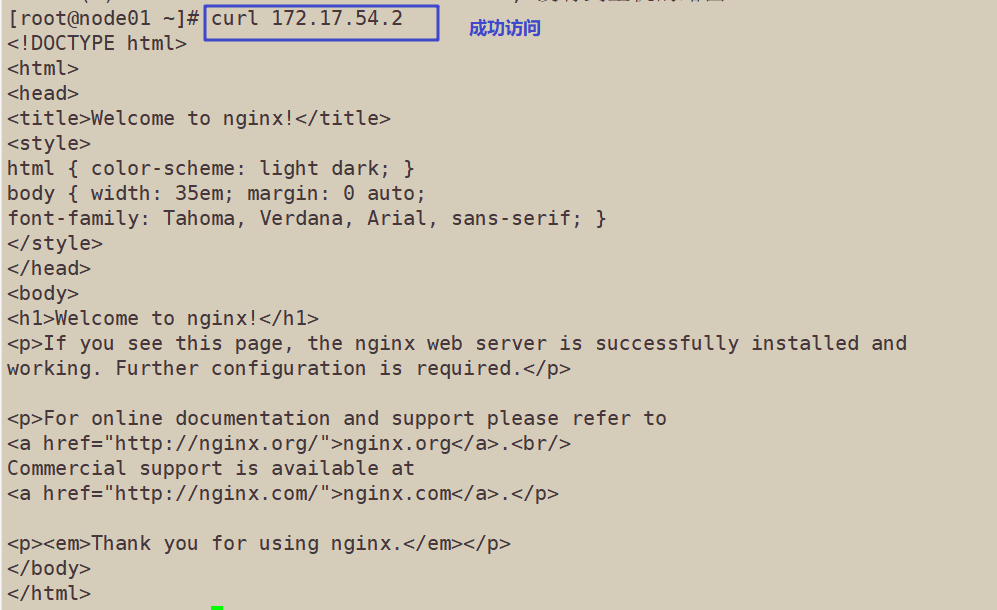
15. Operate on the node node of the corresponding network segment, which can be accessed directly using the browser or curl command
curl 172.17.54.2
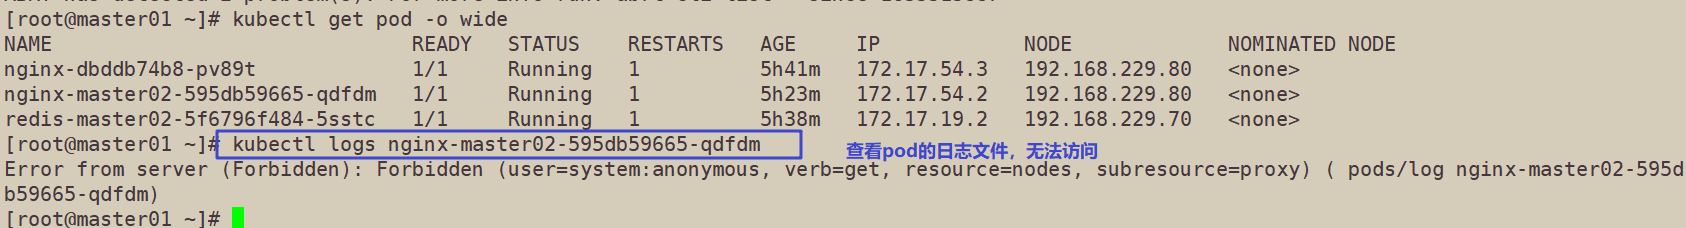
16. At this time, view the nginx log on the master01 node and find that you do not have permission to view it
kubectl logs nginx-dbddb74b8-nf9sk
Error from server (Forbidden): Forbidden (user=system:anonymous, verb=get, resource=nodes, subresource=proxy) ( nginx-dbddb74b8-nf9sk)
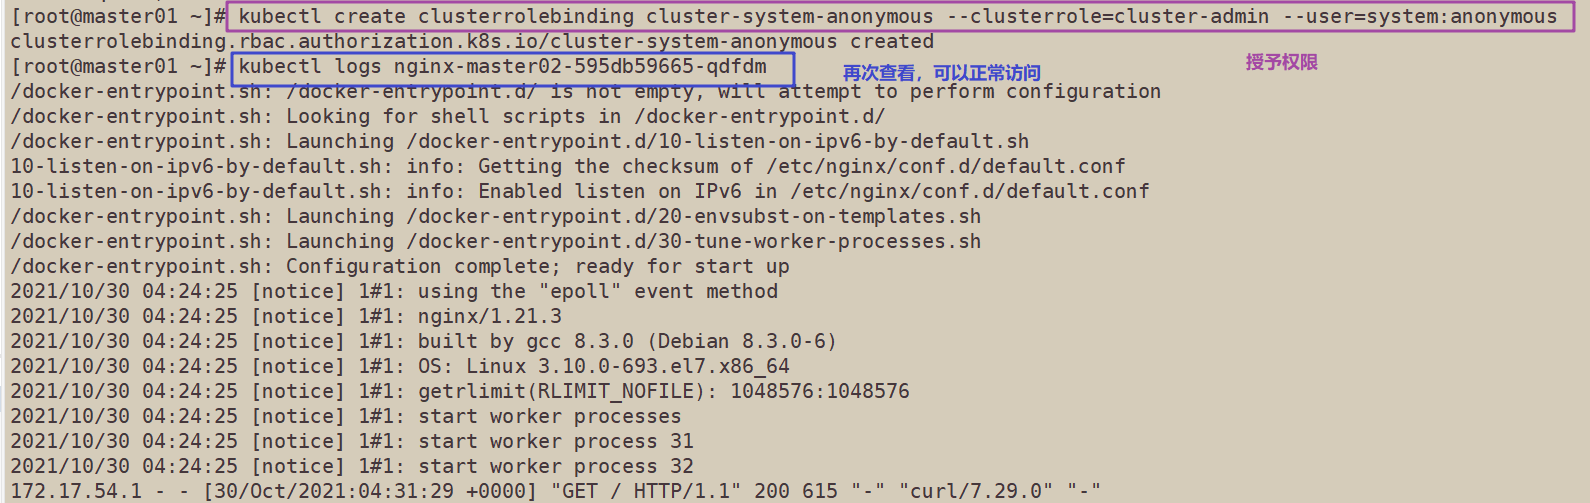
17. On the master01 node, grant the cluster admin role to the user system:anonymous
kubectl create clusterrolebinding cluster-system-anonymous --clusterrole=cluster-admin --user=system:anonymous
clusterrolebinding.rbac.authorization.k8s.io/cluster-system-anonymous created
Check the nginx log again
kubectl logs nginx-dbddb74b8-nf9sk
4, Deploy Dashboard UI
Introduction to Dashboard
The dashboard is a Web-based Kubernetes user interface. You can use the dashboard to deploy containerized applications to the Kubernetes cluster, troubleshoot containerized applications, and manage the cluster itself and its accompanying resources.
You can use the dashboard to outline the applications running on the cluster and to create or modify individual Kubernetes resources (such as deployment, jobs, daemons, etc.).
For example, you can use the Deployment Wizard to extend the deployment, start rolling updates, restart the Pod, or deploy a new application. The dashboard also provides information about the status of the Kubernetes resource in the cluster and any errors that may occur.
======Operate on the master1 node======
1. Create dashborad working directory in k8s working directory
mkdir /opt/k8s/dashboard
cd /opt/k8s/dashboard
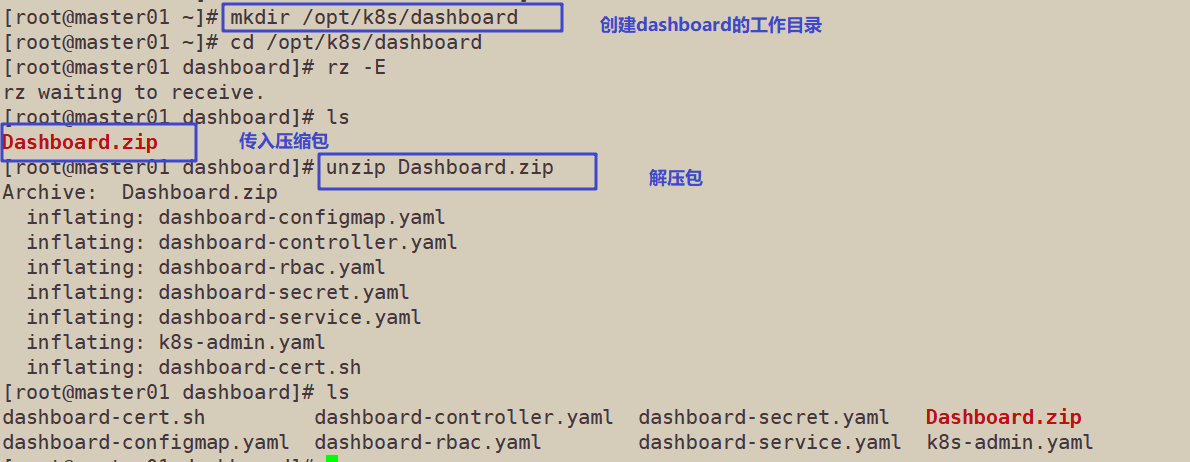
//Upload the Dashboard.zip package and decompress it. There are 7 files in total, including 5 core files for building the interface. A k8s-admin.yaml file is written by yourself to generate the token to be used when logging in the browser later; A dashboard-cert.sh is used to quickly generate the certificate file required to solve the problem of encrypted communication in Google browser
//Official download resource address of core files: https://github.com/kubernetes/kubernetes/tree/master/cluster/addons/dashboard
dashboard-configmap.yaml dashboard-rbac.yaml dashboard-service.yaml dashboard-controller.yaml dashboard-secret.yaml k8s-admin.yaml dashboard-cert.sh
------------------------------------------------------------------------------------------
1. dashboard-rbac.yaml: used to set access control and configure access control permissions and role binding (binding roles and service accounts) of various roles. The content includes rules configured for various roles
2. dashboard-secret.yaml: provides a token for accessing the API server (personally understood as a security authentication mechanism)
3. dashboard-configmap.yaml: configuration template file, which is responsible for setting the file of dashboard. ConfigMap provides a way to inject configuration data into the container to ensure that the application configuration in the container is decoupled from the Image content
4. dashboard-controller.yaml: responsible for the creation of controller and service account to manage the pod copy
5. dashboard-service.yaml: responsible for providing services in the container for external access
------------------------------------------------------------------------------------------
2. Create resources through the kubectl create command
cd /opt/k8s/dashboard
1. Specify the permissions of kubernetes dashboard minimal: for example, it has different permissions such as obtaining updates and deleting
kubectl create -f dashboard-rbac.yaml
If there are several kind, several results will be created in the format of kind+apiServer/name
role.rbac.authorization.k8s.io/kubernetes-dashboard-minimal created
rolebinding.rbac.authorization.k8s.io/kubernetes-dashboard-minimal created

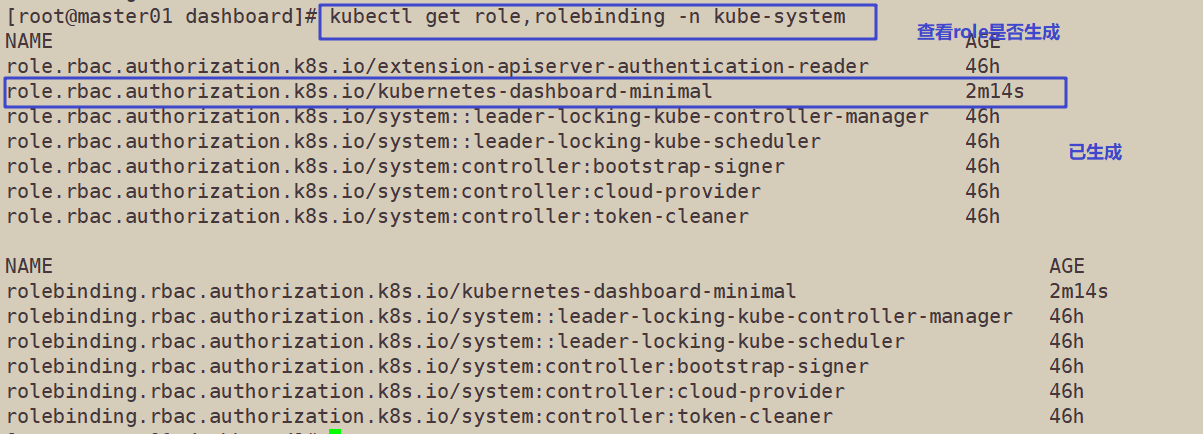
//Check whether the resource object kubernetes dashboard minimal of type role and rolebinding is generated
kubectl get role,rolebinding -n kube-system
//-N Kube system means to view the pod in the specified namespace. The default value is default
3. Certificate and key creation
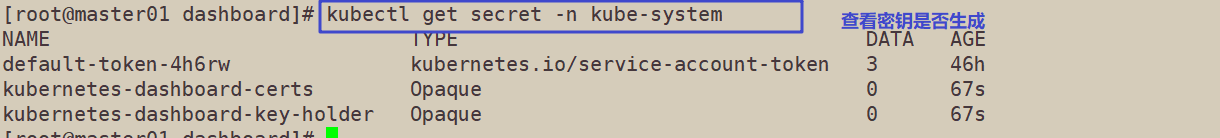
kubectl create -f dashboard-secret.yaml
secret/kubernetes-dashboard-certs created
secret/kubernetes-dashboard-key-holder created

Check whether the resource objects kubernetes dashboard certs and kubernetes dashboard key holder of type Secret are generated
kubectl get secret -n kube-system
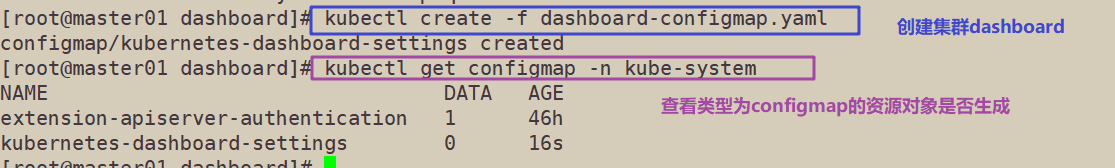
4. Configuration file, for the creation of cluster dashboard settings
kubectl create -f dashboard-configmap.yaml
configmap/kubernetes-dashboard-settings created
//Check whether the resource object kubernetes dashboard settings of type ConfigMap is generated
kubectl get configmap -n kube-system
5. Create the controller and service account required by the container
kubectl create -f dashboard-controller.yaml
serviceaccount/kubernetes-dashboard created
deployment.apps/kubernetes-dashboard created
//Check whether the resource object kubernetes dashboard settings of type serviceaccount and deployment is generated
kubectl get serviceaccount,deployment -n kube-system

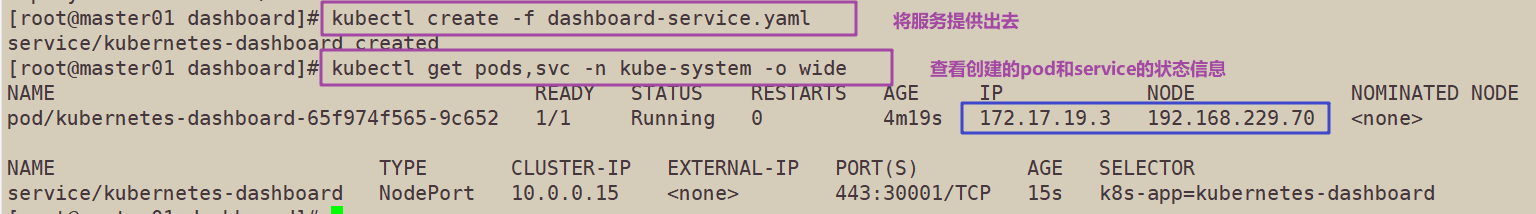
6. Provide services
kubectl create -f dashboard-service.yaml
service/kubernetes-dashboard created
//View the status information of the pod and service created under the specified Kube system namespace
kubectl get pods,svc -n kube-system -o wide
//svc is the abbreviation of service, which can be viewed through kubectl API resources
NAME READY STATUS RESTARTS AGE IP NODE NOMINATED NODE
pod/kubernetes-dashboard-7dffbccd68-c6d24 1/1 Running 1 11m 172.17.26.2 192.168.80.11 <none>

NAME TYPE CLUSTER-IP EXTERNAL-IP PORT(S) AGE SELECTOR
service/kubernetes-dashboard NodePort 10.0.0.75 <none> 443:30001/TCP 11m k8s-app=kubernetes-dashboard
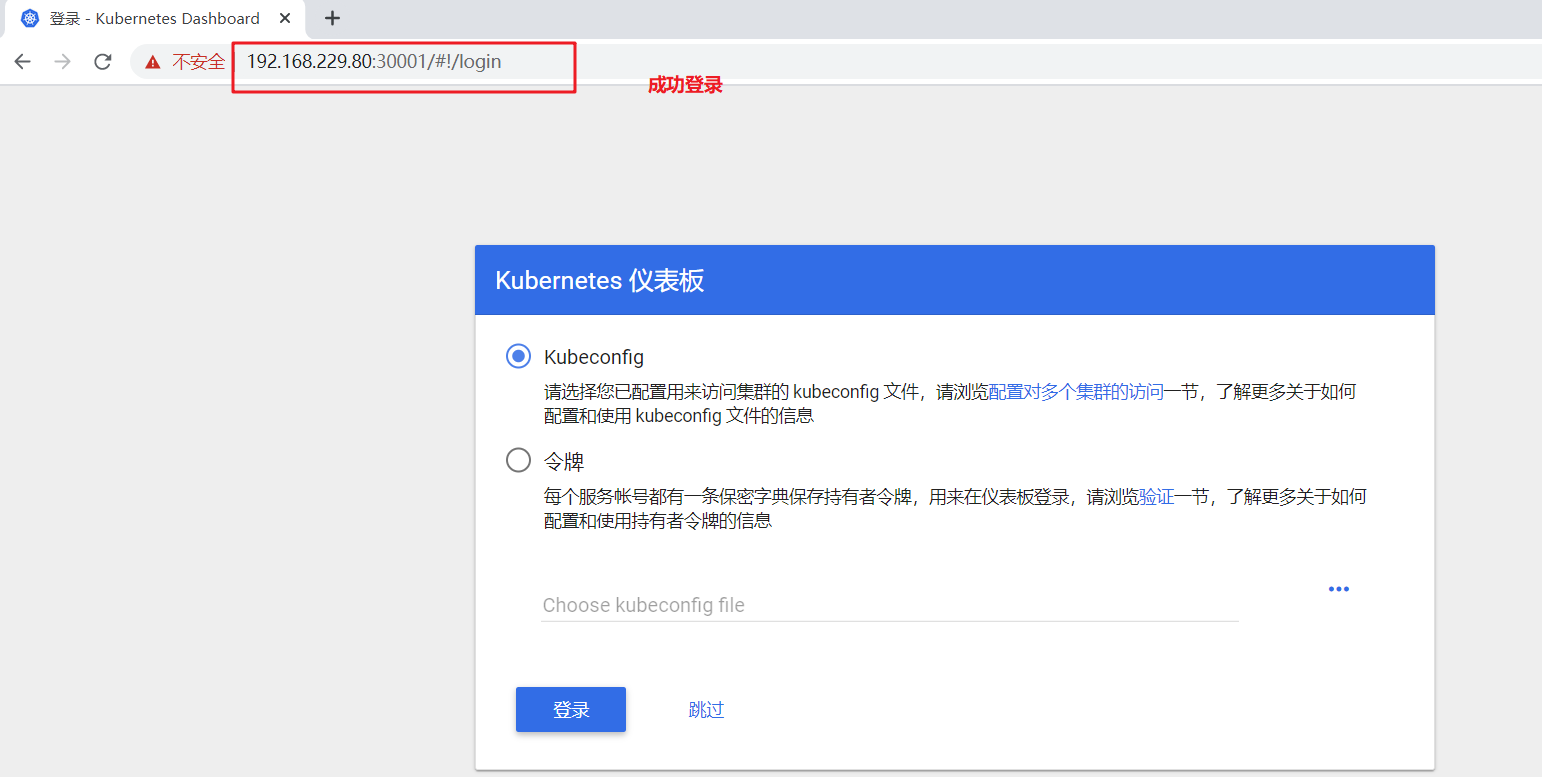
7. The dashboard is assigned to the node01 server. The access port is port 30001. Open the browser for access https://nodeIP:30001 To test
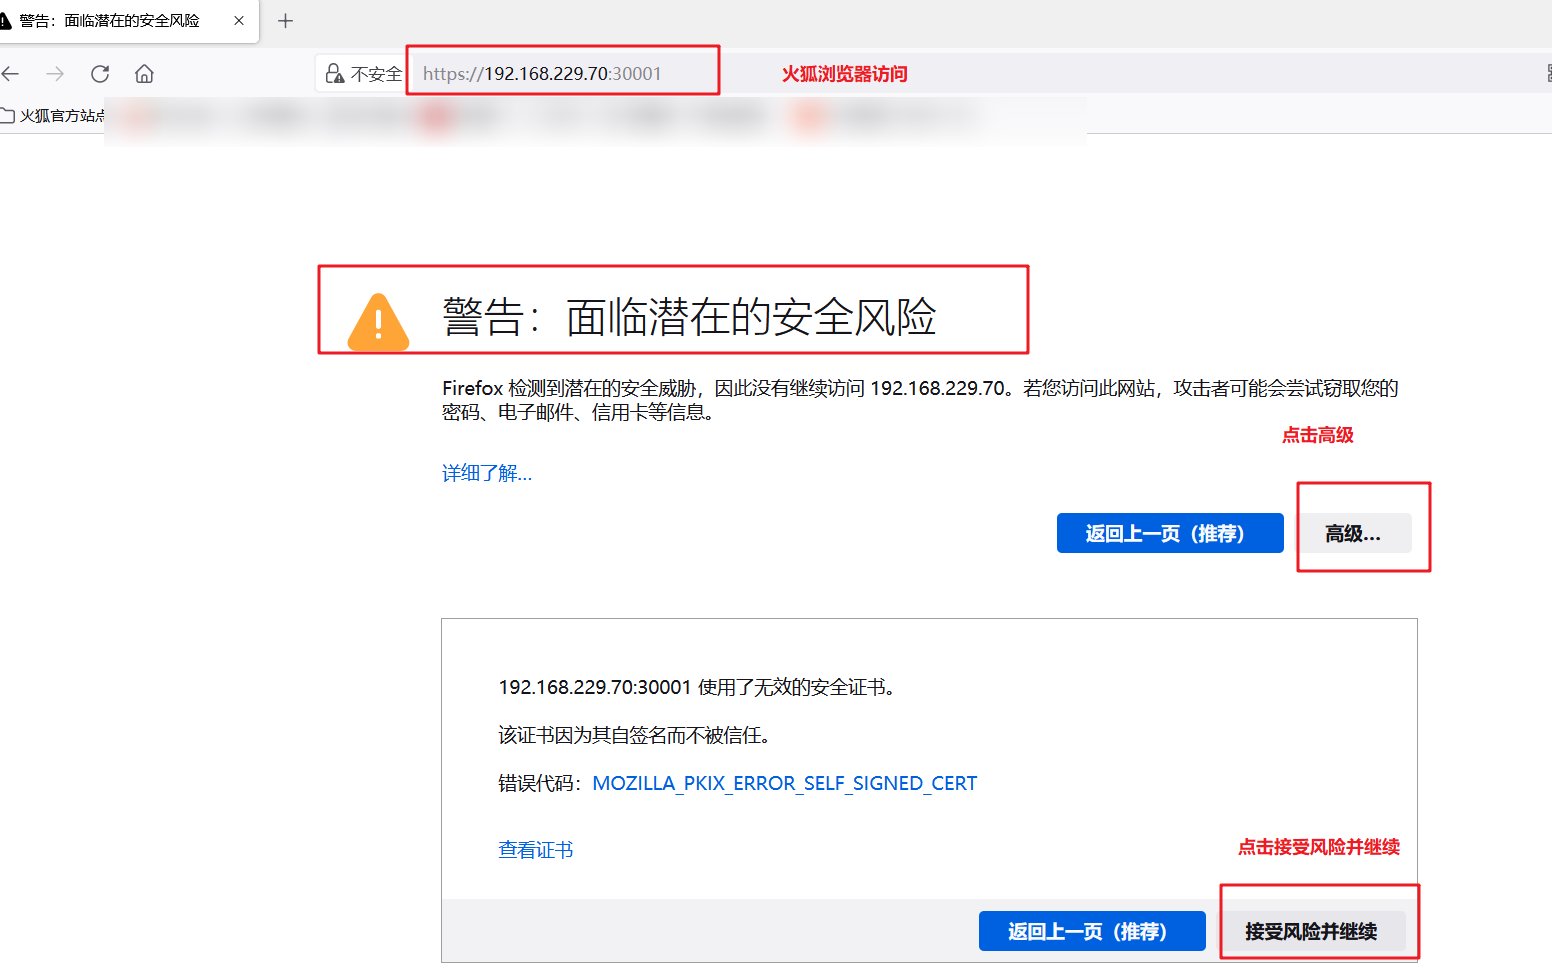
Firefox browser can directly access: https://192.168.229.70:30001
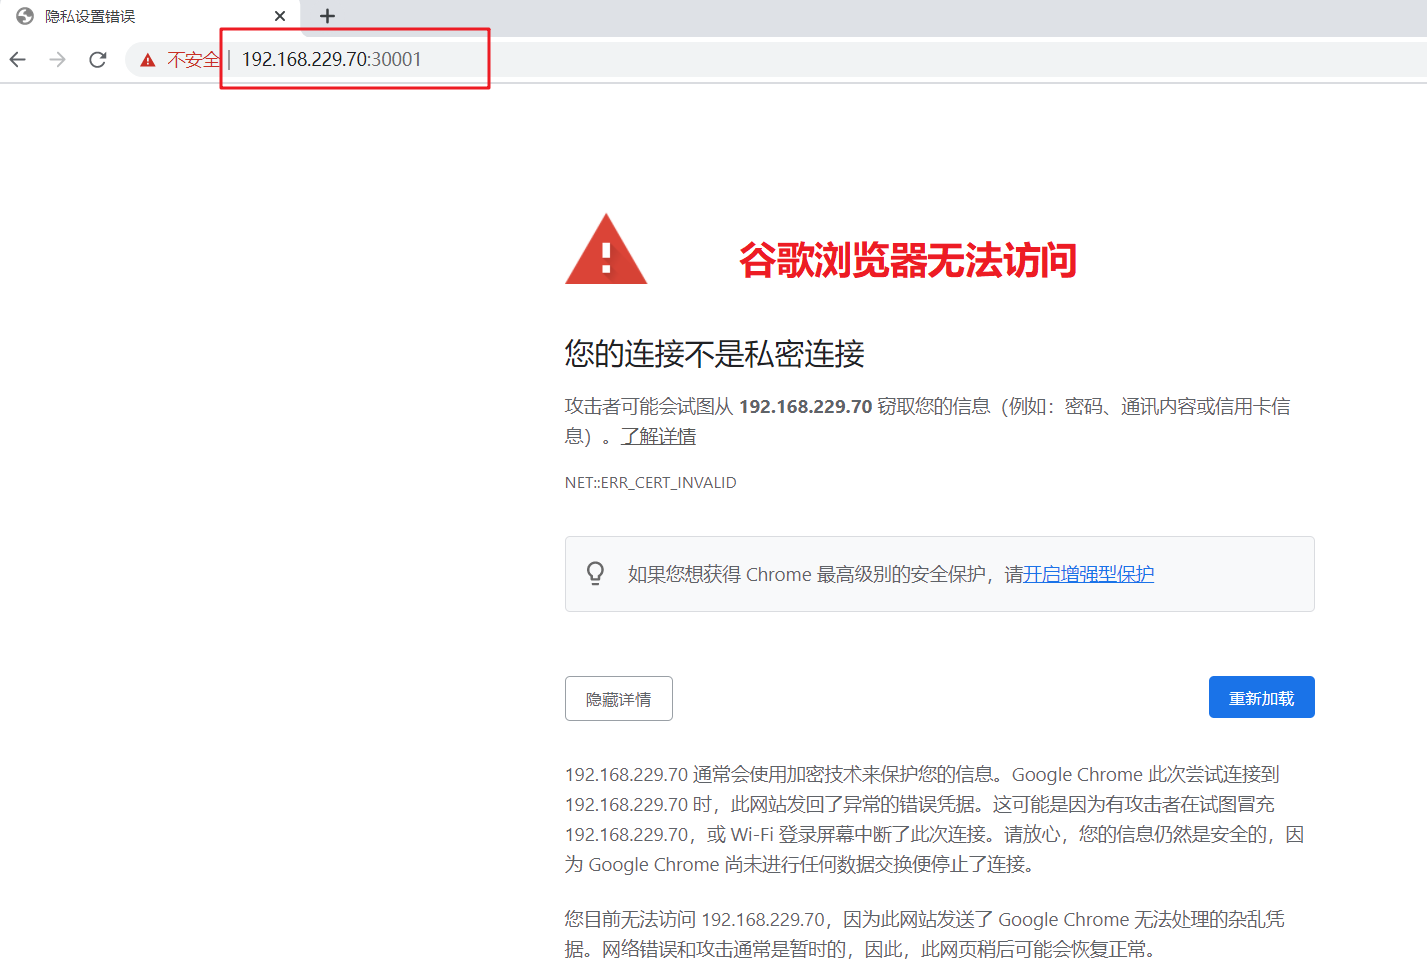
Google browser is unable to access directly because it lacks the authentication certificate for encrypted communication. You can view the reasons for the access failure through the menu - > more tools - > developer tools - > security.
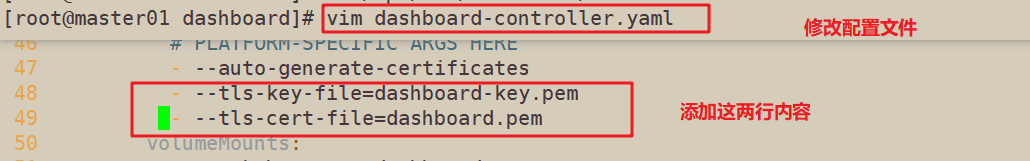
8. To solve the problem of encrypted communication in Google browser, use the script dashboard-cert.sh to quickly generate the certificate file
cd /opt/k8s/dashboard/
vim dashboard-controller.yaml
......
args:
# PLATFORM-SPECIFIC ARGS HERE
- --auto-generate-certificates
#Add the following two lines under line 47 of the file to specify the private key and certificate file for encryption (tls)
- --tls-key-file=dashboard-key.pem
- --tls-cert-file=dashboard.pem
9. Execute script
cd /opt/k8s/dashboard/
chmod +x dashboard-cert.sh
./dashboard-cert.sh /opt/k8s/k8s-cert/
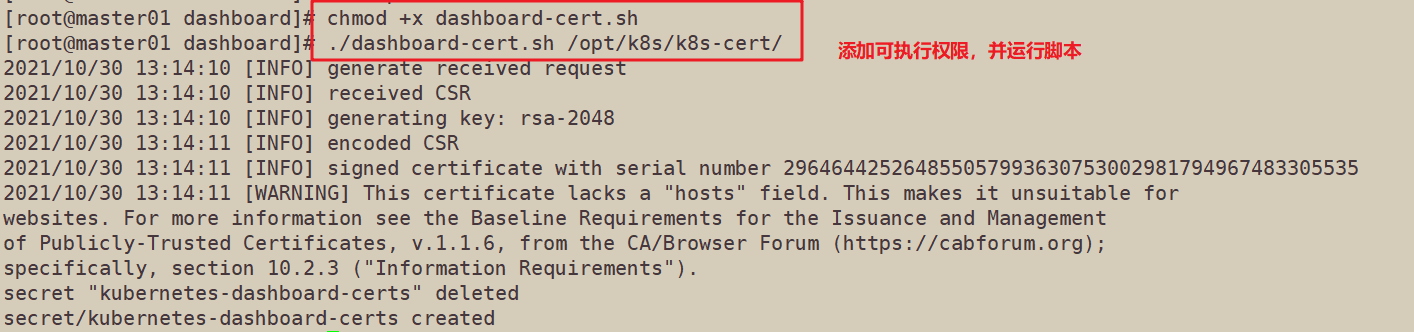
10. Two certificates will be generated in the dashboard working directory
ls *.pem
dashboard.pem	dashboard-key.pem

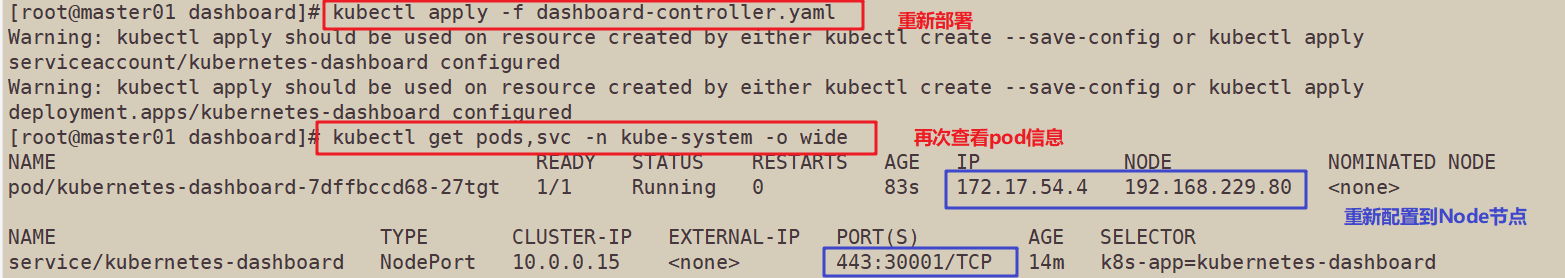
11. Redeploy (Note: when apply does not take effect, first use delete to clear the resources, and then apply to create the resources)
kubectl apply -f dashboard-controller.yaml
//Since the assigned node may be replaced, check the server address and port number of the assigned node again
kubectl get pods,svc -n kube-system -o wide
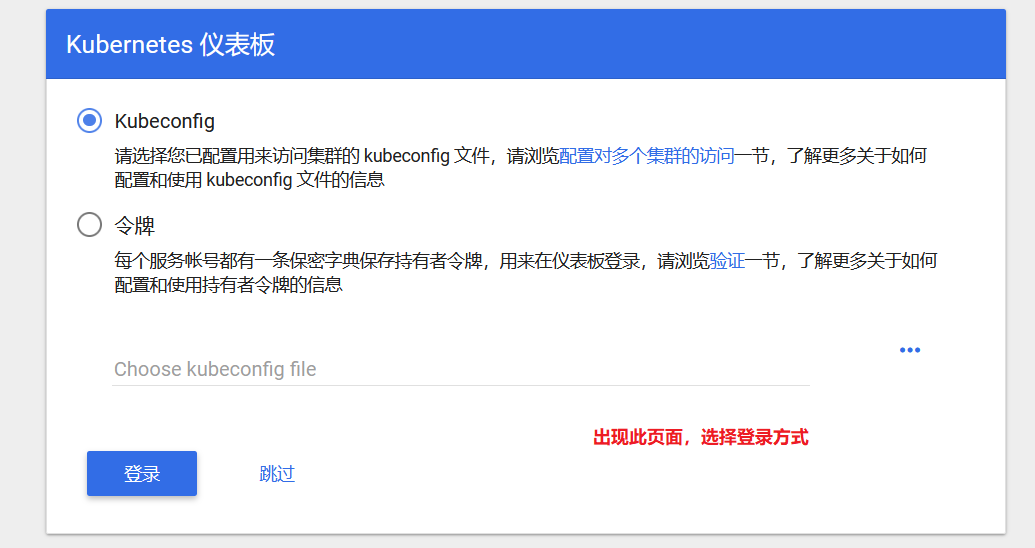
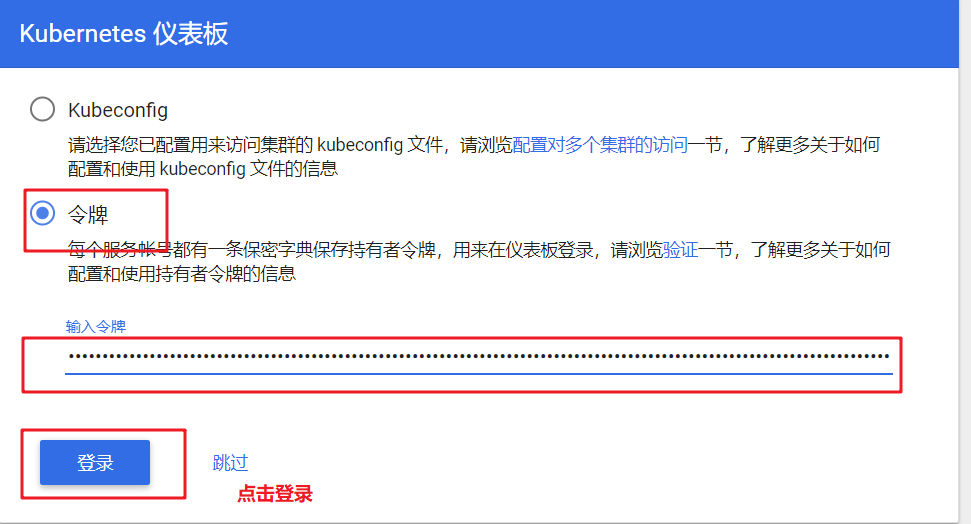
//Conduct the access test again, choose to log in using token mode, and use k8s-admin.yaml file to create token
cd /opt/k8s/dashboard/
kubectl create -f k8s-admin.yaml
#Get the brief information of the token. The name is dashboard admin token XXXXX
kubectl get secrets -n kube-system
NAME TYPE DATA AGE
dashboard-admin-token-kpmm8 kubernetes.io/service-account-token 3
default-token-7dhwm kubernetes.io/service-account-token 3
kubernetes-dashboard-certs Opaque 11
kubernetes-dashboard-key-holder Opaque 2
kubernetes-dashboard-token-jn94c kubernetes.io/service-account-token 3
//Check the token serial number and take the contents after token:
kubectl describe secrets dashboard-admin-token-kpmm8 -n kube-system
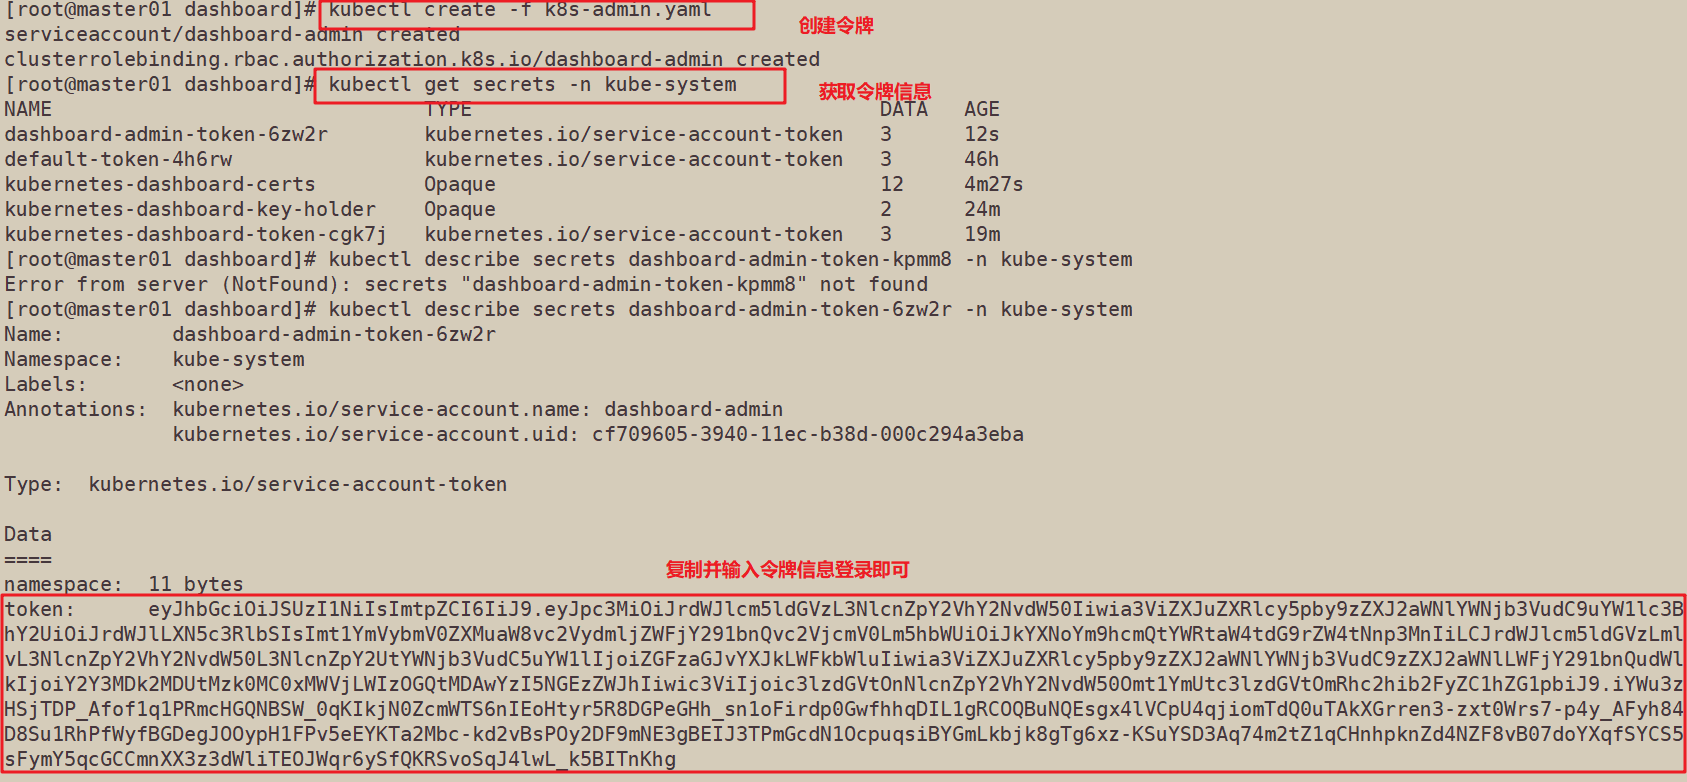
//Copy and fill the token serial number into the browser page, and click login
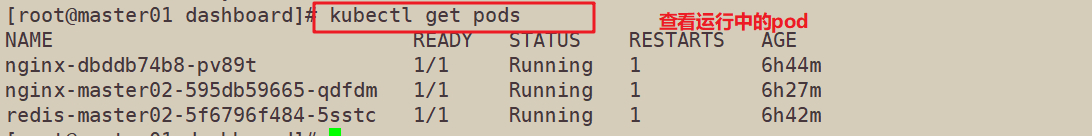
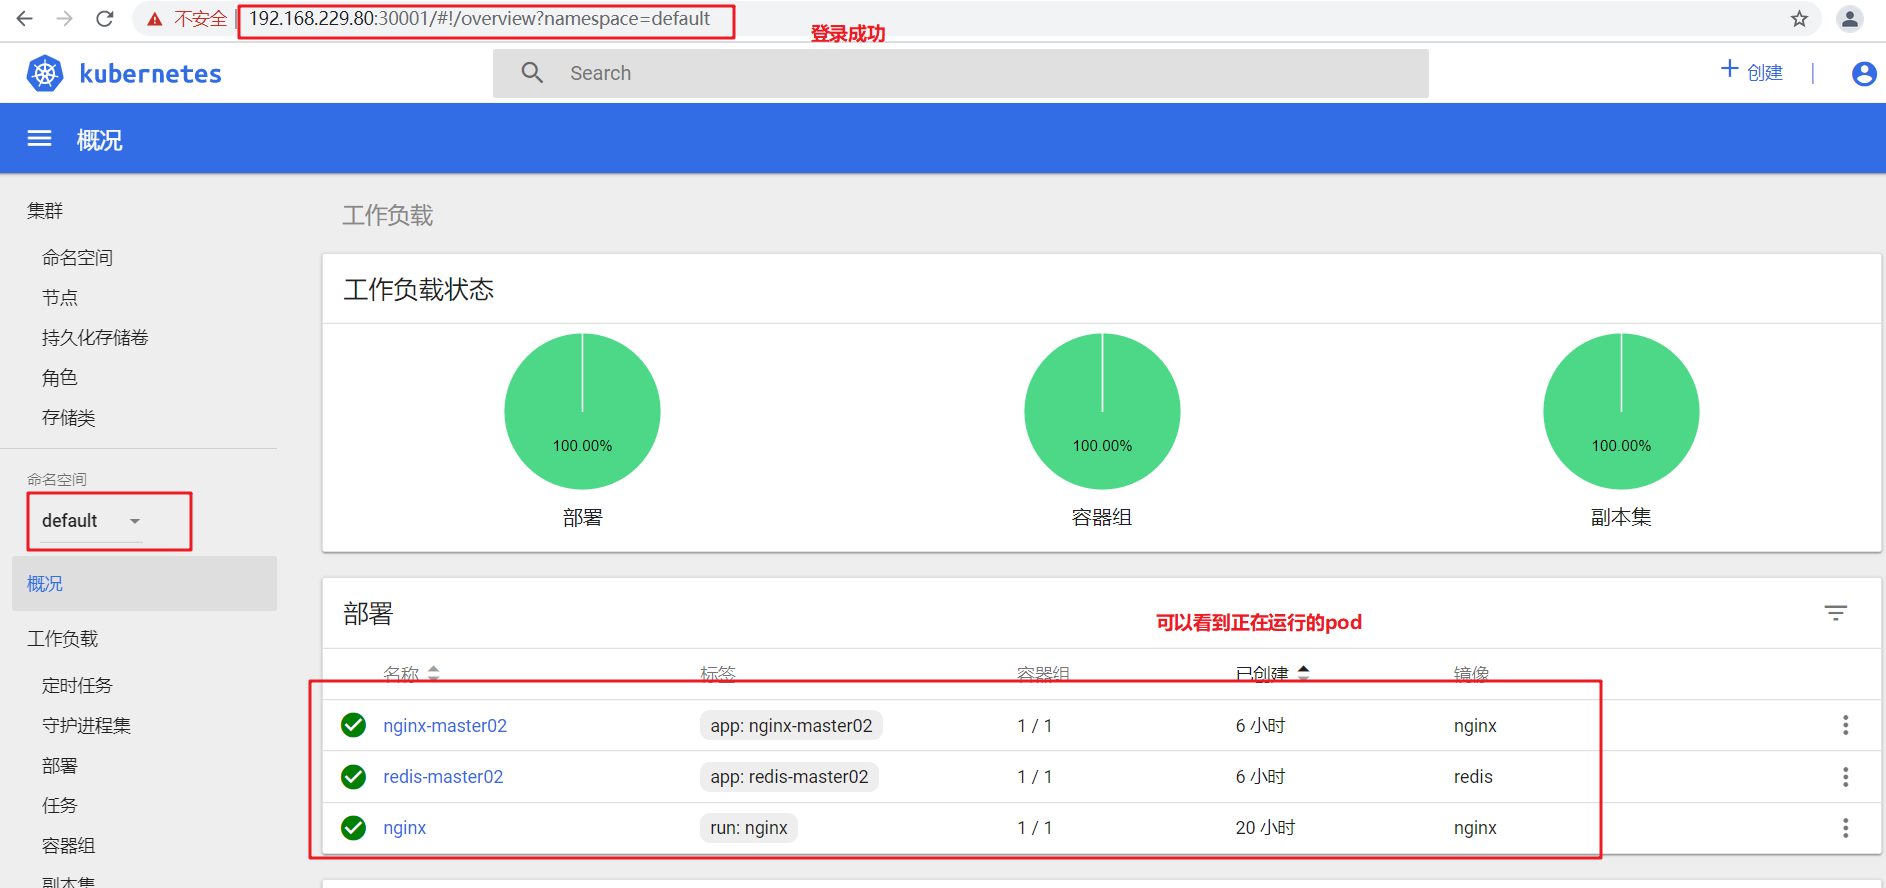
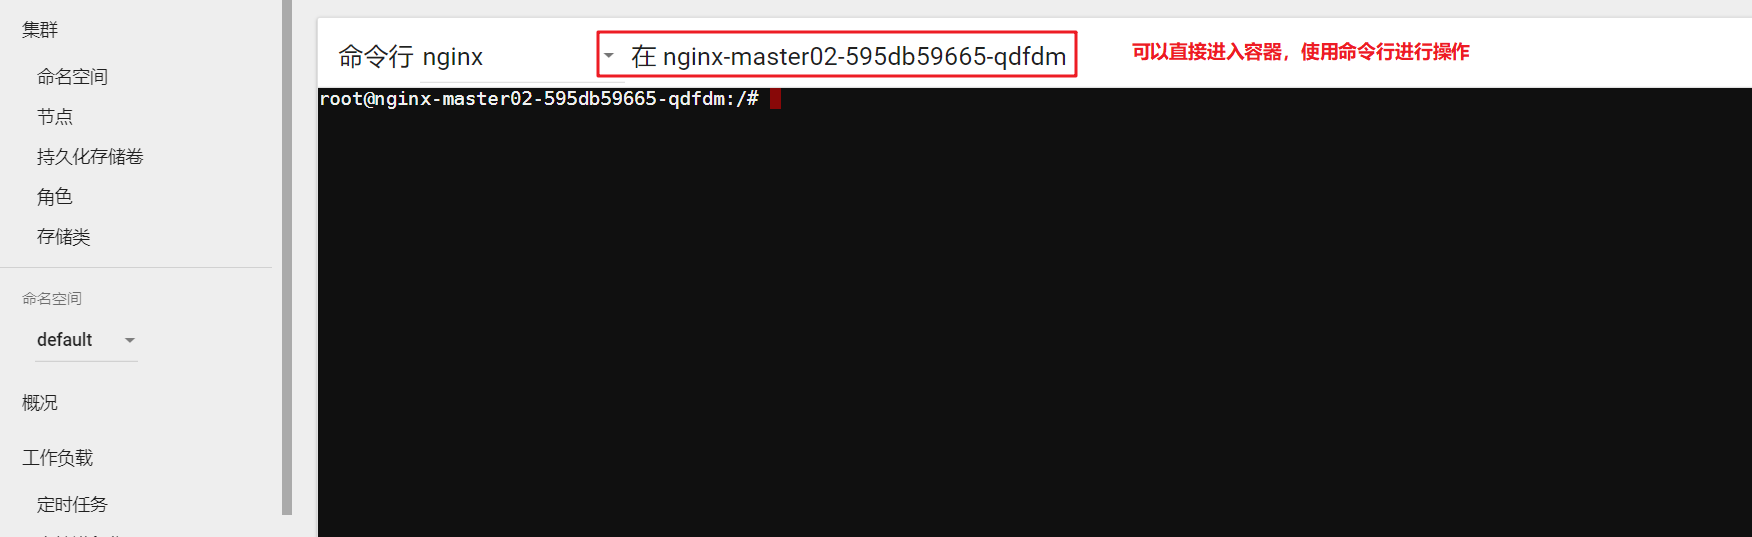
First check whether there are resources running in the cluster through the kubectl get pods command, and then select default in the command space in the Dashboard UI interface,
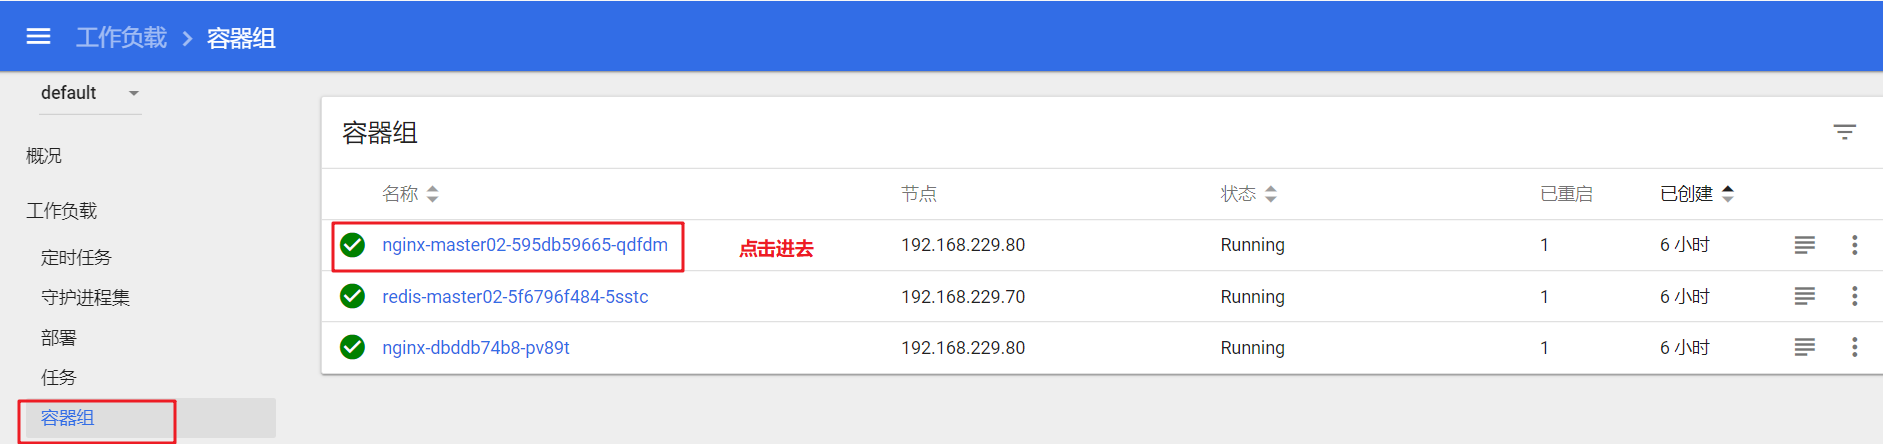
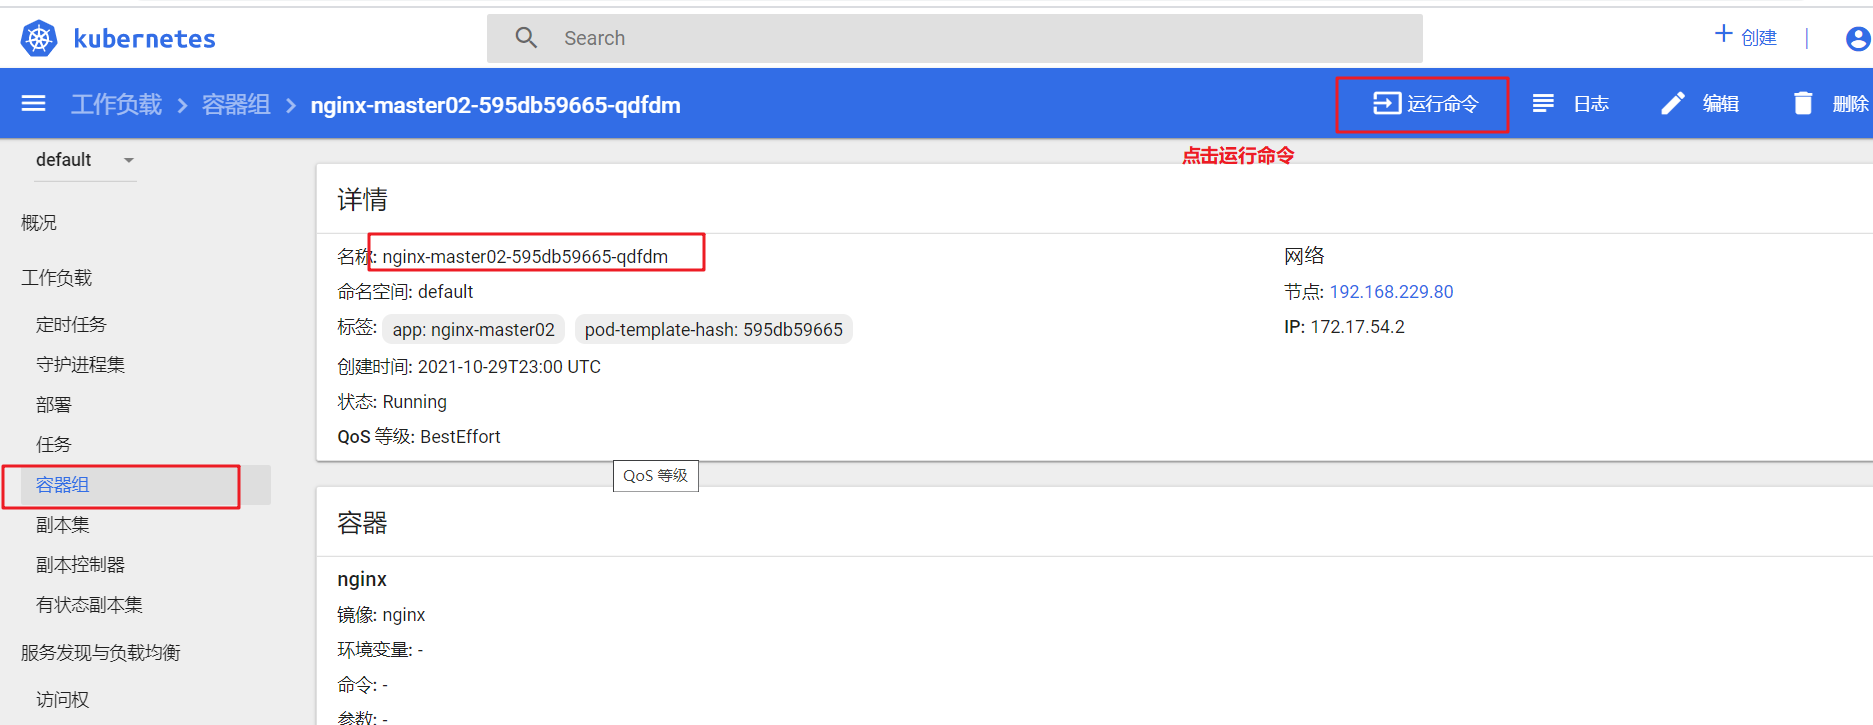
Click "container group" in the sidebar, click the container name to enter a page, click the "run command" or "log" control in the upper right to pop up another additional page. You can enter curl < pop > command in "run command" to access the container, and then view the log update results through the dashboard page.