1. Introduction to KNN algorithm
K-nearest neighbors (KNN) is a very basic machine learning method, which is also used in our daily life involuntarily. For example, when we judge a person's character, we only need to observe the character of the people closest to him. Here we use KNN's idea. KNN method can be used for both classification and regression.
2.KNN flow chart
When establishing a training set, it is necessary to determine the training data and its corresponding category labels; then, compare the test data to be classified with the training set data in turn; select the closest k data from the training set, and the classification with the most votes in the k data is the category of new samples.
3. Problem description
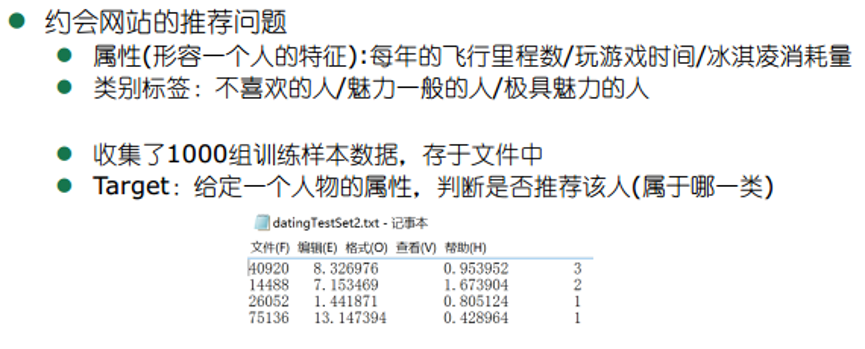
4.KNN code
from numpy import *
import operator
import matplotlib
import matplotlib.pyplot as plt
import pandas as pd
from sklearn.model_selection import train_test_split
from sklearn import datasets
import seaborn as sns
from sklearn.metrics import accuracy_score,f1_score, precision_score, recall_score

def file2matrix(filename):
    fr = open(filename)
    arrayOLines = fr.readlines()
    numberOfLines = len(arrayOLines)
    returnMat = zeros((numberOfLines,3))
    classLabelVector = []
    index = 0
    for line in arrayOLines:
        listFromLine = line.strip().split('\t')
        returnMat[index,:] = listFromLine[0:3]
        classLabelVector.append(int(listFromLine[-1]))
        index += 1
    return returnMat,classLabelVector

#datingDataMat,datingLabels = file2matrix('datingTestSet2.txt')
#print(datingDataMat)
#print(datingLabels[0:10])
def corCoefficient():
    datingDataMat,datingLabels = file2matrix('datingTestSet2.txt')
    for i in range(3):
        a = datingDataMat[:,i]
        b = corrcoef(a,datingLabels)
        print("The first%d Correlation coefficients of features and outputs:"%(i+1),b[0][1])
    c = corrcoef(datingDataMat,rowvar=0)
    print(c[0][1],c[0][2],c[1][2])
    plt.figure(figsize=(5,5))
    sns.heatmap(c,annot=True)

    fig = plt.figure()
    ax1 = fig.add_subplot(111)
    plt.xlabel("Miles")
    plt.ylabel("Time")
    ax1.scatter(datingDataMat[:,0],datingDataMat[:,1],s = [15],c = array(datingLabels))
    plt.show()

def autoNorm(dataSet):
    minVals = dataSet.min(0)
    maxVals = dataSet.max(0)
    ranges = maxVals - minVals
    normDataSet = zeros(shape(dataSet))
    m = dataSet.shape[0]
    normDataSet = dataSet - tile(minVals,(m,1))
    normDataSet = normDataSet/tile(ranges,(m,1))
    return normDataSet,minVals,ranges

#normMat,minVals,ranges = autoNorm(datingDataMat)
#print(normMat)
#print(minVals)
#print(ranges)
#print('------------------------------------------')

def classify(inX,dataSet,labels,k):
    dataSetSize = dataSet.shape[0]
    diffMat = tile(inX,(dataSetSize,1)) - dataSet
    sqDiffMat = diffMat**2
    sqDistances = sqDiffMat.sum(axis=1)
    distances = sqDistances**0.5
    sortedDistIndicies = distances.argsort()
    classCount={}
    for i in range(k):
        voteIlabel = labels[sortedDistIndicies[i]]
        classCount[voteIlabel] = classCount.get(voteIlabel,0) + 1
    sortedClassCount = sorted(classCount.items(),
                              key=operator.itemgetter(1),reverse=True)
    return sortedClassCount[0][0]


def datingClassVolidate():
#Get the best k=5
    datingDataMat,datingLabels = file2matrix('datingTestSet2.txt')
    normMat,minVals,ranges = autoNorm(datingDataMat)
    X_train,X_test,y_train,y_test=train_test_split(normMat,datingLabels,
test_size=0.2,random_state=2)
    #print ("train:",len(X_train), "test:",len(X_test))

    folds = 5
    k_choices = [1,3,5,7,9,11,13,15,17,19,21,23,25]
    #k_choices = [1,3,5,7,9,13,15,20,25]
    X_folds = []
    y_folds = []
    X_folds = vsplit(X_train,folds)
    y_folds = hsplit(array(y_train),folds)

    accuracy_of_k = {}
    for k in k_choices:
        accuracy_of_k[k] = []

    for i in range(folds):
        X_train = vstack(X_folds[:i] + X_folds[i+1:])
        X_val = X_folds[i]
        y_train = hstack(y_folds[:i] + y_folds[i+1:])
        y_val = y_folds[i]
        #print (X_train.shape,X_val.shape,y_train.shape,y_val.shape)
        #print(y_val)
        for k in k_choices:
            accuracyCount = 0.0
            for i in range(X_val.shape[0]):
                y_val_pred = classify(X_val[i,:],X_train,y_train,k)
                if(y_val_pred == y_val[i]):
                    accuracyCount += 1.0
            #print("the total error rate is: %f,k =" %(errorCount/float(numVoVecs)),k)
            accuracy_of_k[k].append(accuracyCount/float(X_val.shape[0]))

    #for k in sorted(k_choices):
        #for accuracy in accuracy_of_k[k]:
            #Print ('k =% D, accuracy =% f '% (k, accuracy))
    print('-------------------------')
    a = {}
    for k in k_choices:
        a[k] = []
    for k,v in accuracy_of_k.items():
        a[k].append(mean(v))
        print('k = %d,Average accuracy:%f'%(k,mean(v)))
    b = sorted(a.items(),key=operator.itemgetter(1),reverse=True)
    print('Maximum accuracy%f At that time, k = %d'%(b[0][1][0],b[0][0]))

    for k in k_choices:
        plt.scatter([k]*len(accuracy_of_k[k]), accuracy_of_k[k])
    accuracies_mean = array([mean(v) for k,v in accuracy_of_k.items()])
    accuracies_std = array([std(v) for k,v in accuracy_of_k.items()])
    plt.errorbar(k_choices, accuracies_mean, yerr=accuracies_std)
    plt.title('cross volidate on K')
    plt.xlabel('K')
    plt.ylabel('cross-volidate accuracy')
    plt.show()

def datingClassTest():
    datingDataMat,datingLabels = file2matrix('datingTestSet2.txt')
    normMat,minVals,ranges = autoNorm(datingDataMat)
    X_train,X_test,y_train,y_test = train_test_split(normMat,datingLabels,test_size=0.2,random_state=2)
    errorCount = 0.0
    classifylist = []
    for i in range(X_test.shape[0]):
        classifierResult = classify(X_test[i,:],X_train,y_train,5)
        classifylist.append(classifierResult)
        #print("the classifier came back with: %d, the real answer is: %d" %(classifierResult,datingLabels[i]))
        if(classifierResult != y_test[i]):
            errorCount += 1.0
    print("Accuracy rate: %f," %(1-errorCount/float(X_test.shape[0])))
    #print(classifylist)
    #accuracy_s = accuracy_score(y_test, classifylist)
    precision_s = precision_score(y_test, classifylist,average='macro')  # Accuracy
    recall_s = recall_score(y_test, classifylist,average='macro')  # recall
    f1_s = f1_score(y_test, classifylist,average='macro')  # F1 score
    #print(accuracy_s)
    print("Accuracy: %f," %precision_s)
    print("recall: %f," %recall_s)
    print("F1 Score: %f," %f1_s)

def classifyPerson():
    resultList = ['People who don't like it','Charming people','Attractive people']
    Miles = float(input("Annual mileage:"))
    Time = float(input("Play time:"))
    IceCream = float(input("Ice cream consumption:"))
    datingDataMat,datingLabels = file2matrix('datingTestSet2.txt')
    normMat,minVals,ranges = autoNorm(datingDataMat)
    inArr = array([Miles,Time,IceCream])
    classifierResult = classify((inArr-minVals)/ranges,normMat,datingLabels,5)
    print("How much you like this person:",resultList[classifierResult - 1])

if __name__ == '__main__':
    corCoefficient()
    datingClassVolidate()
    datingClassTest()
    classifyPerson()
5. Result display
5.1 data preprocessing
As it is standard data, the data is directly analyzed after data import, and the following results are obtained:
Correlation coefficient of the first feature and label: - 0.41185004507209078
Correlation coefficient between the second feature and label: 0.3430459507835666
Correlation coefficient of the third feature and label: 0.025614191377917542
It can be seen that the first and second features are more important for classification results. Since only three features are used for training model, then analyze the correlation between features, and get the following figure:
By observing the data, we can see that there is a large difference between the values of each feature, so we first normalize it, and then train it later. We can see the code (def autoNorm(dataSet):) part
5.2 model training
Firstly, the data are randomly divided into 80% training set and 20% test set, so that the accuracy of the model can be verified later
Secondly, cross validation is carried out in 80% training set, and k=5 cross validation method is used to verify k value in KNN, and a better k value is obtained, as shown in the following figure: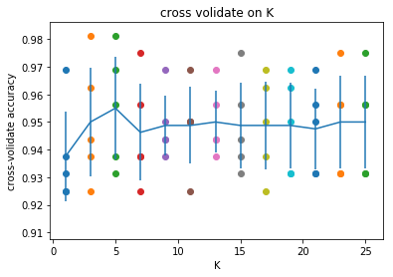
5.3 model test
Test with 20% of the test set obtained before, test the model by analyzing the accuracy, accuracy, recall and F1 values, and get the following values: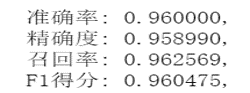
5.4 classified forecast
It can be predicted by running programs, such as input data (44000, 12, 0.5), and the prediction result is "attractive person"