1. What is kprobe lf
Kprobe LF is a high delay function location analysis tool based on kprobe and interrupt timer
Kprobe lf can locate and analyze most kernel functions. When the delay is set sufficiently, you can also observe the stack of normal delay functions
1.1 why kprobe lf
Because this tool has two important settings, one is degree and the other is FUNCTION, which is called LF for short
1.2 adaptation issues
At present, it has been tested on kernel 4.15.0, 5.4.54 and 5.13.0, and these versions can be adapted
2. How to use
git clone https://github.com/1978629634/kprobe_lf.git
cd kprobe_lf
bash start.sh -f [FUNCTION_NAME] -l [LATENCY_TIME]
After running the script, use ctrl + c to stop getting the log and generate the flame diagram
After the script starts, three files will be generated in the current directory
- lf.log is the stack before the function runs
- lf.svg is the flame diagram
- lf.graph is the original file of flame diagram
3. Why kprobe lf
3.1 find the culprit of high delay
Kprobe lf can locate the timeout function and make its running stack into a flame diagram
For example, when we encounter the problem of too long soft interrupt delay, we can set the function to__ do_softirq, set the delay to 1000us, positioning analysis timeout, soft interrupt
root@cluster1-worker1:~/kprobe_lf# bash start.sh -f __do_softirq -l 1000
FUNCTION: __do_softirq, LATENCY_TIME: 1000 us (>=100us)
find kprobe_lf.ko
insmod kprobe_lf.ko
save log to lf.log, ctrl + c to stop
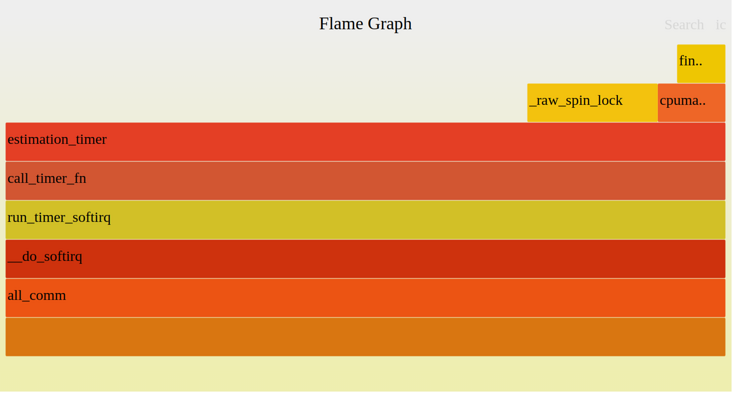
Get timeout__ do_ Flame diagram and timeout during softirq operation__ do_softirq pre run stack is as follows
Flame diagram during operation:
Pre run stack:
__do_softirq cpu:2 PID:0 COMMAND:swapper/2 LATENCY:5978us
     __do_softirq+0x1/0x2dc
     irq_exit+0xd5/0xe0
     smp_apic_timer_interrupt+0x74/0x130
     apic_timer_interrupt+0xf/0x20
     native_safe_halt+0xe/0x10
     default_idle+0x1c/0x140
     do_idle+0x1aa/0x250
     cpu_startup_entry+0x19/0x20
     start_secondary+0x162/0x1c0
     secondary_startup_64+0xa4/0xb0
...
Through LATENCY, we can know that the timeout soft interrupt delay is up to 6ms
From the flame diagram, we can see that all high delay soft interrupts are running estimation_timer(IPVS BUG)
We can locate the culprit function soon
3.2 kernel performance analysis
When we analyze the performance of the kernel, sometimes we want to analyze the impact of modifying a parameter on the performance of the kernel, so we can use this tool to analyze the related functions
Take the kernel parameter / proc/sys/net/ipv4/tcp_tw_reuse as an example
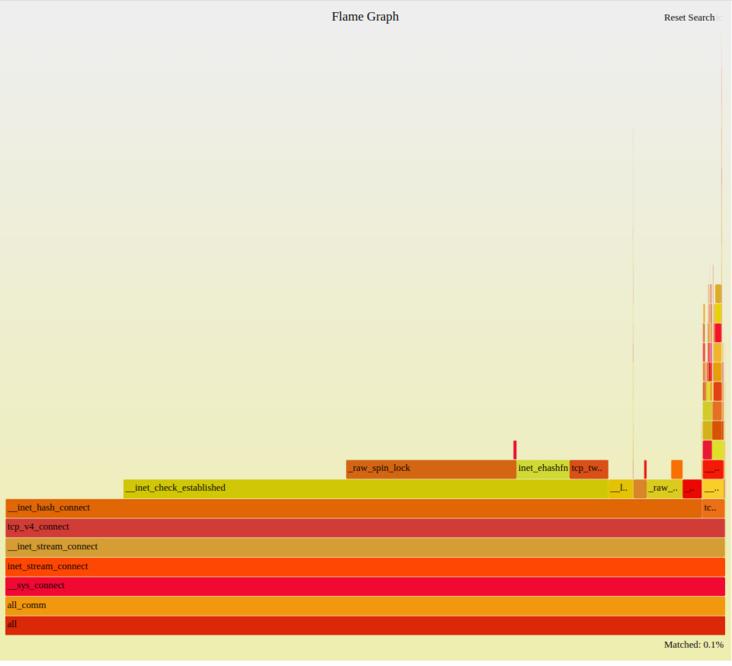
3.2.1 default setting tcp_tw_reuse = 2
Use curl to initiate highly concurrent short connections locally. Observe__ sys_connect function
# Simulate high concurrency
root@cluster1-worker1:~# while true;do curl xxxxxxx ;done
# Running tools
root@cluster1-worker1:~/kprobe_lf# bash start.sh -f __sys_connect -l 100
FUNCTION: __sys_connect, LATENCY_TIME: 100 us (>=100us)
find kprobe_lf.ko
insmod kprobe_lf.ko
save log to lf.log, ctrl + c to stop
Flame diagram during operation:
Pre run stack:
__sys_connect cpu:6 PID:26184 COMMAND:curl LATENCY:1781us
     __sys_connect+0x1/0xf0
     __x64_sys_connect+0x16/0x20
     do_syscall_64+0x5b/0x1b0
     entry_SYSCALL_64_after_hwframe+0x44/0xa9
...
You can see from the pre run stack__ sys_ The connect delay is 1.7ms
It can be seen from the flame diagram__ sys_ More than 90% of connect is consumed__ inet_hash_connect port selection function
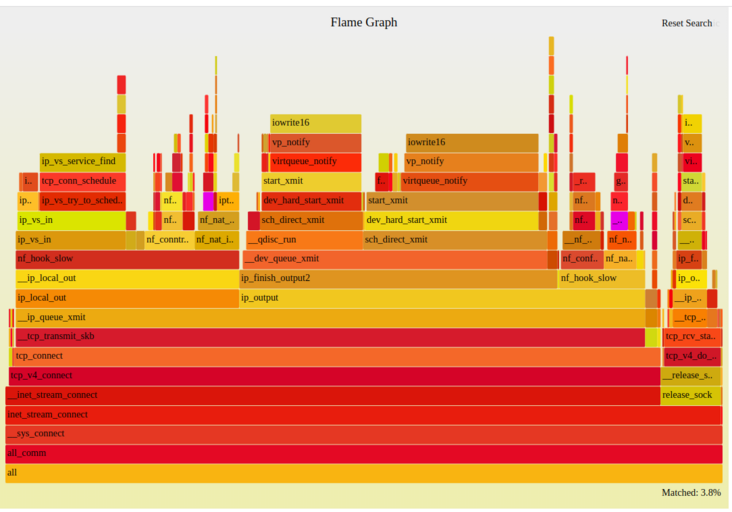
3.2.2 enable tcp_tw_reuse = 1
Use curl to initiate highly concurrent short connections locally. Observe__ sys_connect function
# Simulate high concurrency
root@cluster1-worker1:~# while true;do curl xxxxxxx ;done
# Running tools
root@cluster1-worker1:~/kprobe_lf# bash start.sh -f __sys_connect -l 100
FUNCTION: __sys_connect, LATENCY_TIME: 100 us (>=100us)
find kprobe_lf.ko
insmod kprobe_lf.ko
save log to lf.log, ctrl + c to stop
Flame diagram during operation:
Pre run stack:
__sys_connect cpu:26 PID:10538 COMMAND:curl LATENCY:101us
     __sys_connect+0x1/0xf0
     __x64_sys_connect+0x16/0x20
     do_syscall_64+0x5b/0x1b0
     entry_SYSCALL_64_after_hwframe+0x44/0xa9
...
You can see from the pre run stack__ sys_ The connect delay is 0.1ms
It can be seen from the flame diagram__ inet_ hash_ The proportion of connect port selection function is less than 1%
tcp_tw_reuse = 1 has obvious improvement effect on port selection
4. Description
Flame map making based on https://github.com/brendangregg/FlameGraph
This tool is inspired by the team trace irqoff tool