Log collection method
Log evolved from traditional way to container The process of the method will not be described in detail. You can refer to this article Docker log collection best practices , due to the characteristics of container drift and automatic scaling, log collection must be realized in a new way. The official methods given by Kubernetes are basically these three: native mode, daemon set mode and Sidecar mode.
1. Native mode: use kubectl logs to directly view the locally retained logs, or redirect the logs to file, syslog, fluent and other systems through the log driver of docker engine. 2. Daemon set mode: deploy log agent on each node of K8S, and the agent collects the logs of all containers to the server. 3.Sidecar mode: the log agent container of a sidecar running in a POD is used to collect the logs generated by the main container of the POD. The three methods have both advantages and disadvantages. No one can perfectly solve 100% of the problem, so it should be fitted according to the scene.
1, Native mode
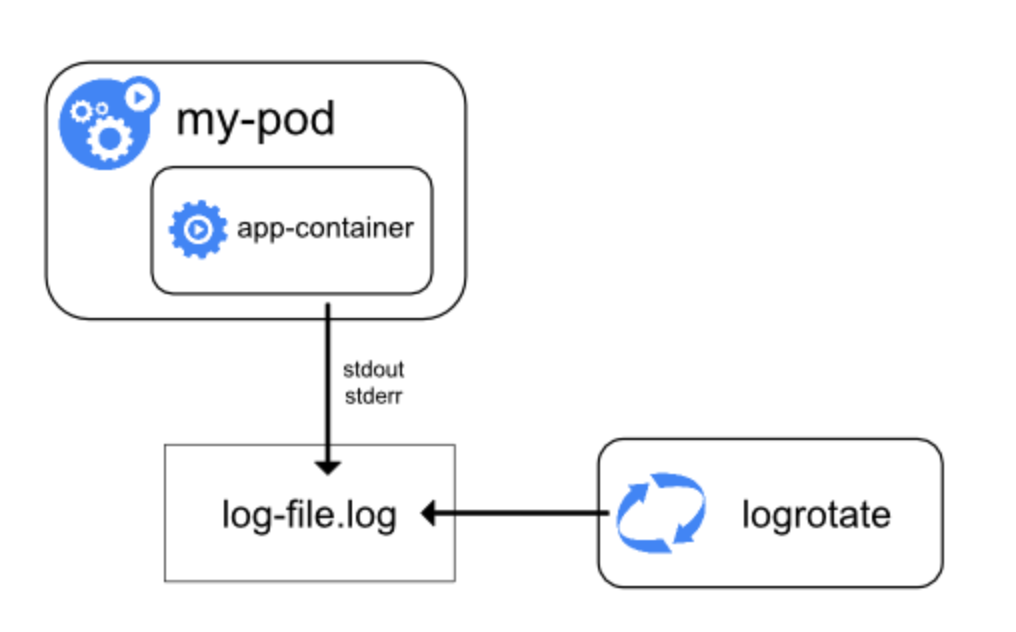
To put it simply, the native method is to directly use kubectl logs to view logs, or use the log driver to type docker logs into syslog, journal, etc., and then use commands to check. The best advantage of this method is simplicity and low resource occupancy. However, in the case of multiple containers and elastic scalability, log checking will be very difficult, Only for companies that are just beginning to study Kubernetes. However, the native mode is indeed the basis of the other two modes, because its two most basic concepts, daemon and sidecar mode, are based on these two modes.
1.1 console stdout mode
This method is the basis of the daemon method. Output all the logs to the console, and then docker starts journal. Then you can see the binary journal log under / var/log/journal. If you want to view the binary log, you can use journalctl to view the log: journalctl - U docker service -n 1 --no-pager -o json -o json-pretty
{
        "__CURSOR" : "s=113d7df2f5ff4d0985b08222b365c27a;i=1a5744e3;b=05e0fdf6d1814557939e52c0ac7ea76c;m=5cffae4cd4;t=58a452ca82da8;x=29bef852bcd70ae2",
        "__REALTIME_TIMESTAMP" : "1559404590149032",
        "__MONOTONIC_TIMESTAMP" : "399426604244",
        "_BOOT_ID" : "05e0fdf6d1814557939e52c0ac7ea76c",
        "PRIORITY" : "6",
        "CONTAINER_ID_FULL" : "f2108df841b1f72684713998c976db72665f353a3b4ea17cd06b5fc5f0b8ae27",
        "CONTAINER_NAME" : "k8s_controllers_master-controllers-dev4.gcloud.set_kube-system_dcab37be702c9ab6c2b17122c867c74a_1",
        "CONTAINER_TAG" : "f2108df841b1",
        "CONTAINER_ID" : "f2108df841b1",
        "_TRANSPORT" : "journal",
        "_PID" : "6418",
        "_UID" : "0",
        "_GID" : "0",
        "_COMM" : "dockerd-current",
        "_EXE" : "/usr/bin/dockerd-current",
        "_CMDLINE" : "/usr/bin/dockerd-current --add-runtime docker-runc=/usr/libexec/docker/docker-runc-current --default-runtime=docker-runc --exec-opt native.cgroupdriver=systemd --userland-proxy-path=/usr/libexec/docker/docker-proxy-current --init-path=/usr/libexec/docker/docker-init-current --seccomp-profile=/etc/docker/seccomp.json --selinux-enabled=false --log-driver=journald --insecure-registry hub.paas.kjtyun.com --insecure-registry hub.gcloud.lab --insecure-registry 172.30.0.0/16 --log-level=warn --signature-verification=false --max-concurrent-downloads=20 --max-concurrent-uploads=20 --storage-driver devicemapper --storage-opt dm.fs=xfs --storage-opt dm.thinpooldev=/dev/mapper/docker--vg-docker--pool --storage-opt dm.use_deferred_removal=true --storage-opt dm.use_deferred_deletion=true --mtu=1450",
        "_CAP_EFFECTIVE" : "1fffffffff",
        "_SYSTEMD_CGROUP" : "/system.slice/docker.service",
        "_SYSTEMD_UNIT" : "docker.service",
        "_SYSTEMD_SLICE" : "system.slice",
        "_MACHINE_ID" : "225adcce13bd233a56ab481df7413e0b",
        "_HOSTNAME" : "dev4.gcloud.set",
        "MESSAGE" : "I0601 23:56:30.148153       1 event.go:221] Event(v1.ObjectReference{Kind:\"DaemonSet\", Namespace:\"openshift-monitoring\", Name:\"node-exporter\", UID:\"f6d2bdc1-6658-11e9-aca2-fa163e938959\", APIVersion:\"apps/v1\", ResourceVersion:\"15378688\", FieldPath:\"\"}): type: 'Normal' reason: 'SuccessfulCreate' Created pod: node-exporter-hvrpf",
        "_SOURCE_REALTIME_TIMESTAMP" : "1559404590148488"
}
In the json above_ CMDLINE and other fields occupy a large amount, and these are meaningless, which will lead to a short log being encapsulated into dozens of times more. Therefore, in the case of a large number of logs, it is best to customize the fields, which can be reduced. The field we usually need is CONTAINER_NAME and MESSAGE via CONTAINER_NAME can get the namespace and podName of Kubernetes, such as CONTAINER_NAME is k8s_ controllers_ master-controllers-dev4. gcloud. set_ kube-system_ dcab37be702c9ab6c2b17122c867c74a_ At 1 container name in pod: controllers pod name: master-controllers-dev4.gcloud.set namespace: kube-system pod uid: dcab37be702c9ab6c2b17122c867c74a_1
1.2 new version of subPathExpr
The journal method is a relatively standard method. If the hostPath method is adopted, the log can be directly output here. The only disadvantage of this method is that the podName cannot be obtained in the old Kubernetes, but the latest version of Kubernetes 1 Some of the features of subPathExpr 14 are that you can write the podName into the directory when you mount the directory, but this feature is still an alpha version and should be used with caution. Simply put, the implementation principle is as follows: the log directory filled in the container is attached to / data / logs / namespace / service of the host machine_ name/$(PodName)/xxx. Log, if it is in sidecar mode, the changed directory will be attached to the collection directory of sidecar for push. If the host installs the fluent D mode, you need to write matching code to recognize namespace and service_name, podname, etc., and then send them to the log system.
Refer to: https://github.com/kubernetes/enhancements/blob/master/keps/sig-storage/20181029-volume-subpath-env-expansion.md Log drop reference details:
This code is by Java Architect must see network-Structure Sorting
    env:
    - name: POD_NAME
      valueFrom:
        fieldRef:
          apiVersion: v1
          fieldPath: metadata.name
   ...
    volumeMounts:
    - name: workdir1
      mountPath: /logs
      subPathExpr: $(POD_NAME)
We mainly use the main container in Pod to mount a fluent agent collector to collect logs. We modify the source code of kubernetes client to support subPathExpr, and then send it to kafka of the log system. This method can handle the collection of multiple logs. For example, the logs of the business party are sent to the console, but the logs of the jvm cannot be sent to the console at the same time, otherwise confusion will occur. Therefore, this method can be used if the business logs can be attached to the host machine and some other logs, such as the logs of the jvm, can be attached to the container at the same time.
{
    "_fileName":"/data/work/logs/epaas_2019-05-22-0.log",
    "_sortedId":"660c2ce8-aacc-42c4-80d1-d3f6d4c071ea",
    "_collectTime":"2019-05-22 17:23:58",
    "_log":"[33m2019-05-22 17:23:58[0;39m |[34mINFO [0;39m |[34mmain[0;39m |[34mSpringApplication.java:679[0;39m |[32mcom.hqyg.epaas.EpaasPortalApplication[0;39m | The following profiles are active: dev",
    "_domain":"rongqiyun-dev",
    "_podName":"aofjweojo-5679849765-gncbf",
    "_hostName":"dev4.gcloud.set"
}
2, Daemonset mode
The daemonset method is also based on Journal. The log is transformed into binary log by using the log driver of journal, and then a log collection agent is deployed on each node node to mount the log of / var/log/journal for analysis, and then send it to kafka or es. If the number of logs is large, the pressure on ES is too great, so, We choose to push the log to kafka. Fluent is widely used in container log collection, which requires less resources and high performance. It is the most mature log collection scheme at present. Unfortunately, it is written in ruby. Ordinary people don't have time to talk, learn this and then customize it. Fortunately, openshift provides origin-aggregated-logging Programme. We can use fluent Conf to see what the origin aggregated logging has done, remove the comments and blank things, and then I modify them slightly according to my own situation. The results are as follows:
This code is by Java Architect must see network-Structure Sorting
@include configs.d/openshift/system.conf
 set up fluent Log level of
@include configs.d/openshift/input-pre-*.conf
 The most important place to read journal Log of
@include configs.d/dynamic/input-syslog-*.conf
 read syslog,Operation log
<label @INGRESS>
  @include configs.d/openshift/filter-retag-journal.conf
  Match
  @include configs.d/openshift/filter-k8s-meta.conf
  obtain Kubernetes Information about
  @include configs.d/openshift/filter-viaq-data-model.conf
  Define the model
  @include configs.d/openshift/filter-post-*.conf
  generate es Index of id
  @include configs.d/openshift/filter-k8s-record-transform.conf
  To modify the log record, we customized the fields here and removed the unnecessary fields
  @include configs.d/openshift/output-applications.conf
  Output, default is es,If you want to use other, such as kafka,It needs to be customized
</label>
Of course, the details are not so easy to understand. Instead, it is understood step by step as follows:
1. Parse journal log Origin aggregated logging will the container in the binary journal log_ Name is parsed and the field is disassembled according to the matching rules
    "kubernetes": {
      "container_name": "fas-dataservice-dev-new",
      "namespace_name": "fas-cost-dev",
      "pod_name": "fas-dataservice-dev-new-5c48d7c967-kb79l",
      "pod_id": "4ad125bb7558f52e30dceb3c5e88dc7bc160980527356f791f78ffcaa6d1611c",
      "namespace_id": "f95238a6-3a67-11e9-a211-20040fe7b690"
    }
2. es packaging Elasticsearch is mainly used_ genid_ Ext plug-in, written in filter post gene Conf.
3. Log classification Collect journal logs through origin aggregated logging, and then push them to es. Origin aggregated logging has made many optimizations in the push process, that is, it is suitable for high ops, waiting queue, push retry, etc. you can see the details.
In addition, logs are classified into three types: (1). The operation log (matched with. Operations in es) records the operations on Kubernetes (2). Project log (matched with project in es), business log and the most important log collection (3). Orphan logs (matched with. orphaned. * in es) will be typed here if there is no namespace
4. Log field customization A log collected after being pushed to by origin aggregated logging is as follows:
{
    "CONTAINER_TAG": "4ad125bb7558",
    "docker": {
      "container_id": "4ad125bb7558f52e30dceb3c5e88dc7bc160980527356f791f78ffcaa6d1611c"
    },
    "kubernetes": {
      "container_name": "fas-dataservice-dev-new",
      "namespace_name": "fas-cost-dev",
      "pod_name": "fas-dataservice-dev-new-5c48d7c967-kb79l",
      "pod_id": "4ad125bb7558f52e30dceb3c5e88dc7bc160980527356f791f78ffcaa6d1611c",
      "namespace_id": "f95238a6-3a67-11e9-a211-20040fe7b690"
    },
    "systemd": {
      "t": {
        "BOOT_ID": "6246327d7ea441339d6d14b44498b177",
        "CAP_EFFECTIVE": "1fffffffff",
        "CMDLINE": "/usr/bin/dockerd-current --add-runtime docker-runc=/usr/libexec/docker/docker-runc-current --default-runtime=docker-runc --exec-opt native.cgroupdriver=systemd --userland-proxy-path=/usr/libexec/docker/docker-proxy-current --init-path=/usr/libexec/docker/docker-init-current --seccomp-profile=/etc/docker/seccomp.json --selinux-enabled=false --log-driver=journald --insecure-registry hub.paas.kjtyun.com --insecure-registry 10.77.0.0/16 --log-level=warn --signature-verification=false --bridge=none --max-concurrent-downloads=20 --max-concurrent-uploads=20 --storage-driver devicemapper --storage-opt dm.fs=xfs --storage-opt dm.thinpooldev=/dev/mapper/docker--vg-docker--pool --storage-opt dm.use_deferred_removal=true --storage-opt dm.use_deferred_deletion=true --mtu=1450",
        "COMM": "dockerd-current",
        "EXE": "/usr/bin/dockerd-current",
        "GID": "0",
        "MACHINE_ID": "0096083eb4204215a24efd202176f3ec",
        "PID": "17181",
        "SYSTEMD_CGROUP": "/system.slice/docker.service",
        "SYSTEMD_SLICE": "system.slice",
        "SYSTEMD_UNIT": "docker.service",
        "TRANSPORT": "journal",
        "UID": "0"
      }
    },
    "level": "info",
    "message": "\tat com.sun.proxy.$Proxy242.execute(Unknown Source)",
    "hostname": "host11.rqy.kx",
    "pipeline_metadata": {
      "collector": {
        "ipaddr4": "10.76.232.16",
        "ipaddr6": "fe80::a813:abff:fe66:3b0c",
        "inputname": "fluent-plugin-systemd",
        "name": "fluentd",
        "received_at": "2019-05-15T09:22:39.297151+00:00",
        "version": "0.12.43 1.6.0"
      }
    },
    "@timestamp": "2019-05-06T01:41:01.960000+00:00",
    "viaq_msg_id": "NjllNmI1ZWQtZGUyMi00NDdkLWEyNzEtMTY3MDQ0ZjEyZjZh"
  }
It can be seen that, similar to the original journal log, several fields have been added to write into the es. Generally speaking, other fields are not so important, so we customized the fields to reduce the size of the log. After customizing the fields, the output of a section of journal becomes (not the same section, just an example):
{
    "hostname":"dev18.gcloud.set",
    "@timestamp":"2019-05-17T04:22:33.139608+00:00",
    "pod_name":"istio-pilot-8588fcb99f-rqtkd",
    "appName":"discovery",
    "container_name":"epaas-discovery",
    "domain":"istio-system",
    "sortedId":"NjA3ODVhODMtZDMyYy00ZWMyLWE4NjktZjcwZDMwMjNkYjQ3",
    "log":"spiffluster.local/ns/istio-system/sa/istio-galley-service-account"
}
5. Deployment Finally, add the tag of logging infra fluent: "true" on the node node, and you can see the collector of the node in the namespace of openshift logging.
logging-fluentd-29p8z              1/1       Running   0          6d
logging-fluentd-bpkjt              1/1       Running   0          6d
logging-fluentd-br9z5              1/1       Running   0          6d
logging-fluentd-dkb24              1/1       Running   1          5d
logging-fluentd-lbvbw              1/1       Running   0          6d
logging-fluentd-nxmk9              1/1       Running   1          5d
6. About ip The business side not only wants the podName, but also needs the IP. The console mode normally does not record the IP, so this is a difficulty among the difficulties. We are at kubernetes_metadata_ common. Kubernetes of RB_ 'pod' added to metadata_ ip' => pod_ Object ['status'] ['podip '], in the end, some have IP and some have no IP. We will continue to investigate this problem.
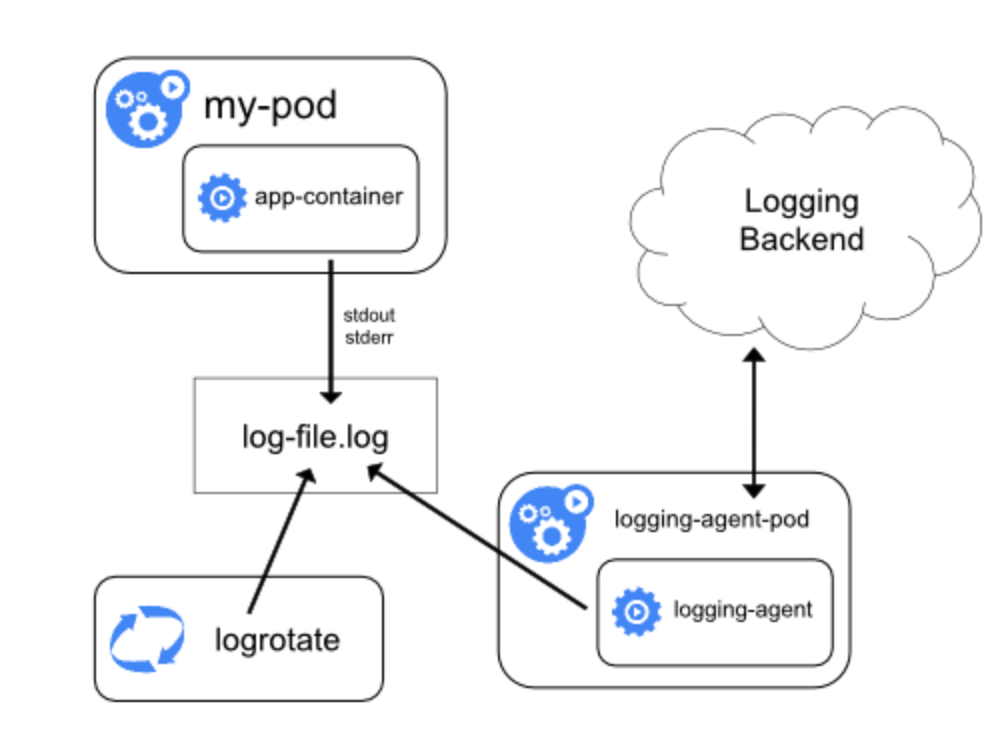
3, Sidecar mode
The advantage of this method is that it can obtain the file name of the log and the ip address of the container, and has high configurability. It can well carry out a series of customized operations, such as using log pilot or filebeat or other collectors. It can also customize some specific fields, such as file name, ip address, etc. If sidecar mode is used to solve the problem of log collection, you need to mount the log directory to the directory of the host machine, and then mount it to the directory of the collection agent to achieve the purpose of file sharing. By default, EmptyDir is used to achieve the purpose of file sharing. Here is a brief introduction to the role of EmptyDir. The volume of EmptyDir type is created when the pod is scheduled to a host, and the containers in the same pod can read and write the same file in EmptyDir. Once the pod leaves the host, the data in EmptyDir will be permanently deleted. Therefore, at present, the volume of EmptyDir type is mainly used as temporary space, such as the temporary directory required by the Web server to write logs or tmp files. If the log is lost, the impact on the business will be immeasurable. Therefore, we use the immature subPathExpr to implement it, that is, mount it to the host's fixed directory / data/logs, then namespace, deploymentName, podName, and then log files. The composite is / data/logs/{namespace}/{deploymentName}/
apiVersion: extensions/v1beta1
kind: Deployment
metadata:
  name: xxxx
  namespace: element-dev
spec:
  template:
    spec:
      volumes:
        - name: host-log-path-0
          hostPath:
            path: /data/logs/element-dev/xxxx
            type: DirectoryOrCreate
      containers:
        - name: xxxx
          image: 'xxxxxxx'
          volumeMounts:
            - name: host-log-path-0
              mountPath: /data/work/logs/
              subPathExpr: $(POD_NAME)
        - name: xxxx-elog-agent
          image: 'agent'
          volumeMounts:
            - name: host-log-path-0
              mountPath: /data/work/logs/
              subPathExpr: $(POD_NAME)
fluent. The configuration file of conf will not be posted due to confidentiality. A piece of data collected is as follows:
{
    "_fileName":"/data/work/logs/xxx_2019-05-22-0.log",
    "_sortedId":"660c2ce8-aacc-42c4-80d1-d3f6d4c071ea",
    "_collectTime":"2019-05-22 17:23:58",
    "_log":"[33m2019-05-22 17:23:58[0;39m |[34mINFO [0;39m |[34mmain[0;39m |[34mSpringApplication.java:679[0;39m |[32mcom.hqyg.epaas.EpaasPortalApplication[0;39m | The following profiles are active: dev",
    "_domain":"namespace",
    "_ip":"10.128.93.31",
    "_podName":"xxxx-5679849765-gncbf",
    "_hostName":"dev4.gcloud.set"
}
4, Summary
Generally speaking, the daemon method is relatively simple and more suitable for microservicing. Of course, it is not perfect. For example, the business party wants to print the business log to the console, but also wants to know the jvm log. In this case, the sidecar mode may be better. However, sidecar also has some imperfections. There must be an agent for log collection in each pod, which is too resource consuming, and many problems are difficult to solve. For example, if the main container hangs up and the agent hasn't finished collecting, kill it, how to deal with the log at this time, and whether the business will be affected by the short process of killing to start a new one. The mode provided by the user is the preferred mode, so we let the user choose the mode of sidecar.
reference resources: 1.Kubernetes log official document 2.Introduction to Sidecar mode of Kubernetes log collection 3.Docker log collection best practices