Introduction: This paper will introduce how to collect and query and analyze Kubernetes (hereinafter referred to as K8s) logs based on log service. In addition, a brief introduction to Ingress and Audit schemes is attached. In order to facilitate you to deepen your understanding through operation, this paper provides detailed operation steps, corresponding screenshots and configuration code.
Author: Bao Ze

For image download, domain name resolution and time synchronization, please click Alibaba open source mirror station
preparation
In order to complete the subsequent related operations, we need to prepare a K8s cluster. The operation steps are as follows:
- land Container service console.
- Create a standard hosting cluster (Hangzhou area), and check [expose API Server using EIP] and [use log service] in the wizard.
- After the cluster is created, return to the cluster list page and click more - > Manage clusters through CloudShell.
- Enter "kubectl get DS - n Kube system" in CloudShell, and the "logtail DS" displayed in the result is the log service component installed to realize data collection.
- open Log service console , you can see that the project corresponding to the K8s cluster ID has also been created.
The operation screenshot is as follows:
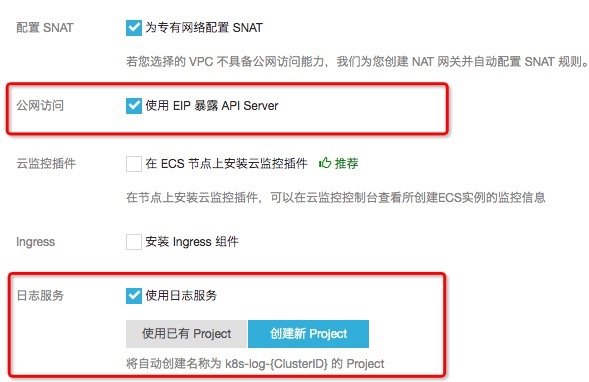
Figure: creating a managed cluster (step 2)
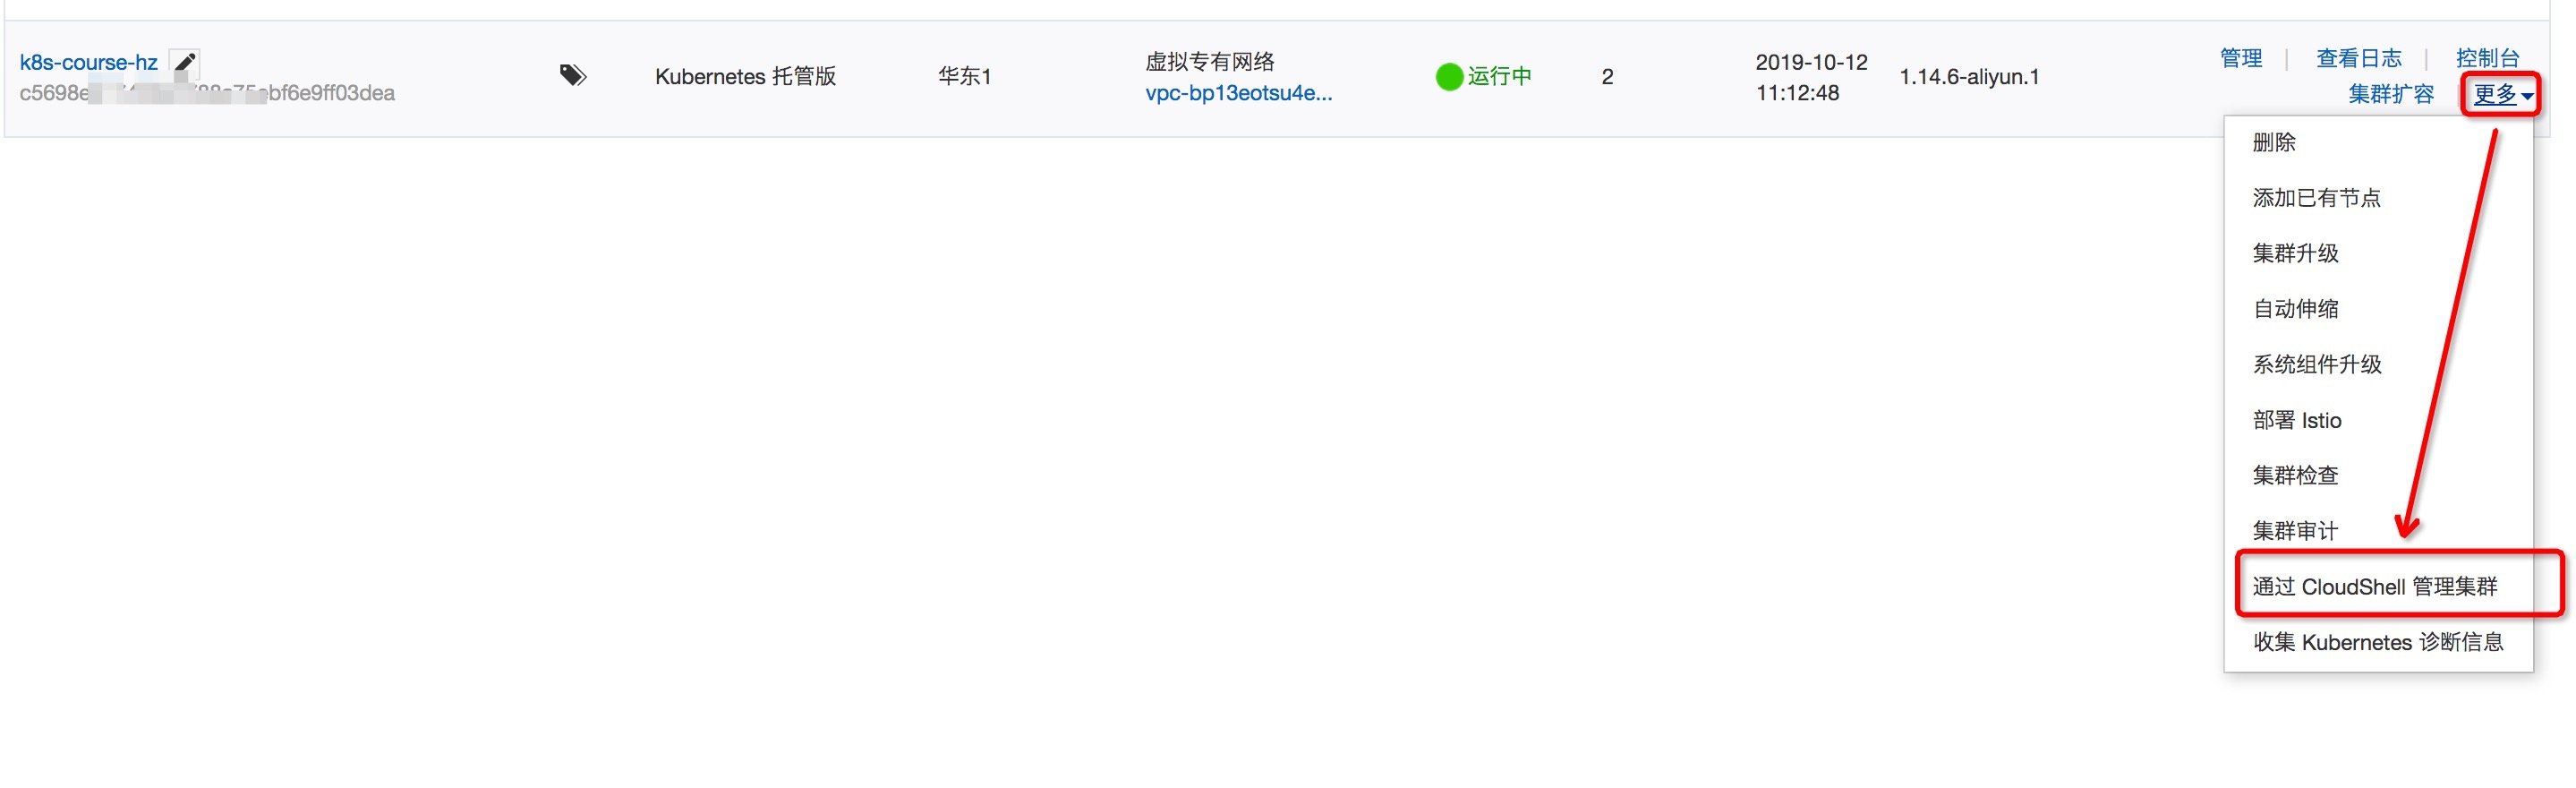
Figure: opening CloudShell (step 3)
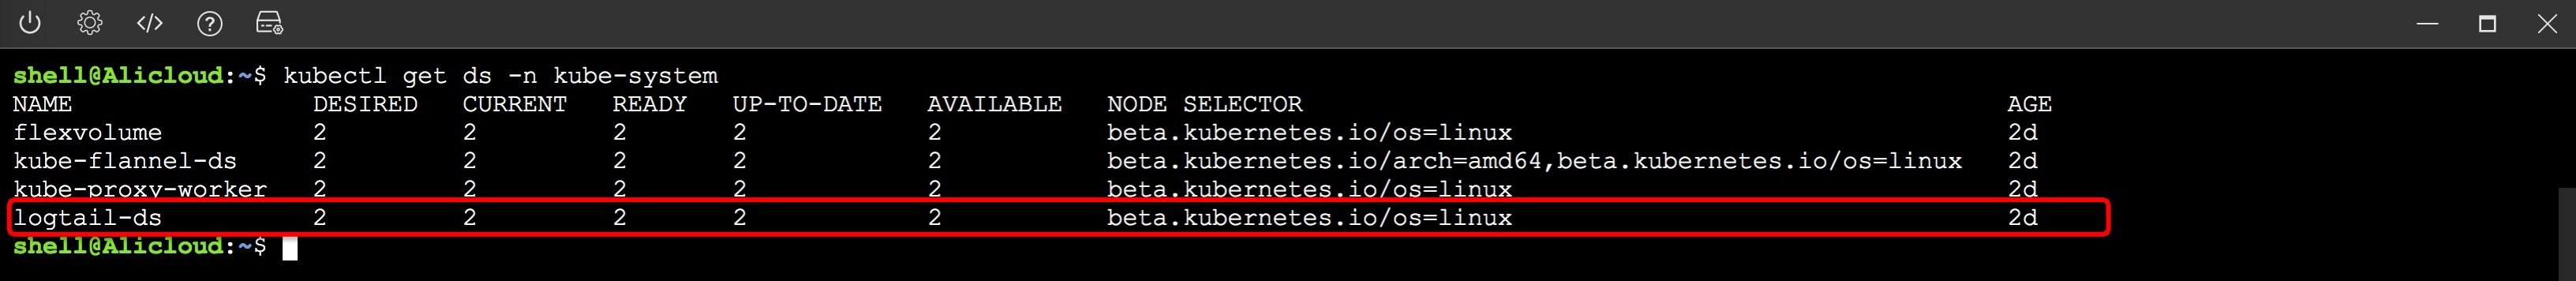
Figure: viewing log service component in CloudShell (step 4)
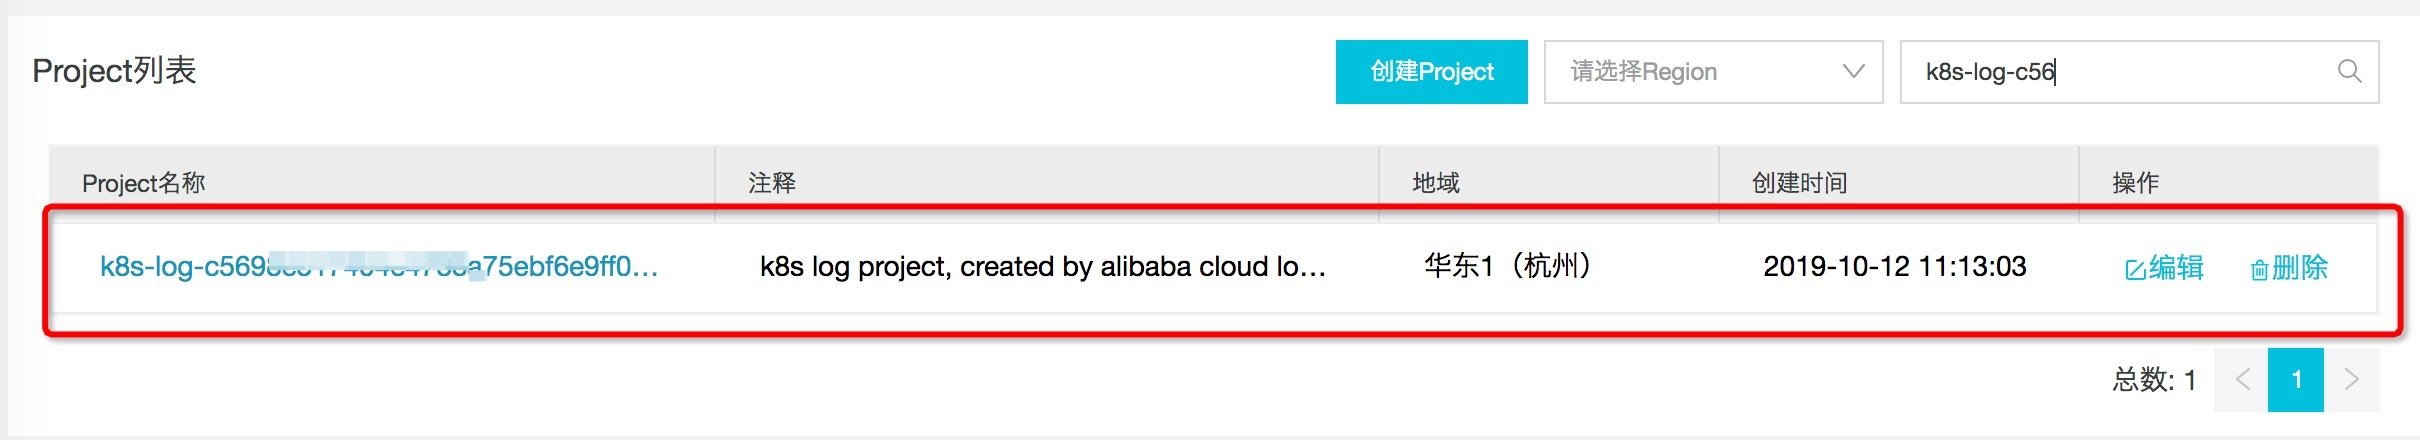
Figure: open the log service console to view the project (step 5)
1. Data collection
In K8s environment, container log data is generally divided into two types: container standard output and text file in container. The former is a unique log existence form of container, and the latter is similar to the traditional text file log, but the files are stored in each container and isolated from each other. Next, we will introduce how to collect these two types of logs.
1.1. Mock data
We will use the following two YAML files to generate mock data in two forms: standard output and in container files.
Container standard output
# Create two pod s to generate mock data
apiVersion: batch/v1
kind: Job
metadata:
  name: nginx-stdout-log-demo-1
  namespace: nginx-stdout
spec:
  template:
    metadata:
      name: nginx-stdout-log-demo-1
    spec:
      containers:
      - name: nginx-stdout-log-demo-1
        image: registry.cn-hangzhou.aliyuncs.com/log-service/docker-log-test:latest
        command: ["/bin/mock_log"]
        args: ["--stderr=false", "--stdout=true", "--log-type=nginx", "--total-count=100000000", "--logs-per-sec=5"]
      restartPolicy: Never
---
apiVersion: batch/v1
kind: Job
metadata:
  name: nginx-stdout-log-demo-2
  namespace: nginx-stdout
spec:
  template:
    metadata:
      name: nginx-stdout-log-demo-2
    spec:
      containers:
      - name: nginx-stdout-log-demo-2
        image: registry.cn-hangzhou.aliyuncs.com/log-service/docker-log-test:latest
        command: ["/bin/mock_log"]
        args: ["--stderr=false", "--stdout=true", "--log-type=nginx", "--total-count=100000000", "--logs-per-sec=5"]
      restartPolicy: Never
Text file in container (/ var/log/access.log)
apiVersion: batch/v1
kind: Job
metadata:
  name: nginx-file-log-demo
  namespace: nginx-file
spec:
  template:
    metadata:
      name: nginx-file-log-demo
    spec:
      restartPolicy: Never
      containers:
      - name: nginx-file-log-demo
        image: registry.cn-hangzhou.aliyuncs.com/log-service/docker-log-test:latest
        command: ["/bin/mock_log"]
        args: ["--log-type=nginx", "--stdout=false", "--stderr=false", "--path=/var/log/access.log", "--total-count=100000000", "--logs-per-sec=5"]
Operation steps:
- Open CloudShell and refer to step 3 in preparation.
- Apply the two yamls mentioned above in the cluster( Github).
- Execute kubectl get pods to view several pods responsible for generating logs.
-
View the generation log of two pods (replace the pod name in the command according to the actual situation)
- Standard output: execute kubectl logs - N nginx stdout -- tail = 10 nginx stdout log demo-1-7kvwx.
- File in container: execute kubectl exec - N nginx file nginx file log demo-7frsp -- bash - C "tail / var / log / access. Log".
$ kubectl create namespace nginx-stdout
$ kubectl create -f https://raw.githubusercontent.com/goclis/kubernetes-mock-log/master/pod_nginx_stdout.yaml
$ kubectl create namespace nginx-file
$ kubectl create -f https://raw.githubusercontent.com/goclis/kubernetes-mock-log/master/pod_nginx_file.yaml
Command: generate mock data (step 2)
$ kubectl get pods -A
NAMESPACE      NAME                                               READY   STATUS    RESTARTS   AGE
nginx-file     nginx-file-log-demo-7frsp                          1/1     Running   0          2m9s
nginx-stdout   nginx-stdout-log-demo-1-7kvwx                      1/1     Running   0          2m12s
nginx-stdout   nginx-stdout-log-demo-2-4x7vw                      1/1     Running   0          2m12s
Command: view log service component (step 3)
1.2. Acquisition standard output
Operation steps:
- land Log service console , click to enter the project corresponding to the cluster ID.
- Create a logstore to store standard output logs, such as k8s-stdout.
- Add a Logtail configuration in logstore with the type of Docker standard output. Select the machine group with the prefix k8s group in the existing machine group.
- On the data source setting page, fill in [configuration name] and [plug-in configuration].
The operation screenshot is as follows:
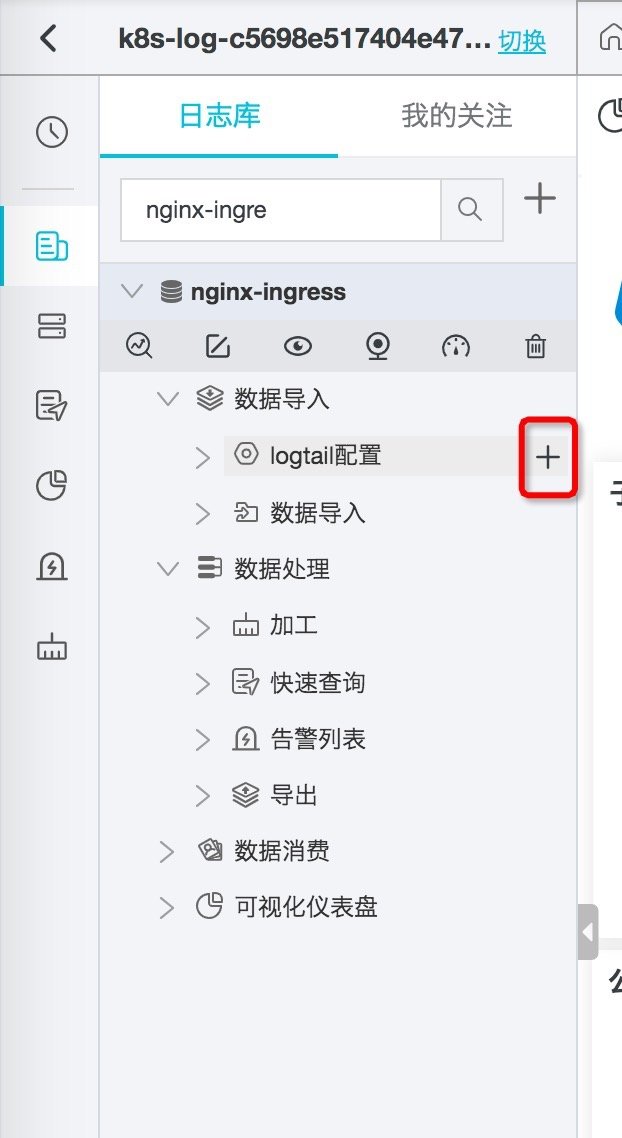
Figure: creating Logtail collection configuration
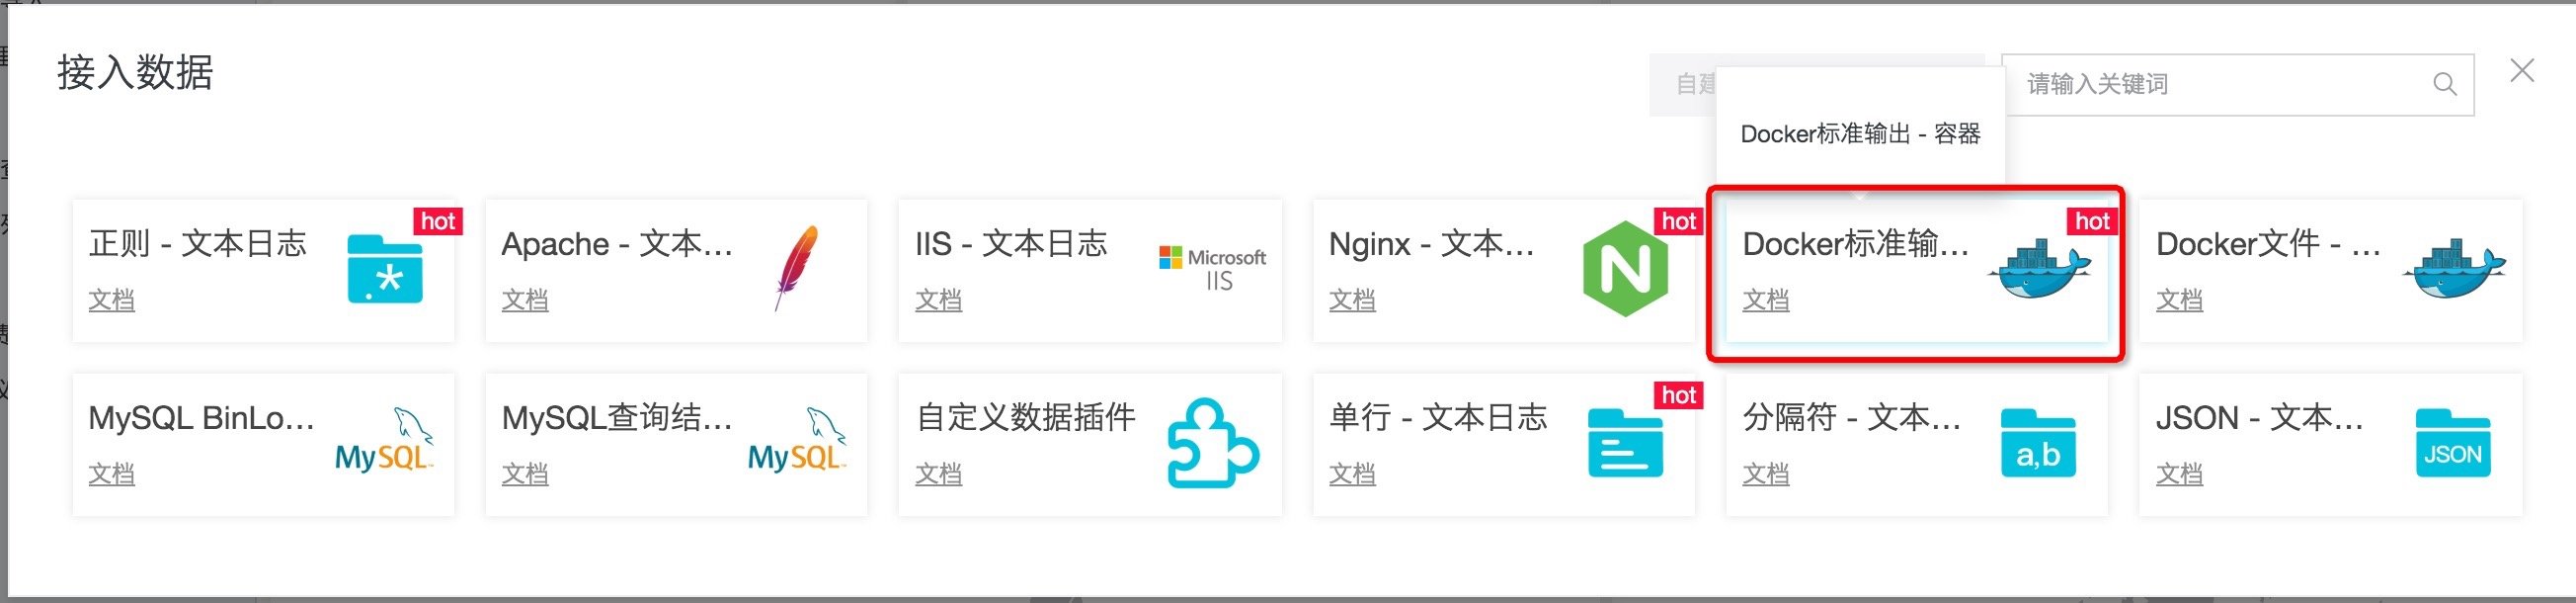
Figure: selecting Docker standard output configuration
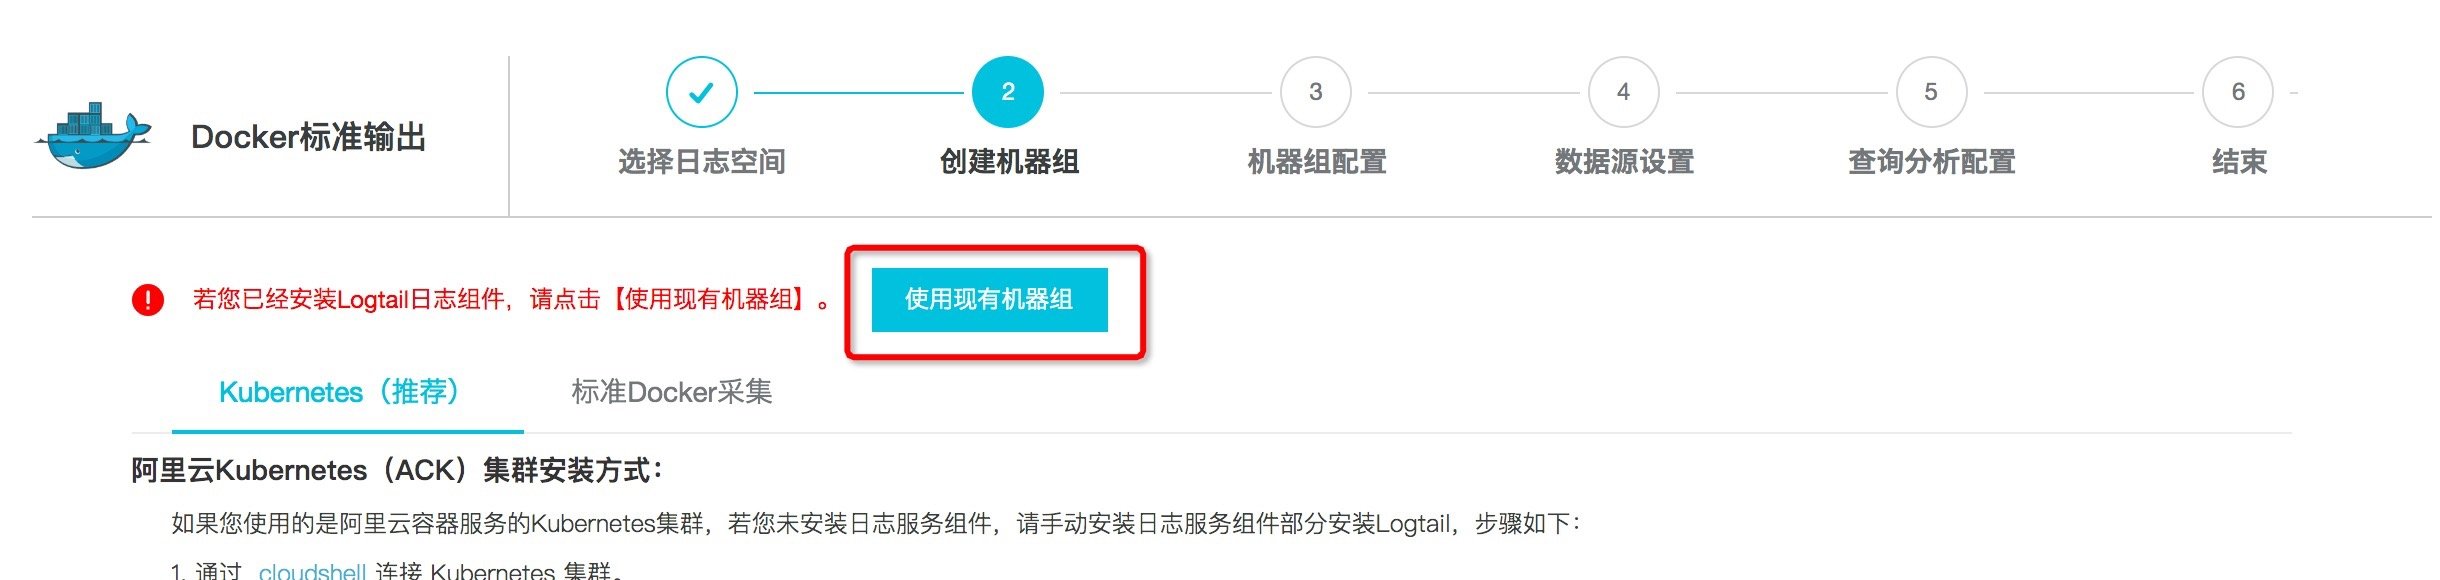
Image: selecting an existing machine group
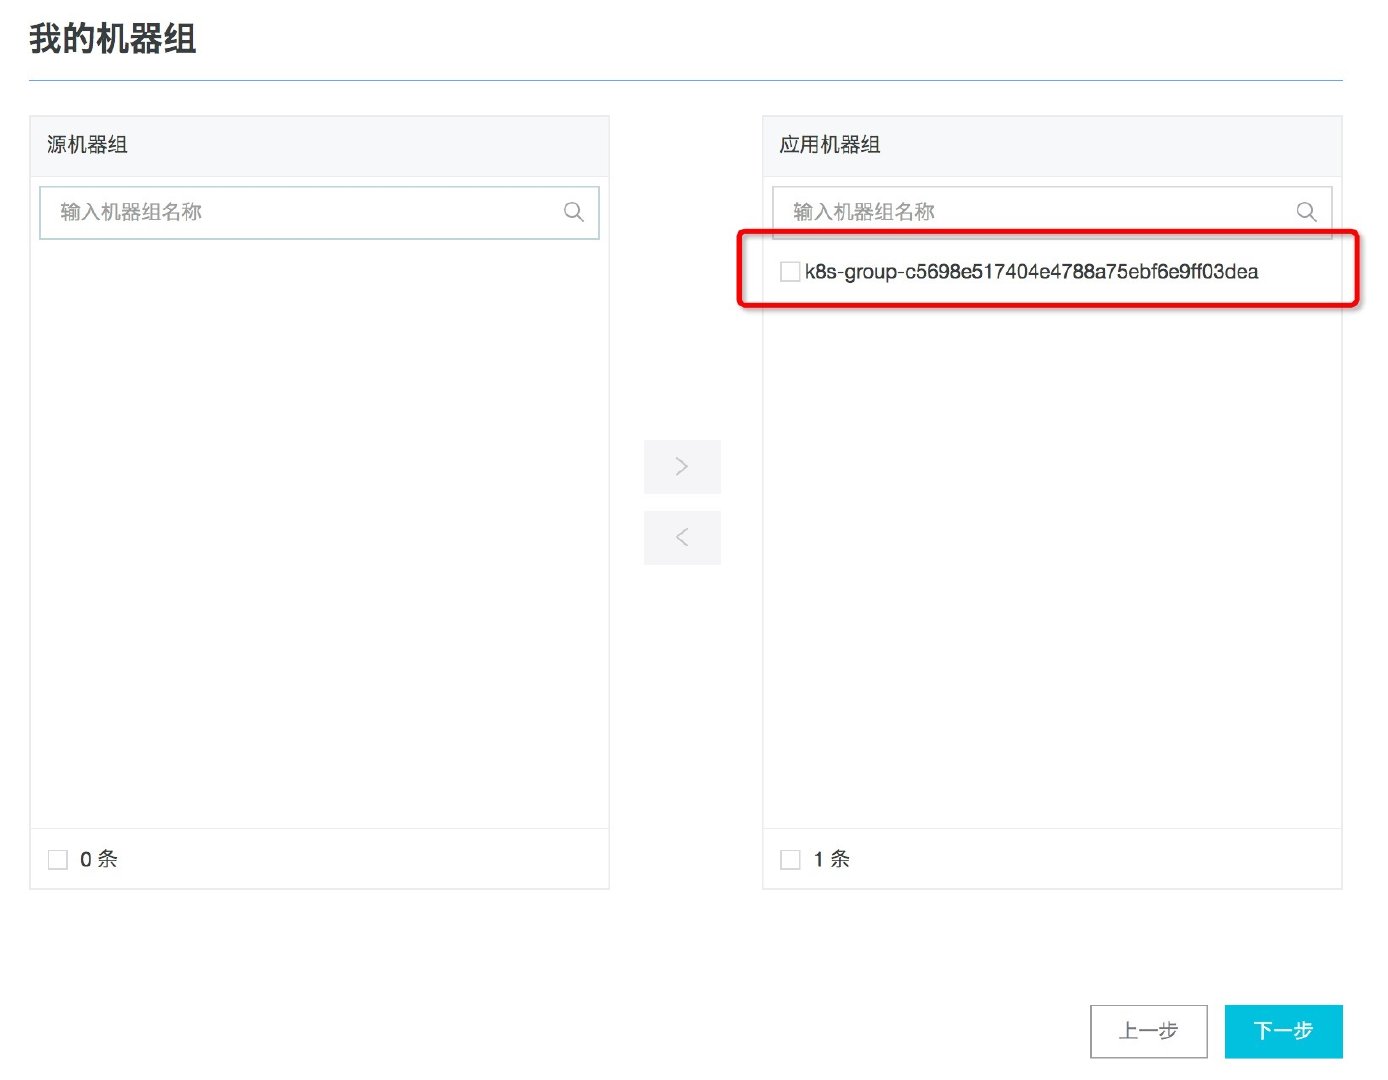
Figure: selecting a machine group starting with k8s group
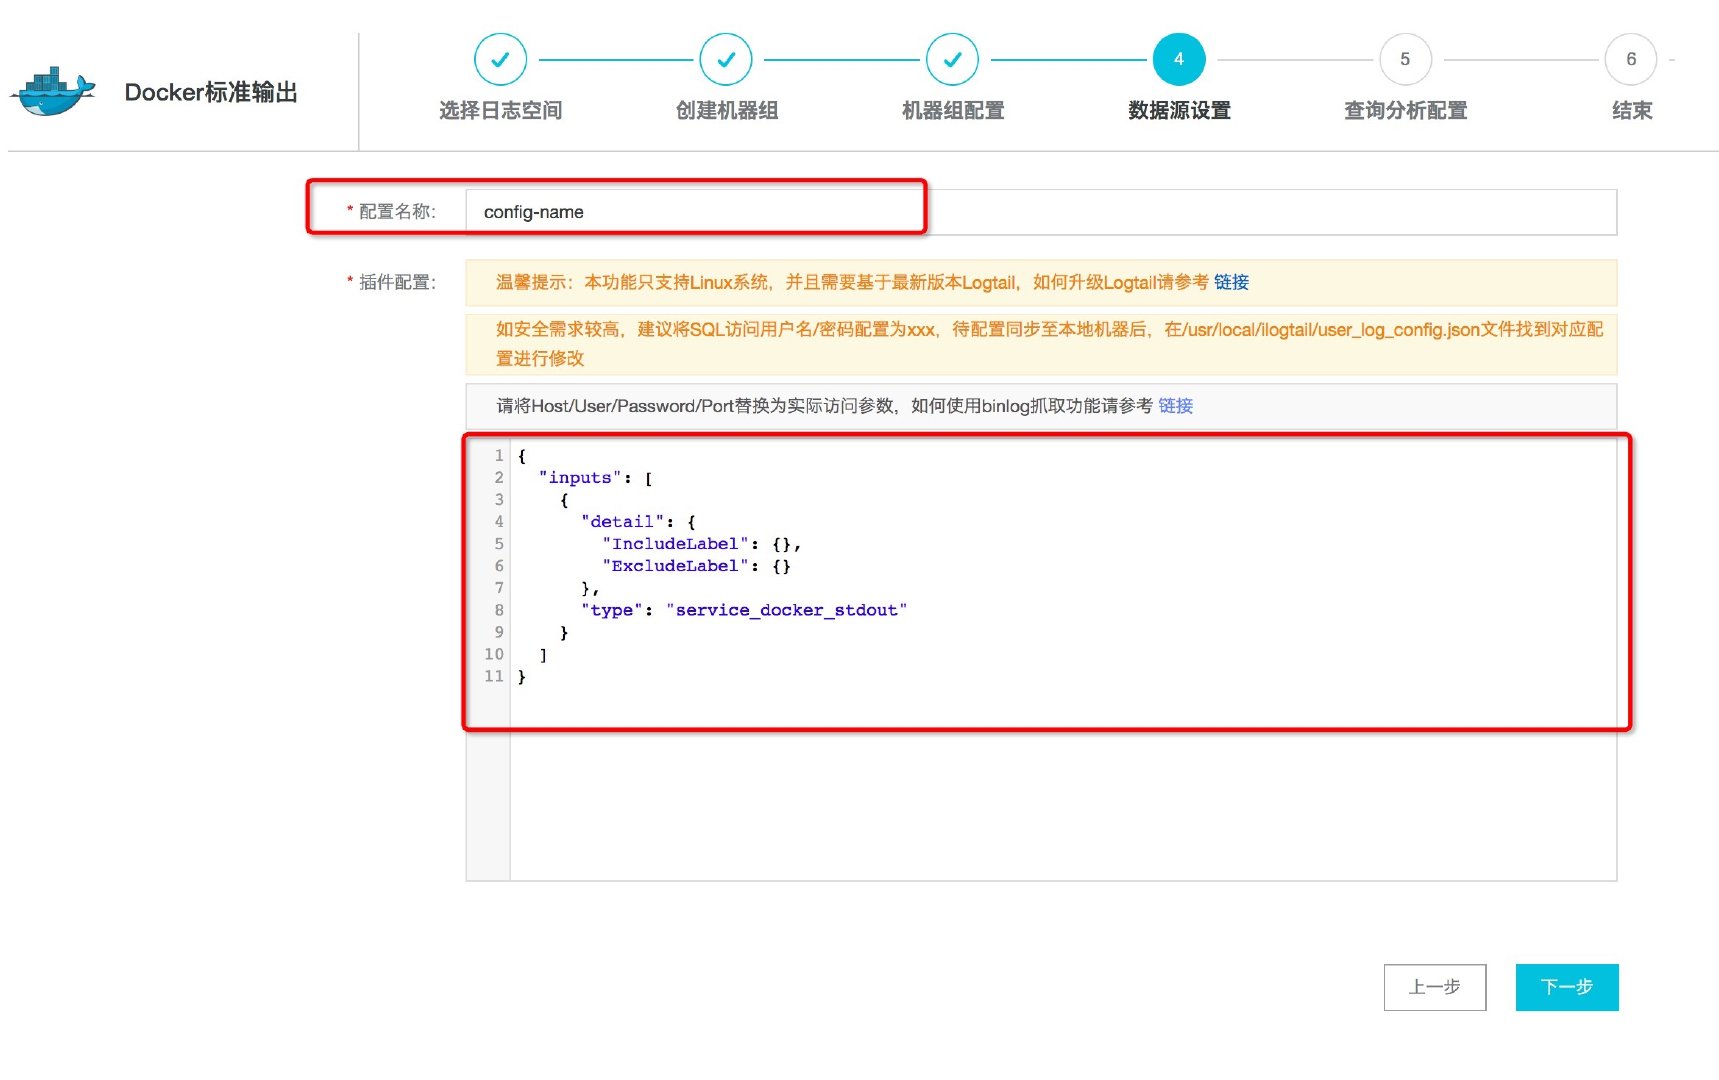
Figure: filling in Docker standard output collection configuration
The following are two optional acquisition configurations (use IncludeLabel to collect data in two namespace s respectively, reference resources):
Configuration: collect namespace nginx stdout
{
    "inputs": [
        {
            "detail": {
                "IncludeLabel": {
                    "io.kubernetes.pod.namespace": "nginx-stdout"
                },
                "ExcludeLabel": {}
            },
            "type": "service_docker_stdout"
        }
    ]
}
Configuration: collect namespace Kube system
{
    "inputs": [
        {
            "detail": {
                "IncludeLabel": {
                    "io.kubernetes.pod.namespace": "kube-system"
                },
                "ExcludeLabel": {}
            },
            "type": "service_docker_stdout"
        }
    ]
}
1.3. Collect files in container
Operation steps:
- land Log service console , click to enter the project corresponding to the cluster ID.
- Create a logstore to store the log files in the container, such as nginx file.
- Add a Logtail configuration in logstore with the type of Docker file. Select the machine group with the prefix k8s group in the existing machine group.
- On the [data source setting] page, fill in [configuration name] and specific configuration information (path of acquisition file, Label, etc.), for example, / var / log / access log.
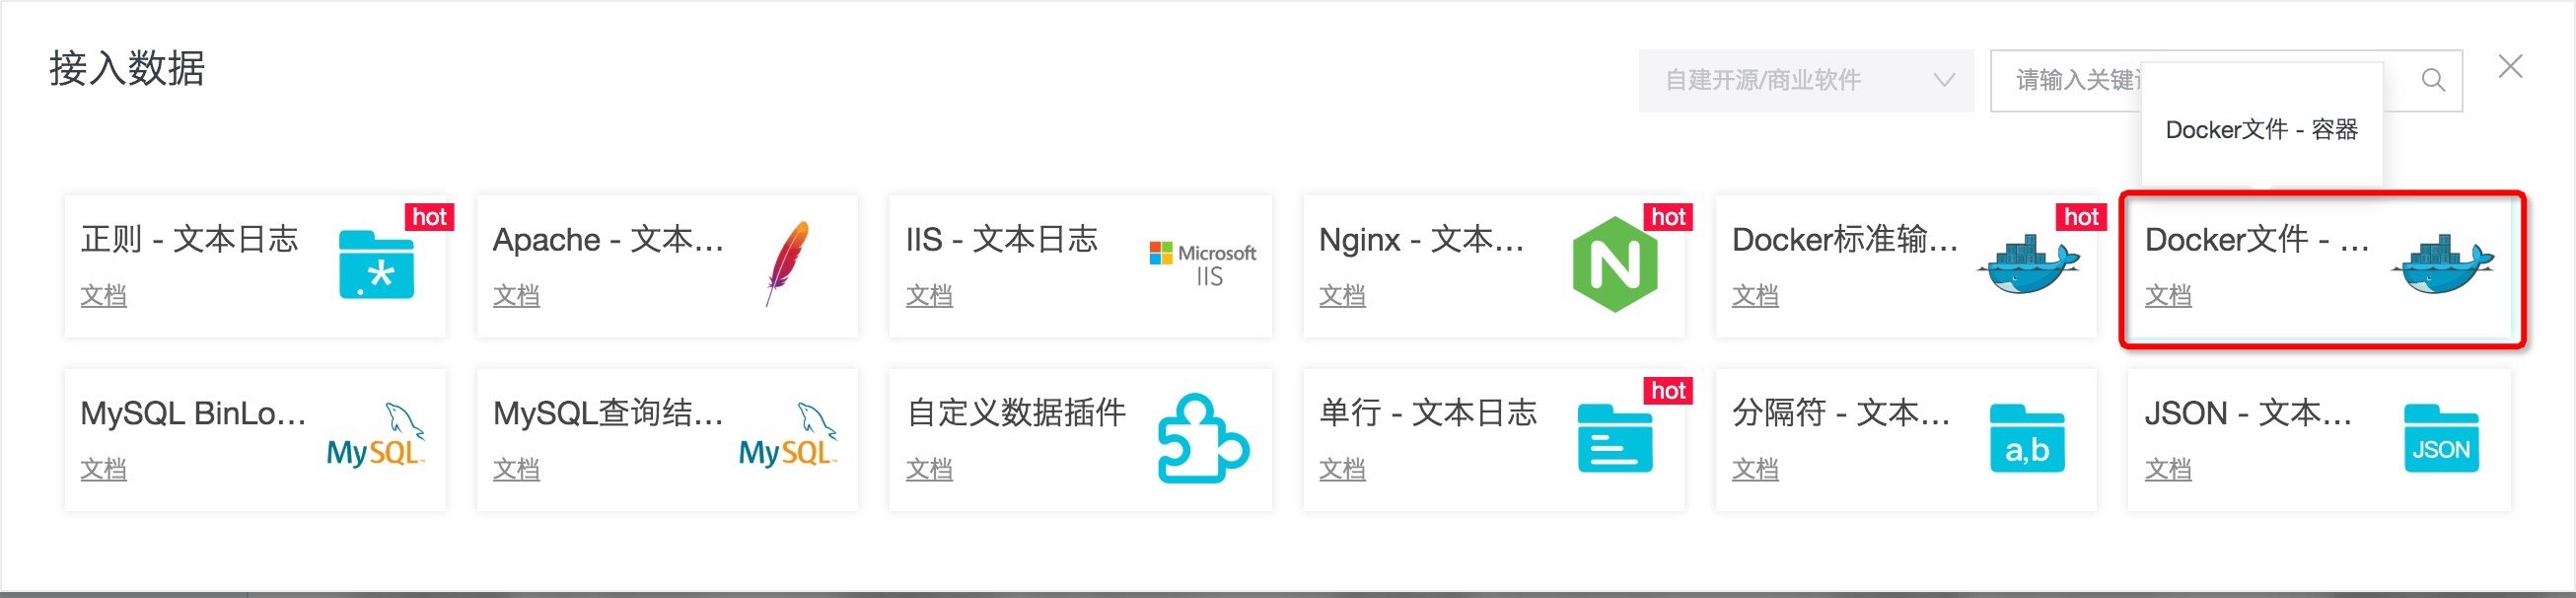
Figure: selecting Docker file configuration
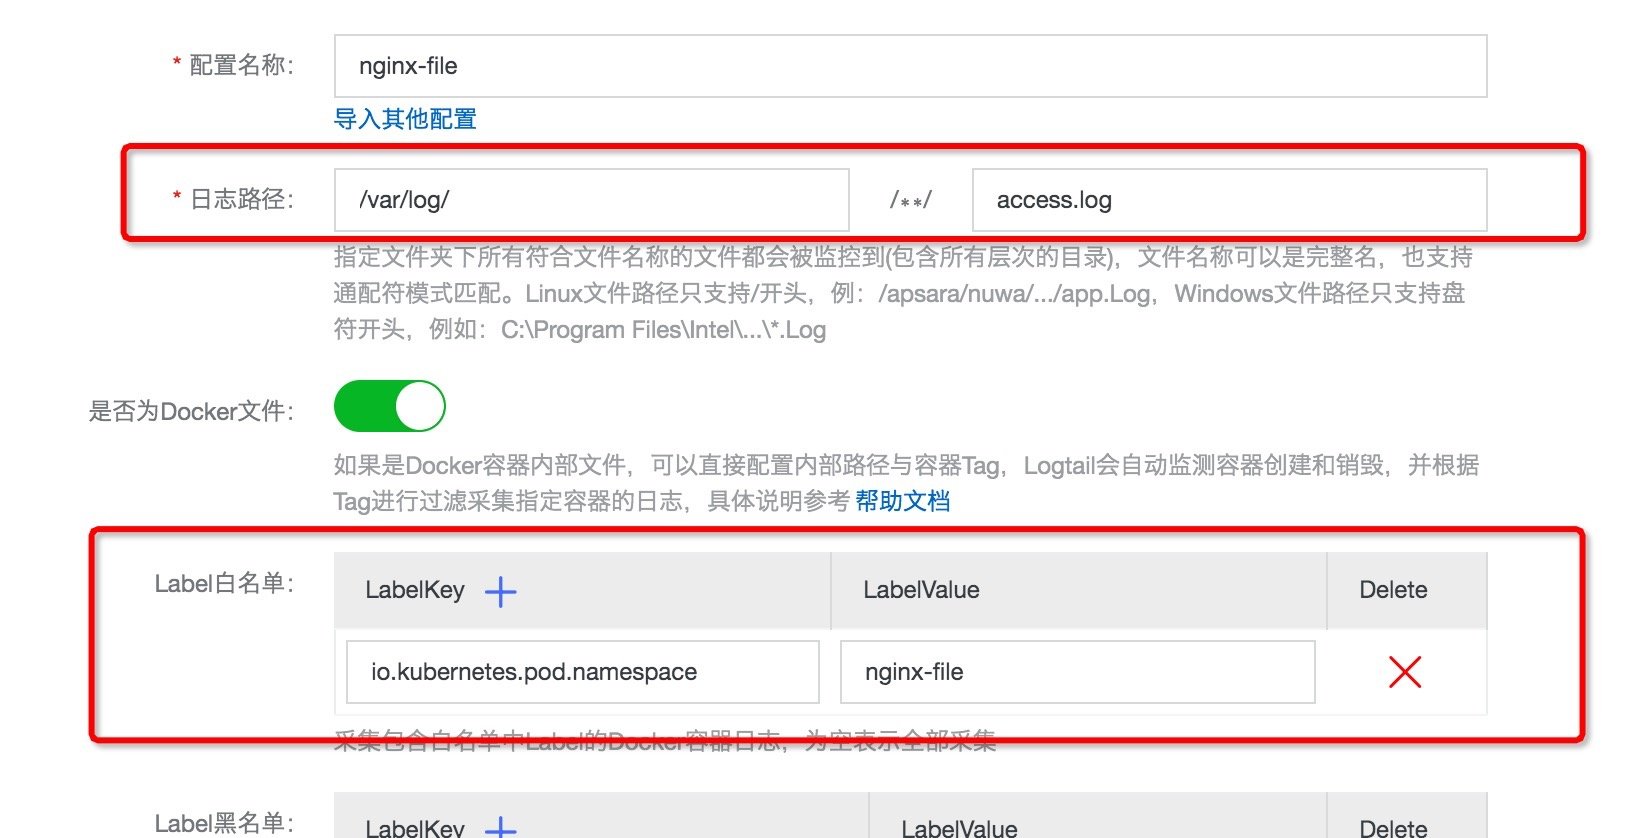
Figure: filling in Docker file collection configuration
2. Log query
2.1. Set field index & enable log clustering
In order to use the query, log clustering and other functions provided by the log service, the index needs to be configured first. The operation steps are as follows:
- land Log service console , enter the project corresponding to the cluster ID, select the previously created k8s-stdout from the logstore in the left navigation bar, and expand the query analysis console.
- Click query analysis properties - > set index in the upper right corner.
- Check log clustering in the pop-up window, and then click auto generate index.
- Click OK to save the index.
The operation screenshot is as follows:
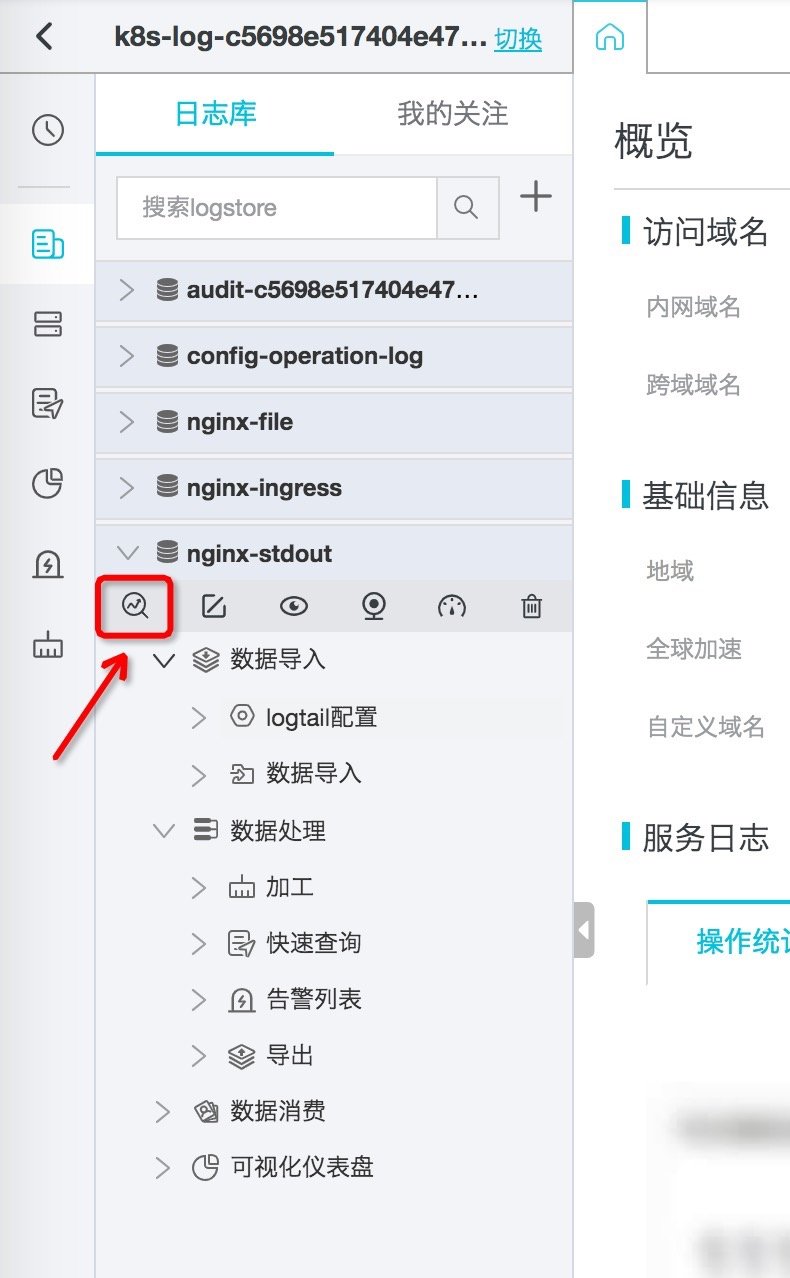
Figure: entering the logstore query and analysis interface
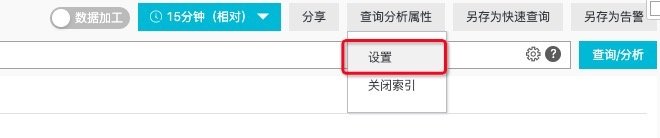
Figure: index configuration entry
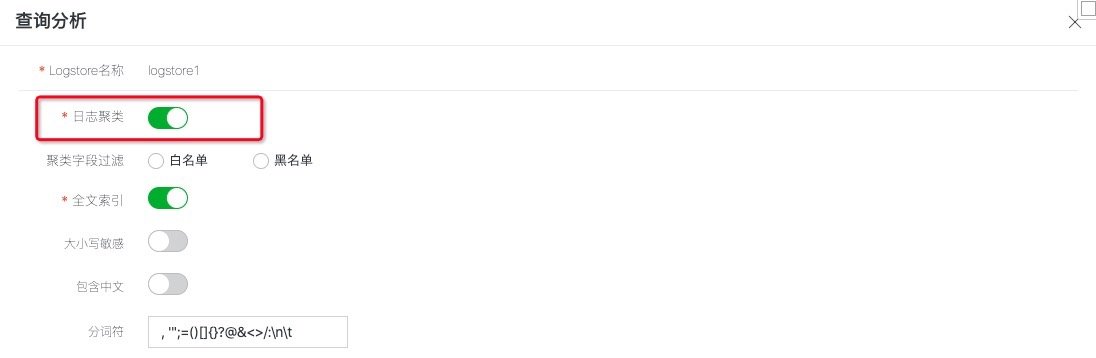
Figure: enable log clustering
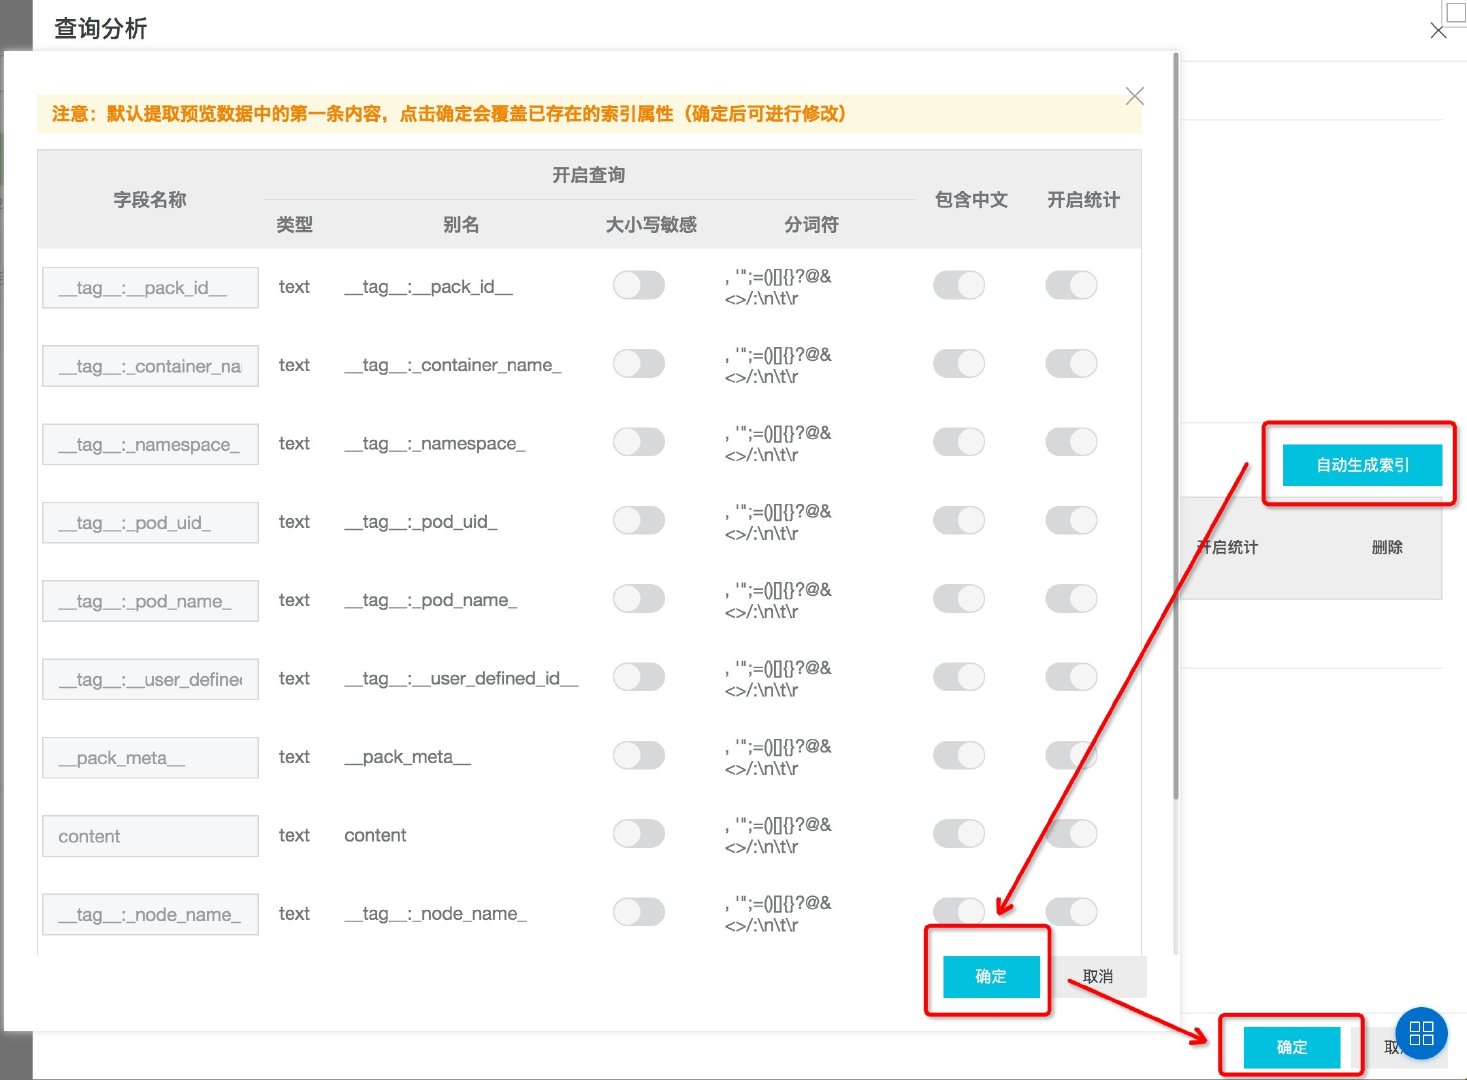
Figure: automatic field index generation
2.2. Basic query
After configuring the index, we can use query statements in the query input box to quickly filter the logs. The following are some examples:
- View the log under the namespace nginx stdout:_ namespace_:nginx-stdout
- View logs under other namespaces: not_ namespace_: nginx-stdout
- View the log of the specified POD under the namespace Kube system:_ namespace_: kube-system and _pod_name_: xxxxxx
In the actual query process, we can quickly fill in the query statement by directly clicking the content in the query result. The screenshot is as follows.
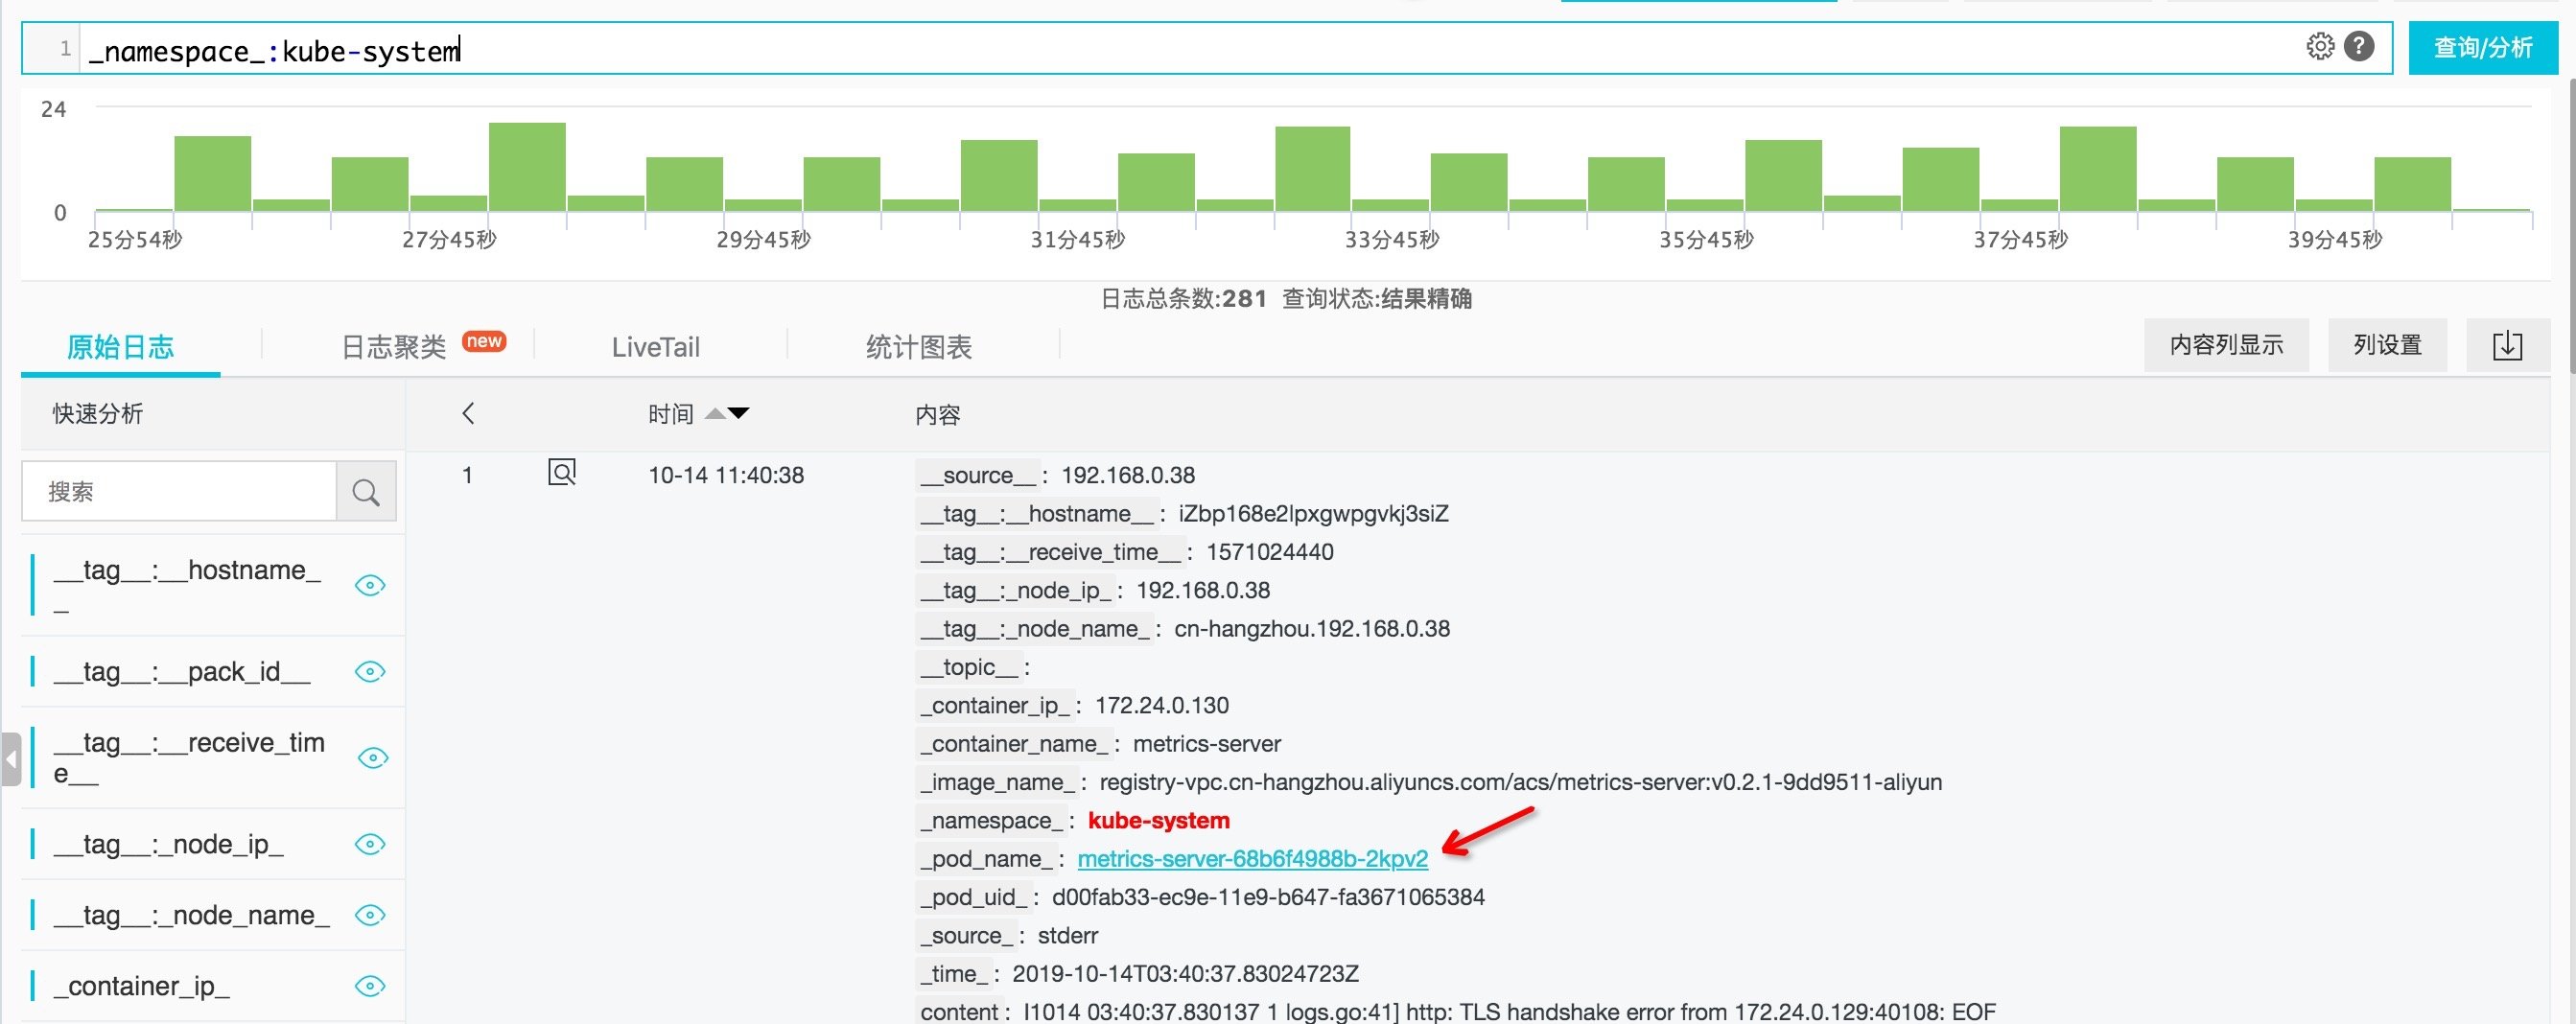
Figure: click the content in the query result
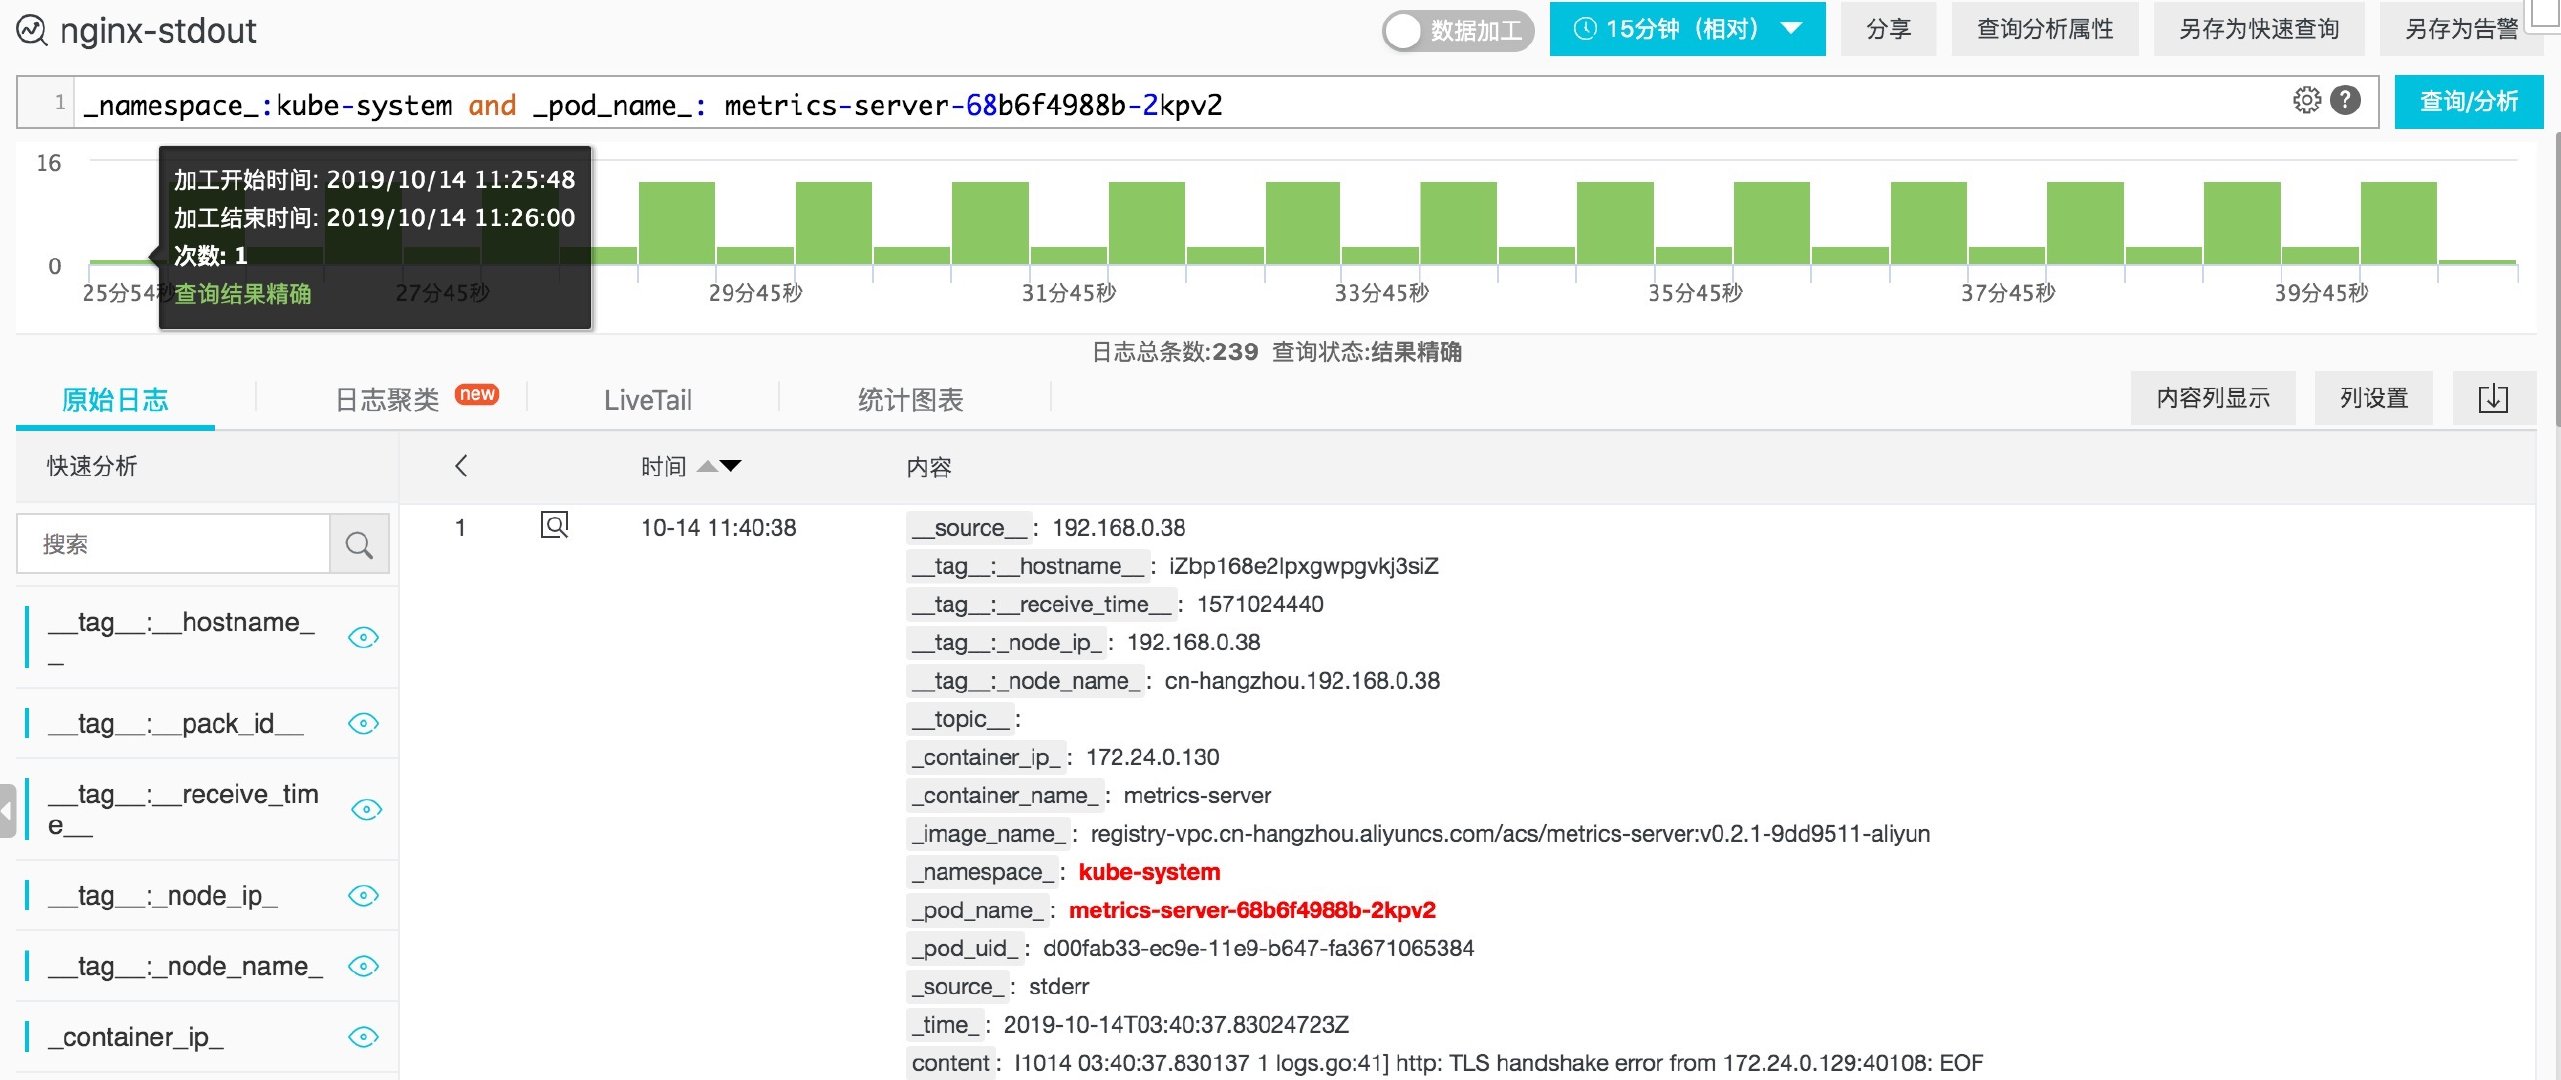
Figure: query statement quick fill
2.3. Log clustering & context query & livetail
When troubleshooting problems, we usually use log clustering, context query and LiveTail to assist in troubleshooting.
- Firstly, log clustering is used to quickly view the log pattern and find the suspected problem log.
- Then, we use context query to track the logs before and after the problem log to help us locate the problem.
- Finally, after making adjustments according to the problems, use LiveTail to check the changes of the latest log and confirm whether the modification expectations are met.
It is assumed that the application pod is metrics server, and we can analyze it with this method:
- Enter metrics server in the query input box and click query analysis to see all logs in all ranges (the default is the last 15 minutes). Generally speaking, there are many logs.
- Due to the large number of logs, in order to find the log mode, we switch to the [log clustering] tab to see that the logs during this period are divided into limited categories in terms of mode. We can drag the pattern progress bar to select granularity. For a specific pattern, click [number of logs] to view the specific logs.
- Hover over the icon on the left of the log time and click context browse in the pop-up menu. You can also filter in the pop-up page, and click earlier and update to view the above and below of the specified log.
- Hover over the icon on the left of the log time and click LiveTail in the pop-up menu.
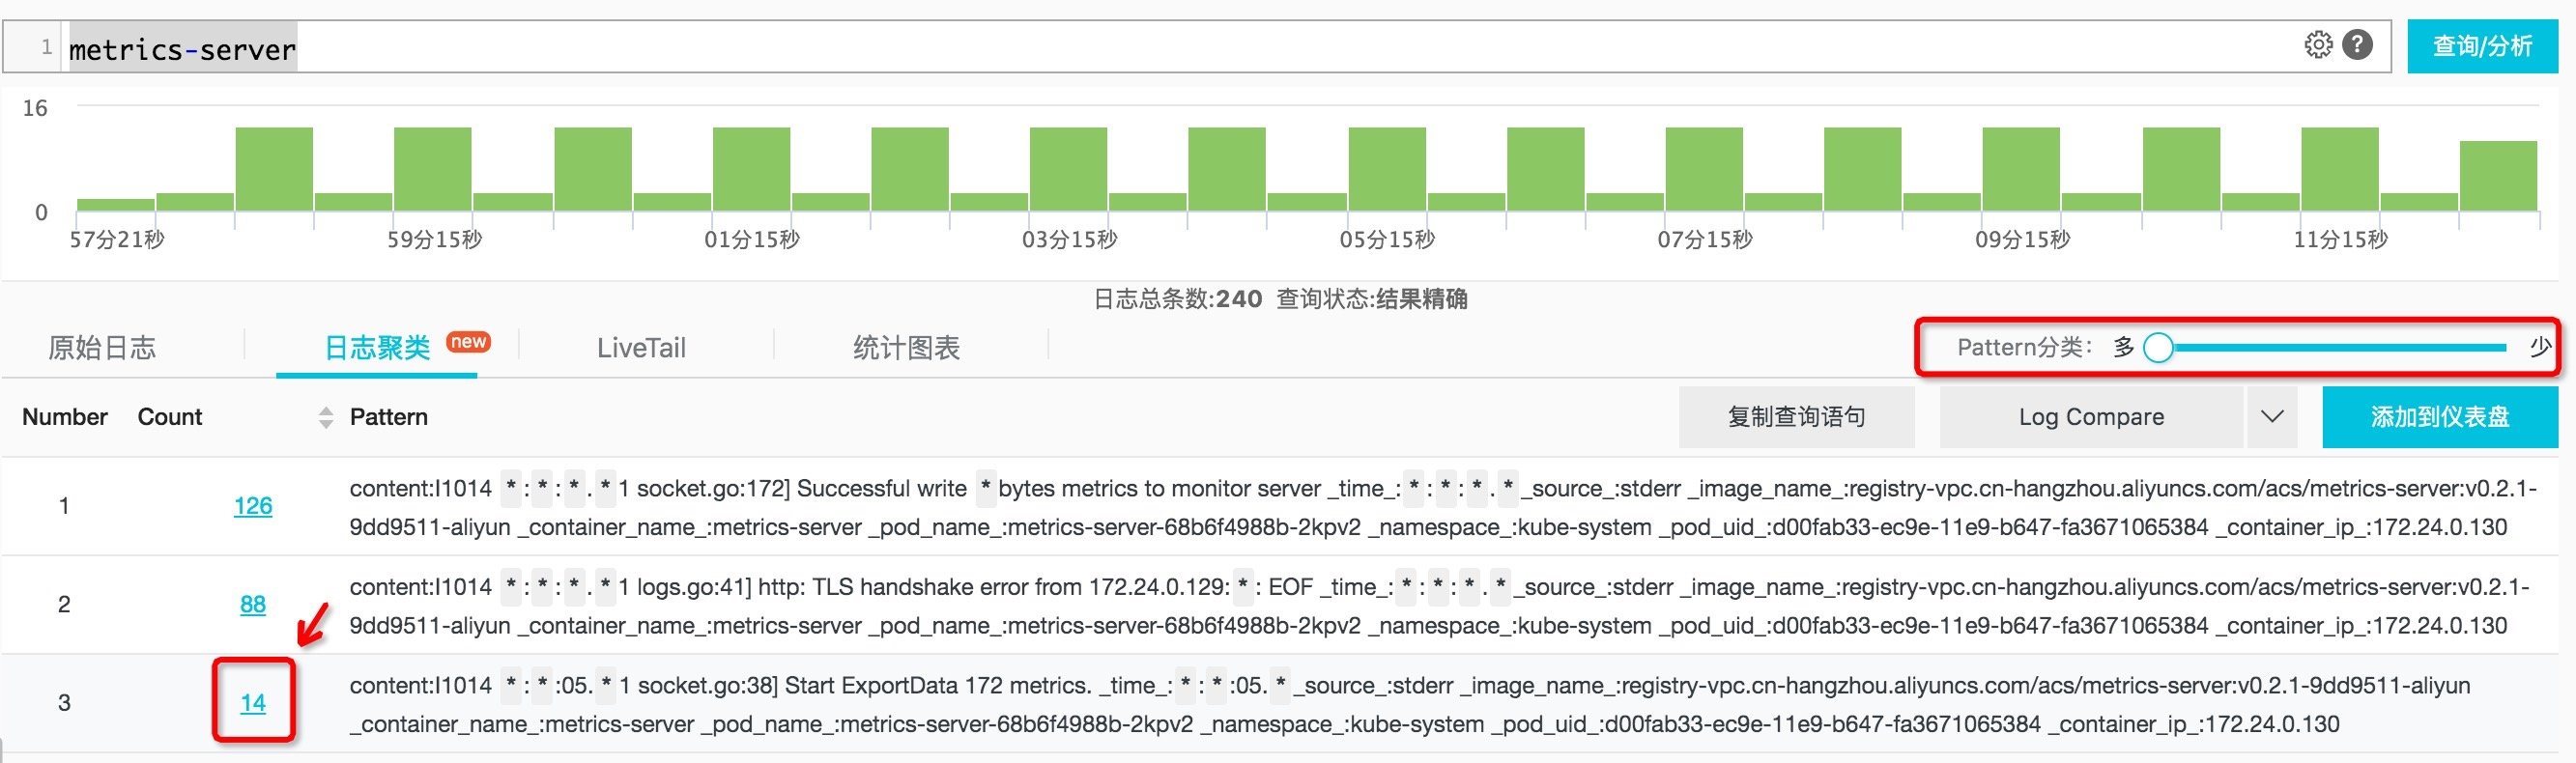
Figure: log clustering results
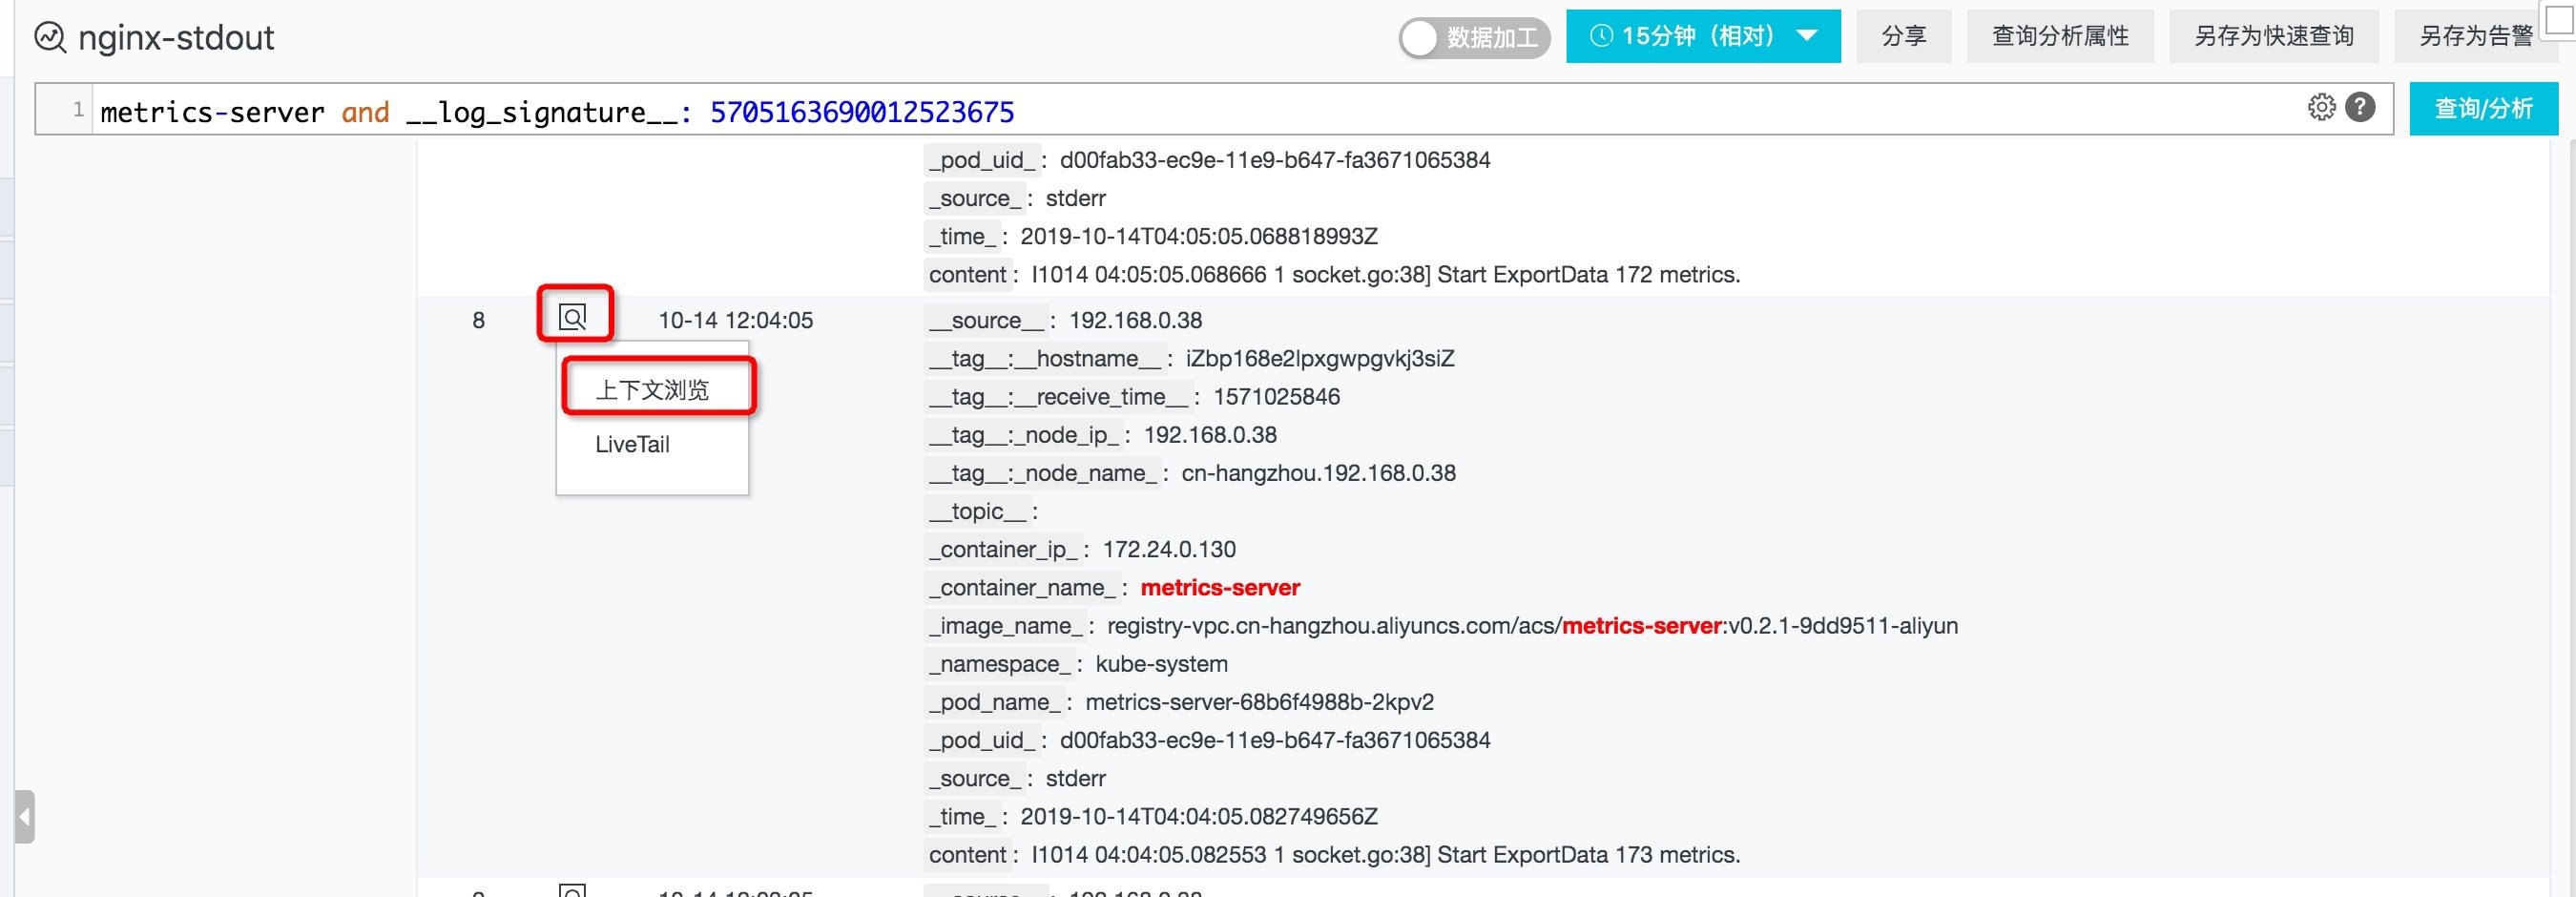
Figure: context query entry
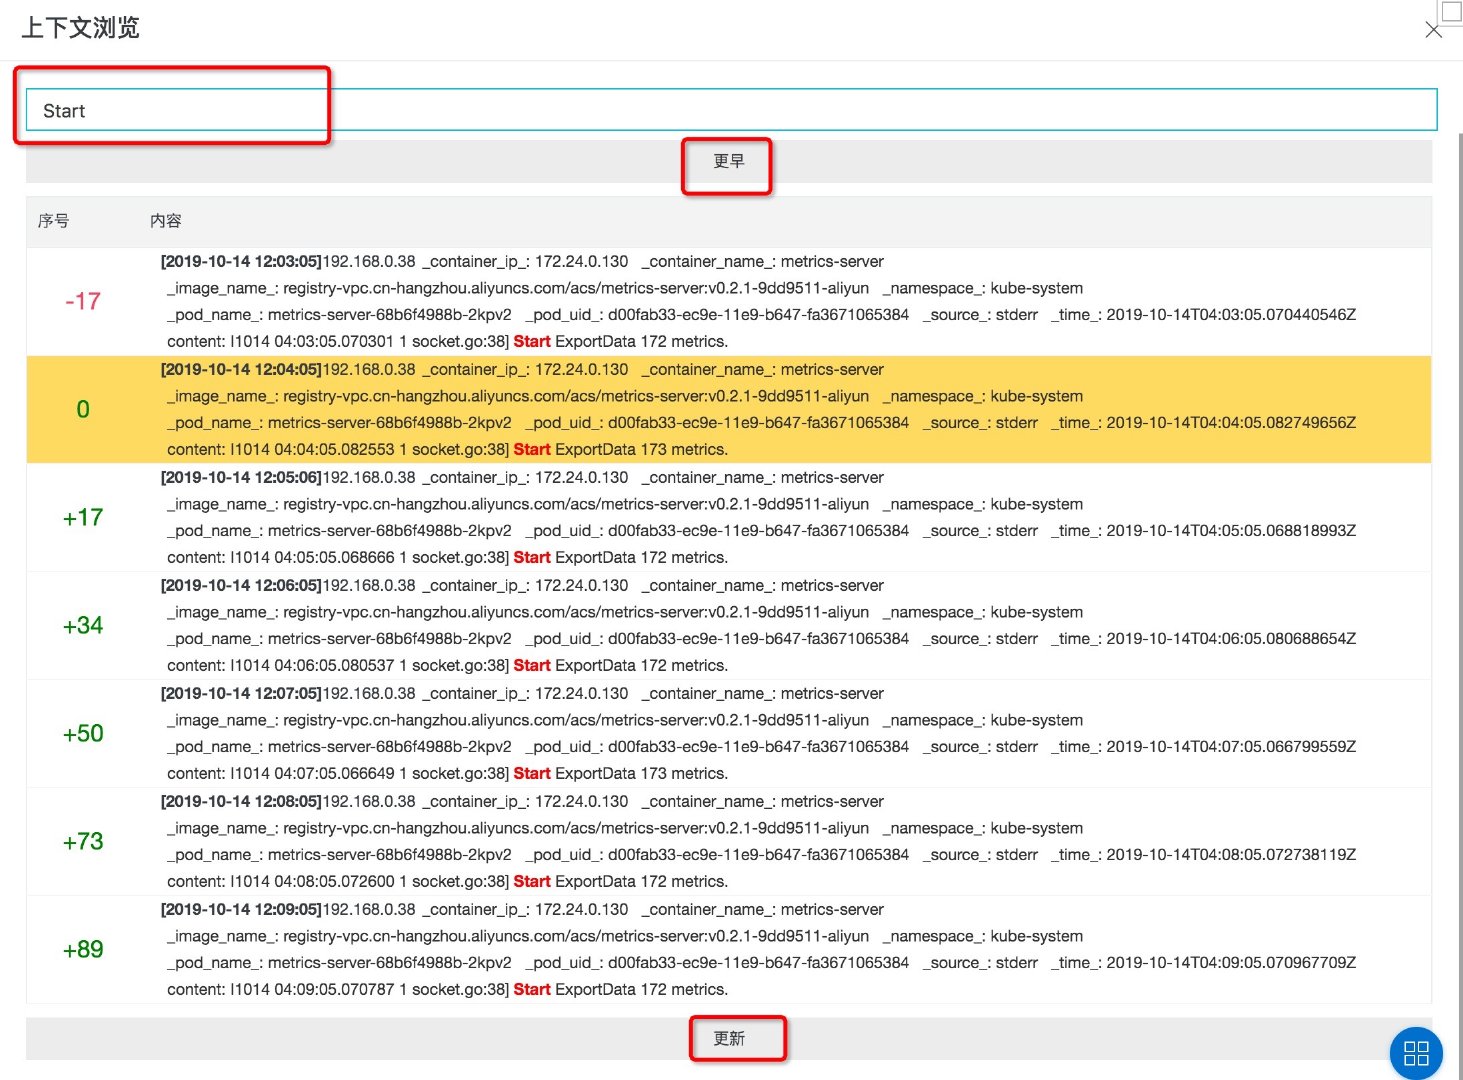
Figure: context query
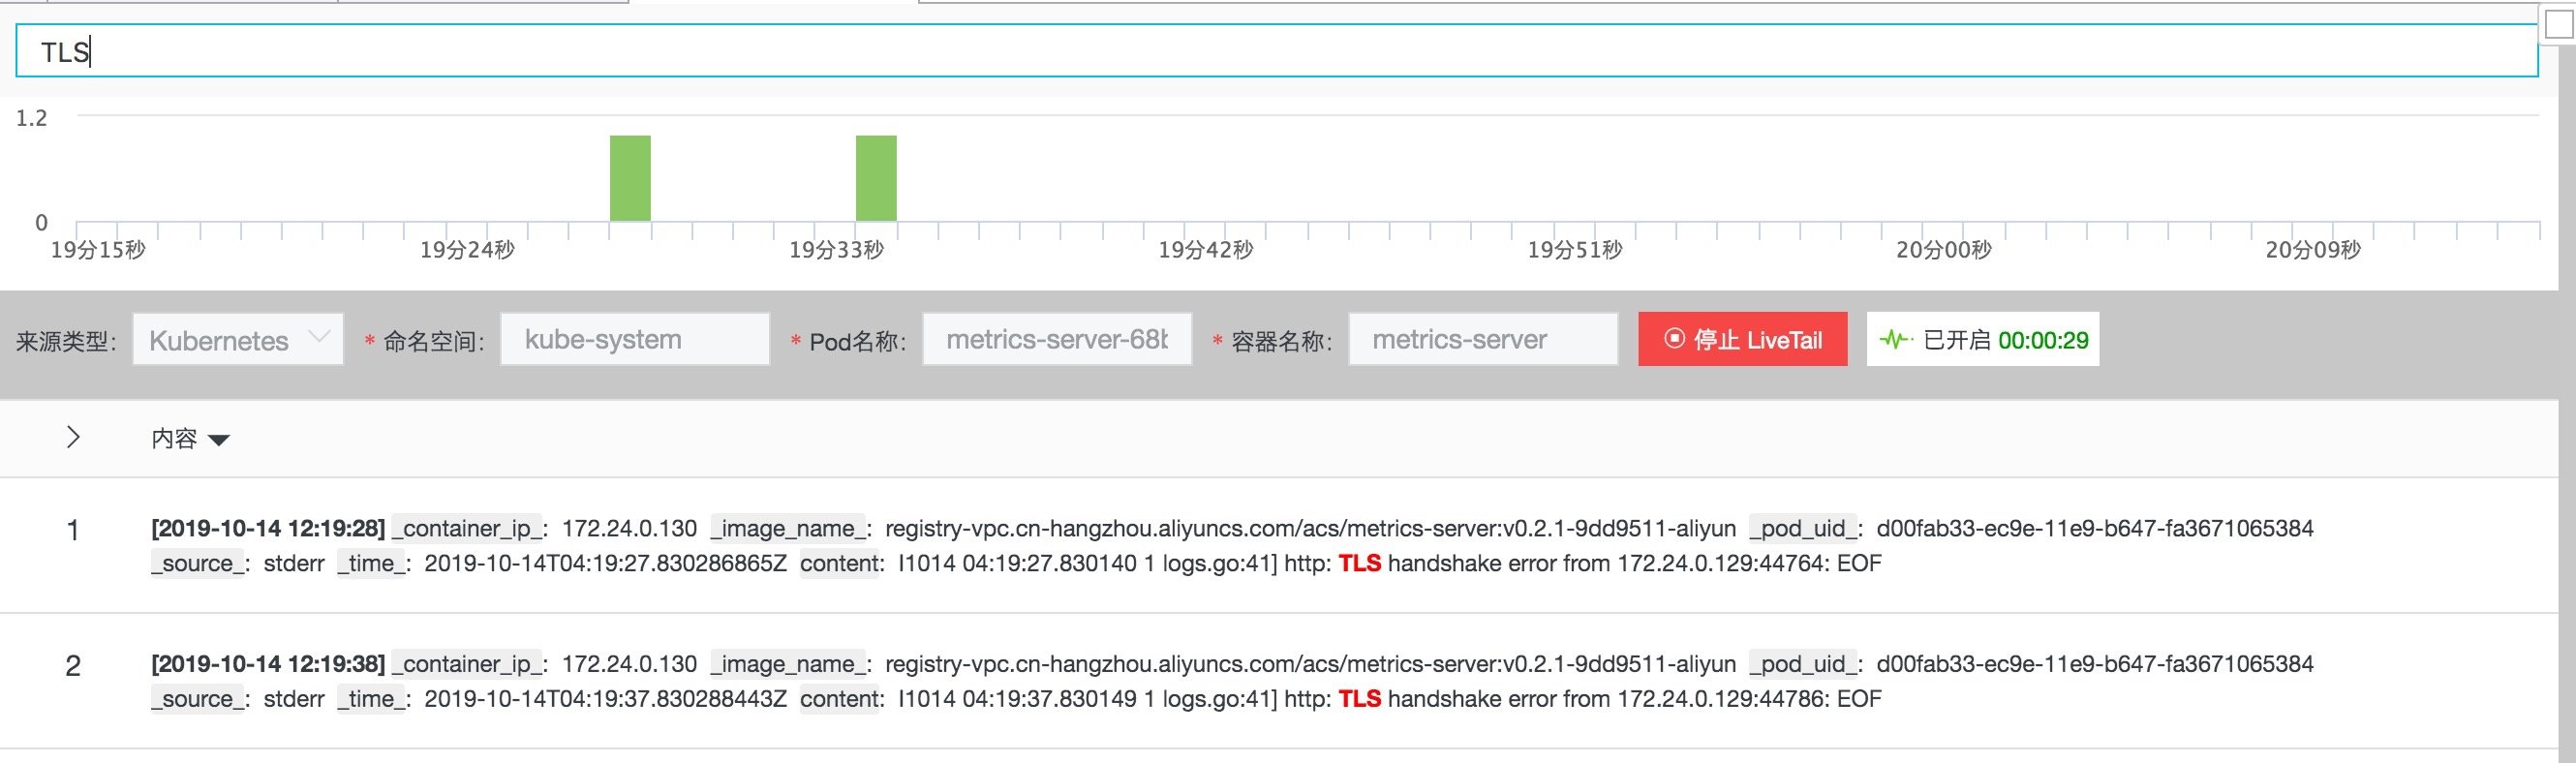
Figure: LiveTail
3. Ingress & Audit Scheme
In addition to the basic log collection, query and analysis functions in the K8s environment, we also provide solutions for the progress and Audit logs in the K8s environment.
3.1. Ingress
In order to deploy the Ingress scheme in the cluster, you only need to apply the following YAML files on the basis of the log service components installed in the cluster:
apiVersion: log.alibabacloud.com/v1alpha1
kind: AliyunLogConfig
metadata:
  # your config name, must be unique in you k8s cluster
  name: k8s-nginx-ingress
spec:
  # logstore name to upload log
  logstore: nginx-ingress
  # product code, only for k8s nginx ingress
  productCode: k8s-nginx-ingress
  # logtail config detail
  logtailConfig:
    inputType: plugin
    # logtail config name, should be same with [metadata.name]
    configName: k8s-nginx-ingress
    inputDetail:
      plugin:
        inputs:
        - type: service_docker_stdout
          detail:
            IncludeLabel:
              io.kubernetes.container.name: nginx-ingress-controller
            Stderr: false
            Stdout: true
        processors:
        - type: processor_regex
          detail:
            KeepSource: false
            Keys:
            - client_ip
            - x_forward_for
            - remote_user
            - time
            - method
            - url
            - version
            - status
            - body_bytes_sent
            - http_referer
            - http_user_agent
            - request_length
            - request_time
            - proxy_upstream_name
            - upstream_addr
            - upstream_response_length
            - upstream_response_time
            - upstream_status
            - req_id
            - host
            NoKeyError: true
            NoMatchError: true
            Regex: ^(\S+)\s-\s\[([^]]+)]\s-\s(\S+)\s\[(\S+)\s\S+\s"(\w+)\s(\S+)\s([^"]+)"\s(\d+)\s(\d+)\s"([^"]*)"\s"([^"]*)"\s(\S+)\s(\S+)+\s\[([^]]*)]\s(\S+)\s(\S+)\s(\S+)\s(\S+)\s(\S+)\s*(\S*).*
            SourceKey: content
The YAML will create a logstore named nginx Ingress in the log service project corresponding to the cluster to store relevant logs, and will correspondingly create a series of detailed reports based on the progress logs to assist us in analyzing the progress logs.
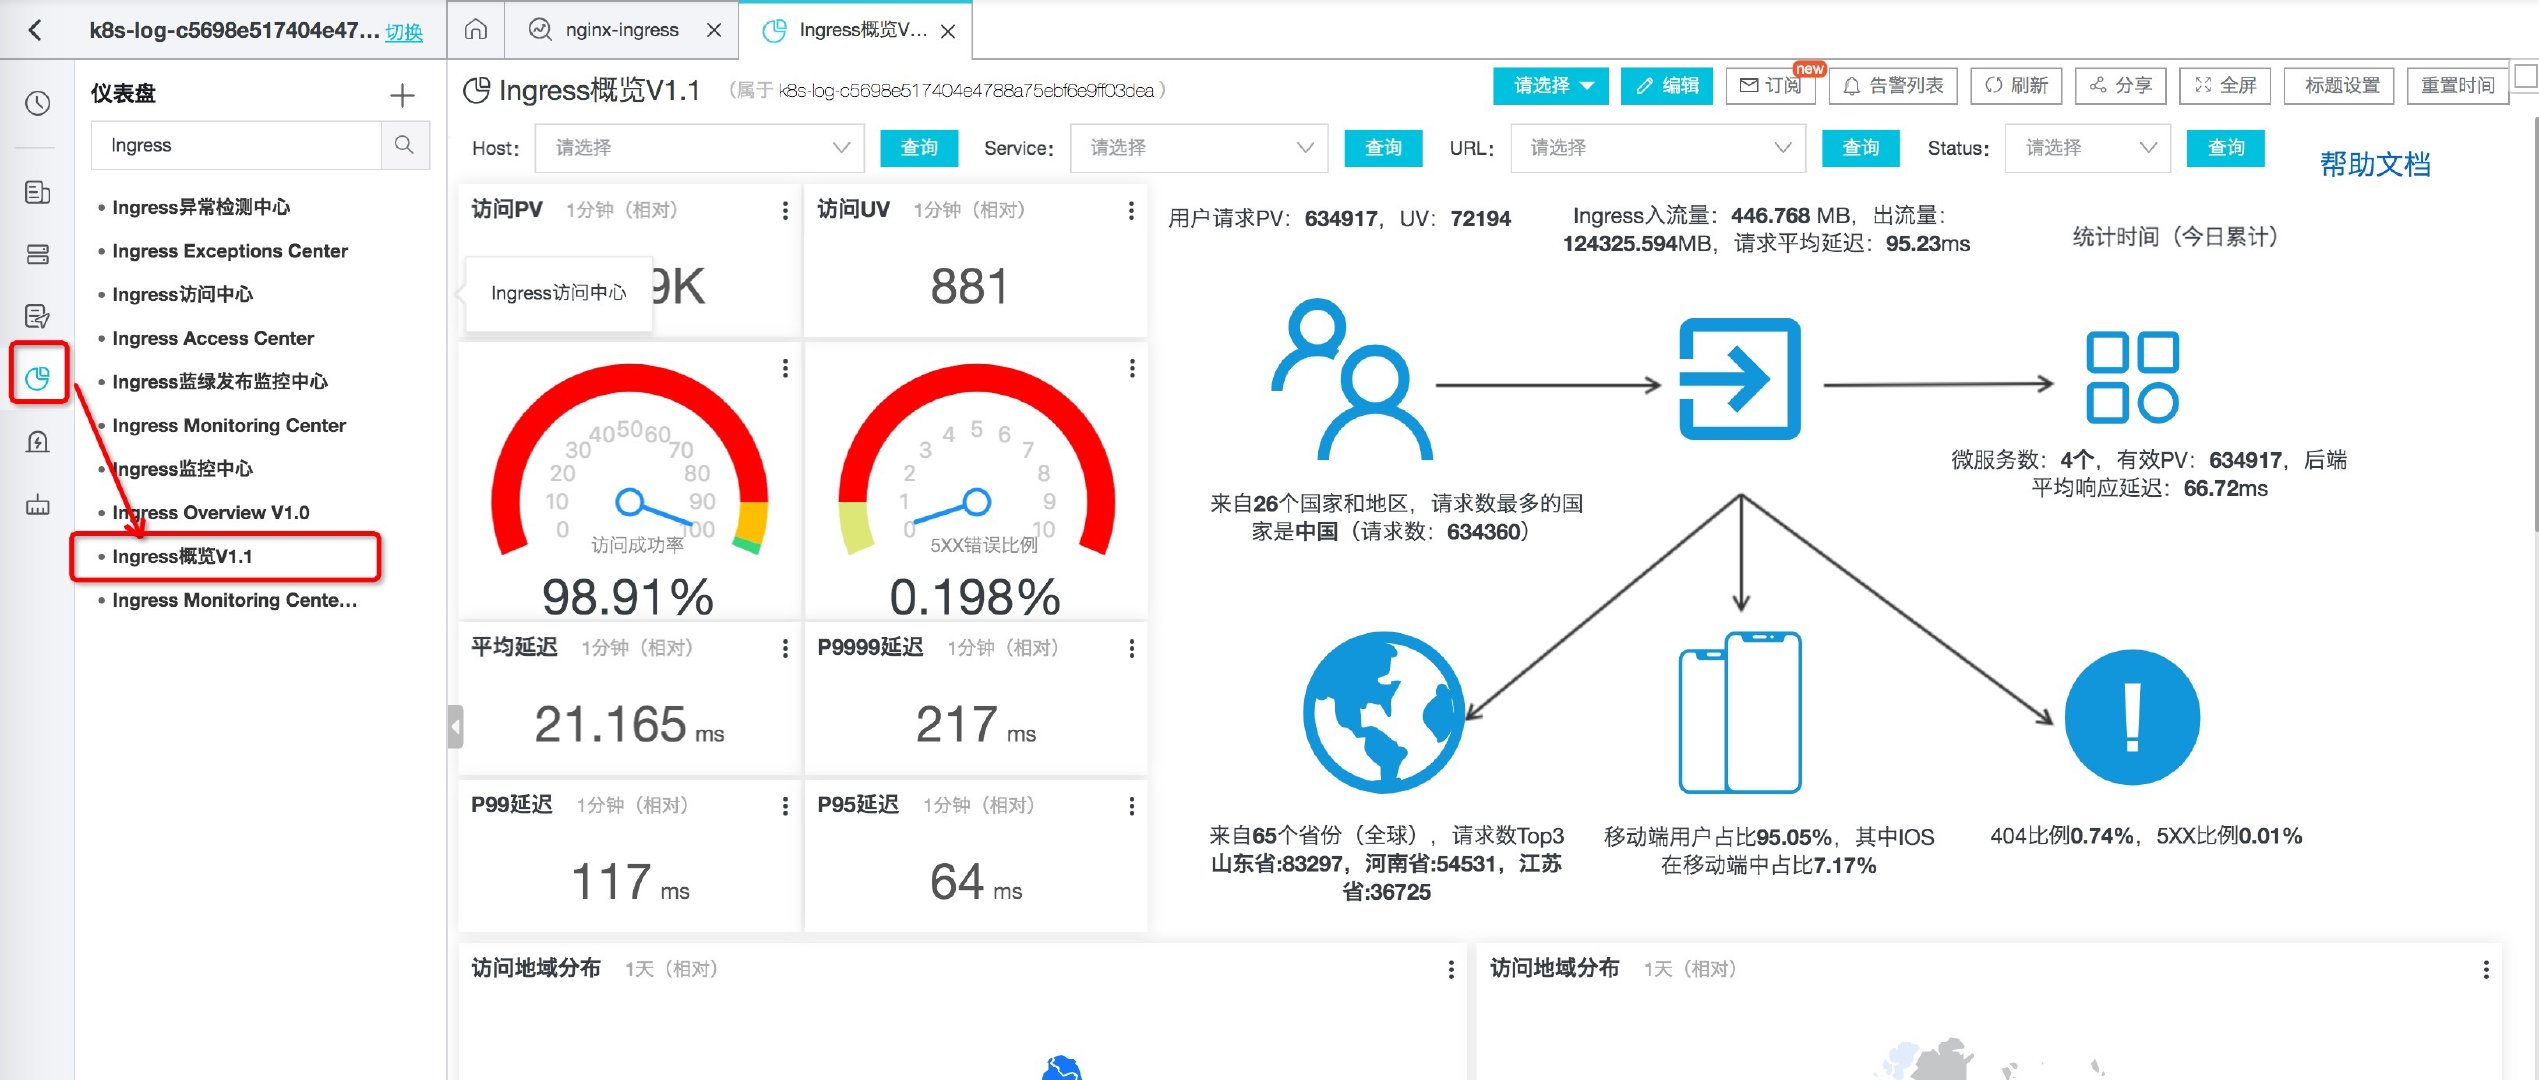
Figure: progress overview
More information can be read Introduction to Kubernetes Ingress log analysis.
Audit
At present, the audit scheme will be automatically applied when the cluster is created, and the relevant logs will be stored in the logstore prefixed with audit - under the log service project, which contains detailed logs for cluster operations, such as the creation and deletion of resources (Pod, Deploy), cluster expansion records, etc. Similarly, the audit scheme also provides a series of detailed statements.
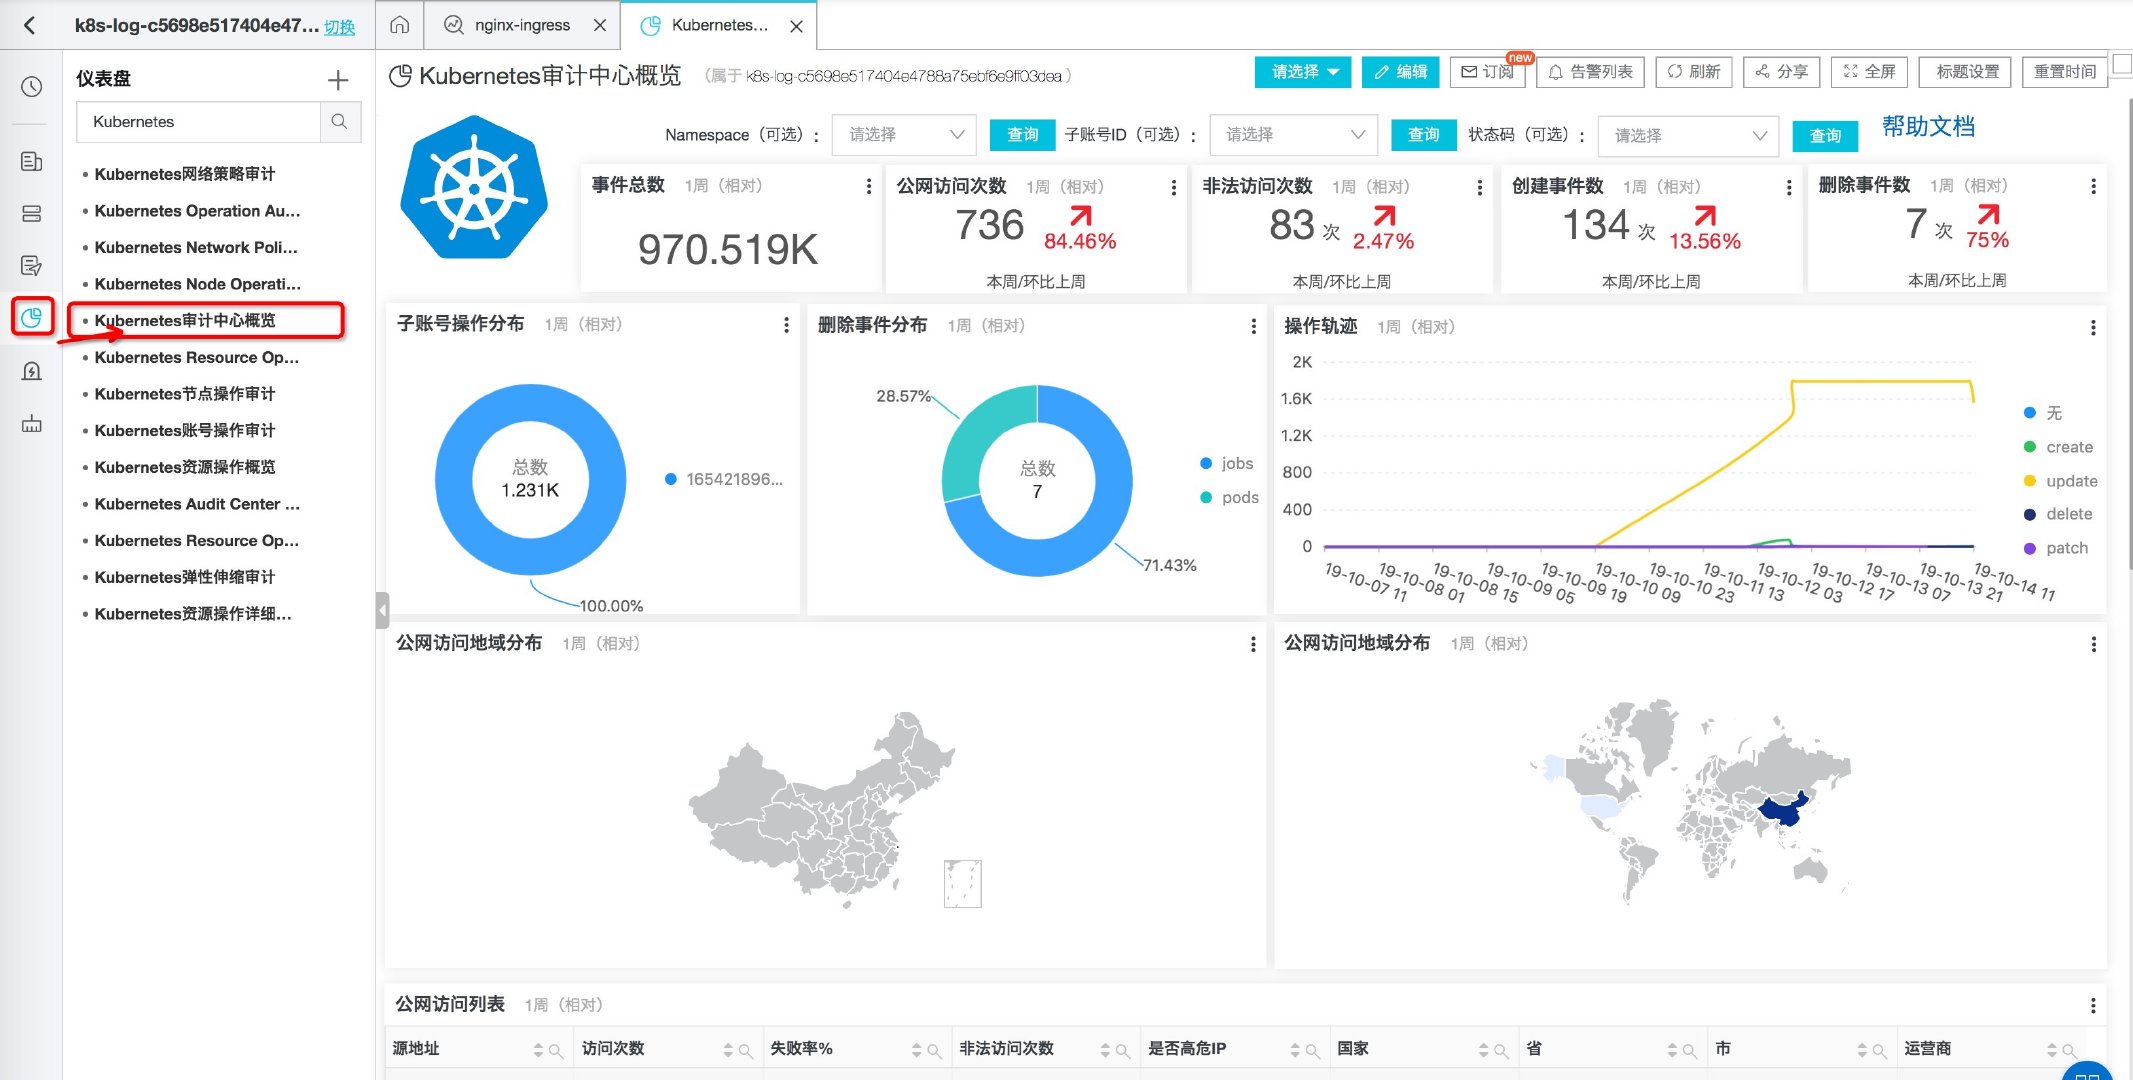
Figure: overview of Audit Center
More information can be read The most complete Kubernetes audit log scheme.
Reference documents
This article is transferred from: Kubernetes log query and analysis practice - Alibaba cloud developer community