1 Introduction
The DataFrame is one of the important data structures of Pandas and one of the most commonly used structures in data analysis using Pandas.
2 Understanding the DataFrame structure
The DataFrame is a tabular data structure that has both row and column labels. It is also called a heterogeneous data table. The so-called heterogeneity refers to that each column in a table can have different data types, such as string, integer, or floating point. Its schematic intent is as follows:

The table shows personal information about a sales team and data about performance rating s. Data is represented as rows and columns, where each column represents an attribute and each row represents information for an entry.
The following table shows the data types of the data described by each column label in the above table, as follows:
| Column | Type |
|---|---|
| name | String |
| age | integer |
| gender | String |
| rating | Float |
Each row of data in a DataFrame can be thought of as a Series structure, except that the DataFrame adds a column label to each data value in those rows.
As with Series, the DataFrame has its own row label index, which by default is the Implicit Index, which increments from 0 onwards, with row labels corresponding to one-to-one data items in the DataFrame. Of course, you can also set the row labels in an "explicit index" way.
Features of the DataFrame data structure:
- Tag values for each column of the DataFrame allow different data types to be used;
- The DataFrame is a tabular data structure with rows and columns.
- Each data value in the DataFrame can be modified.
- The number of rows and columns in a DataFrame structure can be increased or deleted.
- DataFrame has two label axes, row label and column label.
- The DataFrame can perform arithmetic operations on rows and columns.
3 Create DataFrame Object
The syntax format for creating a DataFrame object is as follows:
import pandas as pd
pd.DataFrame( data, index, columns, dtype, copy)
Parameter description:
| Parameter Name | Explain |
|---|---|
| data | The data you enter can be ndarray, series, list, dict, scalar, and a DataFrame. |
| index | Row label, if no index value is passed, the default row label is np.arange(n), n represents the number of elements of data. |
| columns | Column label, if no columns value is passed, the default column label is np.arange(n). |
| dtype | dtype represents the data type of each column. |
| copy | The default is False, meaning to copy data. |
Pandas provides a variety of ways to create DataFrame objects, including the following five types, which are described separately.
3.1 Create an empty DataFrame object
Create an empty DataFrame.
import pandas as pd
df = pd.DataFrame()
print(df)
Output results:
Empty DataFrame
Columns: []
Index: []
3.2 List Create DataFame Object
You can use a single list or nested list to create a DataFrame.
- Example 1, Single List Creates DataFrame:
import pandas as pd
data = [1,2,3,4,5]
df = pd.DataFrame(data)
print(df)
The output is as follows:
     0
0    1
1    2
2    3
3    4
4    5
- Example 2, creating a DataFrame object using a nested list:
import pandas as pd
data = [['Alex',10],['Bob',12],['Clarke',13]]
df = pd.DataFrame(data,columns=['Name','Age'])
print(df)
Output results:
      Name      Age
0     Alex      10
1     Bob       12
2     Clarke    13
- Example 3, specifying a numeric element with a data type of float:
import pandas as pd
data = [['Alex',10],['Bob',12],['Clarke',13]]
df = pd.DataFrame(data,columns=['Name','Age'],dtype=float)
print(df)
Output results:
      Name     Age
0     Alex     10.0
1     Bob      12.0
2     Clarke   13.0
3.3 Dictionary Nested List Creation
- In a dictionary, the element lengths of the values corresponding to the keys must be the same (the list lengths are the same).
- If an index is passed, the length of the index should equal the length of the array; If no index is passed, by default, the index will be $range(n)$, where $n$represents the length of the array.
- Example 4:
import pandas as pd
data = {'Name':['Tom', 'Jack', 'Steve', 'Ricky'],'Age':[28,34,29,42]}
df = pd.DataFrame(data)
print(df)
Output results:
      Age      Name
0     28        Tom
1     34       Jack
2     29      Steve
3     42      Ricky
Note: The default row label, range(n), is used here. It generates 0,1,2,3 and corresponds to each element value in the list.
- Example 5, now add a custom row label to example 4 above:
import pandas as pd
data = {'Name':['Tom', 'Jack', 'Steve', 'Ricky'],'Age':[28,34,29,42]}
df = pd.DataFrame(data, index=['rank1','rank2','rank3','rank4'])
print(df)
The output is as follows:
         Age    Name
rank1    28      Tom
rank2    34     Jack
rank3    29    Steve
rank4    42    Ricky
Note: The index parameter assigns an index to each row.
3.4 List Nested Dictionary Create DataFrame Object
List nested dictionaries can be passed to the DataFrame constructor as input data. By default, dictionary keys are used as column names.
- Example 6 is as follows:
import pandas as pd
data = [{'a': 1, 'b': 2},{'a': 5, 'b': 10, 'c': 20}]
df = pd.DataFrame(data)
print(df)
Output results:
    a    b      c
0   1   2     NaN
1   5   10   20.0
Note: If one of the element values is missing, that is, the dictionary key cannot find the corresponding value, NaN will be used instead.
- Example 7, add a row label index to example 6 above:
import pandas as pd
data = [{'a': 1, 'b': 2},{'a': 5, 'b': 10, 'c': 20}]
df = pd.DataFrame(data, index=['first', 'second'])
print(df)
Output results:
        a   b       c
first   1   2     NaN
second  5   10   20.0
Example 8, how to create a DataFrame object using a dictionary nested list and row and column index tables.
import pandas as pd
data = [{'a': 1, 'b': 2},{'a': 5, 'b': 10, 'c': 20}]
df1 = pd.DataFrame(data, index=['first', 'second'], columns=['a', 'b'])
df2 = pd.DataFrame(data, index=['first', 'second'], columns=['a', 'b1'])
print(df1)
print(df2)
Output results:
#df2 output
         a  b
first    1  2
second   5  10

#df1 output
         a  b1
first    1  NaN
second   5  NaN
Note: Because b1 does not exist in the dictionary key, the corresponding value is NaN.
3.5 Series Create DataFrame Object
You can also pass Series as a dictionary to create a DataFrame object whose output row index is a collection of all indexes. Examples are as follows:
import pandas as pd
d = {'one' : pd.Series([1, 2, 3], index=['a', 'b', 'c']),
   'two' : pd.Series([1, 2, 3, 4], index=['a', 'b', 'c', 'd'])}
df = pd.DataFrame(d)
print(df)
The output is as follows:
      one    two
a     1.0    1
b     2.0    2
c     3.0    3
d     NaN    4
Note: For one column, although the row index'd'is shown here, its value is NaN because there is no corresponding value.
4-Column Index Operation DataFrame
The DataFrame can use columns index to select, add, and delete data. These operations are described in turn below.
4.1 Column Index Select Data Columns
You can easily select data by using column indexes as follows:
import pandas as pd
d = {'one' : pd.Series([1, 2, 3], index=['a', 'b', 'c']),
   'two' : pd.Series([1, 2, 3, 4], index=['a', 'b', 'c', 'd'])}
df = pd.DataFrame(d)
print(df ['one'])
Output results:
a     1.0
b     2.0
c     3.0
d     NaN
Name: one, dtype: float64
4.2 Column Index Add Data Columns
Adding a new data column can be accomplished using the columns column index table label, as shown in the following example:
import pandas as pd
d = {'one' : pd.Series([1, 2, 3], index=['a', 'b', 'c']),
   'two' : pd.Series([1, 2, 3, 4], index=['a', 'b', 'c', 'd'])}
df = pd.DataFrame(d)
#Use df['column']=Value, insert new data column
df['three']=pd.Series([10,20,30],index=['a','b','c'])
print(df)
#Add existing data columns
df['four']=df['one']+df['three']
print(df)
Output results:
Creating new data columns using column indexes:
     one   two   three
a    1.0    1    10.0
b    2.0    2    20.0
c    3.0    3    30.0
d    NaN    4    NaN

Existing data columns perform arithmetic operations:
      one   two   three    four
a     1.0    1    10.0     11.0
b     2.0    2    20.0     22.0
c     3.0    3    30.0     33.0
d     NaN    4     NaN     NaN
In the example above, we first used the arithmetic operations of the DataFrame, which is very similar to NumPy. In addition to using df[]=value, you can insert new columns using insert(), as shown in the following example:
import pandas as pd
info=[['Jack',18],['Helen',19],['John',17]]
df=pd.DataFrame(info,columns=['name','age'])
print(df)
#Notice that column parameter
#Value 1 means insert into columns Index position of list
df.insert(1,column='score',value=[91,90,75])
print(df)
Output results:
Before adding:
    name  age
0   Jack   18
1  Helen   19
2   John   17

After adding:
    name  score  age
0   Jack     91   18
1  Helen     90   19
2   John     75   17
4.3 Column Index Delete Data Columns
Both del and pop() allow you to delete data columns in a DataFrame. Examples are as follows:
import pandas as pd
d = {'one' : pd.Series([1, 2, 3], index=['a', 'b', 'c']),
   'two' : pd.Series([1, 2, 3, 4], index=['a', 'b', 'c', 'd']),
   'three' : pd.Series([10,20,30], index=['a','b','c'])}
df = pd.DataFrame(d)
print ("Our dataframe is:")
print(df)
#Use del delete
del df['one']
print(df)
#Use pop Method Delete
df.pop('two')
print (df)
Output results:
primary DataFrame:
      one   three  two
a     1.0    10.0   1
b     2.0    20.0   2
c     3.0    30.0   3
d     NaN     NaN   4

Use del delete first:
      three    two
a     10.0     1
b     20.0     2
c     30.0     3
d     NaN      4

Use pop()delete:
   three
a  10.0
b  20.0
c  30.0
d  NaN
5-Row index operation DataFrame
With the understanding of column indexing above, row indexing becomes easier. Let's see how row indexes are used to select data in a DataFrame.
5.1 Label Index Selection
You can select data by passing row labels to the loc function. Examples are as follows:
import pandas as pd
d = {'one' : pd.Series([1, 2, 3], index=['a', 'b', 'c']),
   'two' : pd.Series([1, 2, 3, 4], index=['a', 'b', 'c', 'd'])}
df = pd.DataFrame(d)
print(df.loc['b'])
Output results:
one 2.0
two 2.0
Name: b, dtype: float64
Note: loc allows two parameters, row and column, separated by a comma, but the function only accepts label indexes.
5.2 Integer Index Selection
Data row selection can also be achieved by passing the index position of the data row to the iloc function. Examples are as follows:
import pandas as pd
d = {'one' : pd.Series([1, 2, 3], index=['a', 'b', 'c']),
   'two' : pd.Series([1, 2, 3, 4], index=['a', 'b', 'c', 'd'])}
df = pd.DataFrame(d)
print (df.iloc[2])
Output results:
one   3.0
two   3.0
Name: c, dtype: float64
Note: iloc allows two parameters to be accepted as rows and columns separated by commas, but the function can only receive integer indexes.
5.3 Slicing Multi-line Selection
You can also use slicing to select multiple rows at the same time. Examples are as follows:
import pandas as pd
d = {'one' : pd.Series([1, 2, 3], index=['a', 'b', 'c']),
   'two' : pd.Series([1, 2, 3, 4], index=['a', 'b', 'c', 'd'])}
df = pd.DataFrame(d)
#Left Close Right Open
print(df[2:4])
Output results:
   one  two
c  3.0    3
d  NaN    4
5.4 Add Data Rows
With the append() function, new rows of data can be added to the DataFrame, which appends rows at the end of the row. Examples are as follows:
import pandas as pd
df = pd.DataFrame([[1, 2], [3, 4]], columns = ['a','b'])
df2 = pd.DataFrame([[5, 6], [7, 8]], columns = ['a','b'])
#Append new data rows at the end of rows
df = df.append(df2)
print(df)
Output results:
   a  b
0  1  2
1  3  4
0  5  6
1  7  8
5.5 Delete rows of data
You can delete a row from the DataFrame using row index labels. If the index labels are duplicated, they will be deleted together. Examples are as follows:
import pandas as pd
df = pd.DataFrame([[1, 2], [3, 4]], columns = ['a','b'])
df2 = pd.DataFrame([[5, 6], [7, 8]], columns = ['a','b'])
df = df.append(df2)
print(df)
#Notice that this is called drop()Method
df = df.drop(0)
print (df)
Output results:
implement drop(0)Front:
   a  b
0  1  2
1  3  4
0  5  6
1  7  8

implement drop(0)After:
  a b
1 3 4
1 7 8
In the example above, a row index is generated by default using range(2) and two rows of data are deleted simultaneously by drop(0).
6 Summary of common properties and methods
The properties and methods of the DataFrame are no different from Series, as follows:
| Name | Property-Method Description |
|---|---|
| T | Row and column transpose. |
| axes | Returns a list with only row and column axis labels as members. |
| dtypes | Returns the data type for each column of data. |
| empty | If there is no data in the DataFrame or if the length of any axis is zero, True is returned. |
| ndim | The number of axes, also the dimension of the exponential group. |
| shape | Returns a tuple representing the DataFrame dimension. |
| size | Number of elements in the DataFrame. |
| values | Use numpy arrays to represent element values in the DataFrame. |
| head() | Returns the first n rows of data. |
| tail() | Return n rows of data. |
| shift() | Moves rows or columns by the specified step length |
The following demonstrates common properties of a DataFrame. First, we create a DataFrame object with the following example:
import pandas as pd
import numpy as np
d = {'Name':pd.Series(['c Chinese Language Web','Programming Help',"Baidu",'360 search','Google','Microscience Academy','Bing search']),
   'years':pd.Series([5,6,15,28,3,19,23]),
   'Rating':pd.Series([4.23,3.24,3.98,2.56,3.20,4.6,3.8])}
#structure DataFrame
df = pd.DataFrame(d)
#output series
print(df)
Output results:
output series data:
     Name  years  Rating
0  c Chinese Language Web    5    4.23
1     Programming Help     6    3.24
2      Baidu     15    3.98
3   360 search     28    2.56
4      Google     3     3.20
5     Microscience Academy    19    4.60
6  Bing search     23    3.80
6.1 T (Transpose) Transpose
Returns the transformation of the DataFrame, that is, the exchange of rows and columns.
import pandas as pd
import numpy as np
d = {'Name':pd.Series(['c Chinese Language Web','Programming Help',"Baidu",'360 search','Google','Microscience Academy','Bing search']),
   'years':pd.Series([5,6,15,28,3,19,23]),
   'Rating':pd.Series([4.23,3.24,3.98,2.56,3.20,4.6,3.8])}
#structure DataFrame
df = pd.DataFrame(d)
#output DataFrame Transfer
print(df.T)
Output results:
Our data series is:
             0         1      2      3       4    5       6
Name    c Language Chinese Network Programming Help    Baidu 360 Search Google Weixue Academy  Bing search
years        5        6      15      28      3     19      23
Rating    4.23       3.24    3.98    2.56    3.2   4.6     3.8
6.2 axes
Returns a list of row labels and column labels.
import pandas as pd
import numpy as np
d = {'Name':pd.Series(['c Chinese Language Web','Programming Help',"Baidu",'360 search','Google','Microscience Academy','Bing search']),
   'years':pd.Series([5,6,15,28,3,19,23]),
   'Rating':pd.Series([4.23,3.24,3.98,2.56,3.20,4.6,3.8])}
#structure DataFrame
df = pd.DataFrame(d)
#Output row, column labels
print(df.axes)
Output results:
[RangeIndex(start=0, stop=7, step=1), Index(['Name', 'years', 'Rating'], dtype='object')]
6.3 dtypes
Returns the data type for each column. Examples are as follows:
import pandas as pd
import numpy as np
d = {'Name':pd.Series(['c Chinese Language Web','Programming Help',"Baidu",'360 search','Google','Microscience Academy','Bing search']),
   'years':pd.Series([5,6,15,28,3,19,23]),
   'Rating':pd.Series([4.23,3.24,3.98,2.56,3.20,4.6,3.8])}
#structure DataFrame
df = pd.DataFrame(d)
#Output row, column labels
print(df.dtypes)
Output results:
Name       object
years       int64
Rating     float64
dtype:     object
6.4 empty
Returns a Boolean value that determines whether the output data object is empty or not, and True indicates that the object is empty.
import pandas as pd
import numpy as np
d = {'Name':pd.Series(['c Chinese Language Web','Programming Help',"Baidu",'360 search','Google','Microscience Academy','Bing search']),
   'years':pd.Series([5,6,15,28,3,19,23]),
   'Rating':pd.Series([4.23,3.24,3.98,2.56,3.20,4.6,3.8])}
#structure DataFrame
df = pd.DataFrame(d)
#Determine if the input data is empty
print(df.empty)
Output results:
Determine if the input object is empty:
False
6.5 ndim
Returns the dimension of the data object. The DataFrame is a two-dimensional data structure.
import pandas as pd
import numpy as np
d = {'Name':pd.Series(['c Chinese Language Web','Programming Help',"Baidu",'360 search','Google','Microscience Academy','Bing search']),
   'years':pd.Series([5,6,15,28,3,19,23]),
   'Rating':pd.Series([4.23,3.24,3.98,2.56,3.20,4.6,3.8])}
#structure DataFrame
df = pd.DataFrame(d)
#DataFrame Dimension
print(df.ndim)
Output results:
2
6.6 shape
Returns a tuple representing the DataFrame dimension. Returns a tuple of values (a,b), where a represents the number of rows and B the number of columns.
import pandas as pd
import numpy as np
d = {'Name':pd.Series(['c Chinese Language Web','Programming Help',"Baidu",'360 search','Google','Microscience Academy','Bing search']),
   'years':pd.Series([5,6,15,28,3,19,23]),
   'Rating':pd.Series([4.23,3.24,3.98,2.56,3.20,4.6,3.8])}
#structure DataFrame
df = pd.DataFrame(d)
#DataFrame Shape
print(df.shape)
Output results:
(7, 3)
6.7 size
Returns the number of elements in the DataFrame. Examples are as follows:
import pandas as pd
import numpy as np
d = {'Name':pd.Series(['c Chinese Language Web','Programming Help',"Baidu",'360 search','Google','Microscience Academy','Bing search']),
   'years':pd.Series([5,6,15,28,3,19,23]),
   'Rating':pd.Series([4.23,3.24,3.98,2.56,3.20,4.6,3.8])}
#structure DataFrame
df = pd.DataFrame(d)
#DataFrame Number of medium elements
print(df.size)
Output results:
21
6.8 values
Returns the data in the DataFrame as an array of ndarraies.
import pandas as pd
import numpy as np
d = {'Name':pd.Series(['c Chinese Language Web','Programming Help',"Baidu",'360 search','Google','Microscience Academy','Bing search']),
   'years':pd.Series([5,6,15,28,3,19,23]),
   'Rating':pd.Series([4.23,3.24,3.98,2.56,3.20,4.6,3.8])}
#structure DataFrame
df = pd.DataFrame(d)
#DataFrame Data
print(df.values)
Output results:
[['c Chinese Language Web' 5 4.23]
['Programming Help' 6 3.24]
['Baidu' 15 3.98]
['360 search' 28 2.56]
['Google' 3 3.2]
['Microscience Academy' 19 4.6]
['Bing search' 23 3.8]]
6.9 head() &tail() view data
If you want to view a portion of the DataFrame's data, you can use the head() or tail() methods. Where head() returns the first n rows of data and displays the first 5 rows by default. Examples are as follows:
import pandas as pd
import numpy as np
d = {'Name':pd.Series(['c Chinese Language Web','Programming Help',"Baidu",'360 search','Google','Microscience Academy','Bing search']),
   'years':pd.Series([5,6,15,28,3,19,23]),
   'Rating':pd.Series([4.23,3.24,3.98,2.56,3.20,4.6,3.8])}
#structure DataFrame
df = pd.DataFrame(d)
#Get the first three rows of data
print(df.head(3))
Output results:
     Name       years   Rating
0   c Chinese Language Web      5     4.23
1    Programming Help         6     3.24
2    Baidu          15     3.98
tail() returns n rows of data as follows:
import pandas as pd
import numpy as np
d = {'Name':pd.Series(['c Chinese Language Web','Programming Help',"Baidu",'360 search','Google','Microscience Academy','Bing search']),
   'years':pd.Series([5,6,15,28,3,19,23]),
   'Rating':pd.Series([4.23,3.24,3.98,2.56,3.20,4.6,3.8])}
#structure DataFrame
df = pd.DataFrame(d)
#Get the last 2 rows of data
print(df.tail(2))
Output results:
      Name     years   Rating
5     Microscience Academy      19     4.6
6    Bing search     23     3.8
6.10 shift() moves rows or columns
If you want to move a row/column in the DataFrame, you can use the shift() function. It provides a periods parameter that represents a specified step moving on a particular axis.
The syntax format of the shif() function is as follows:
DataFrame.shift(periods=1, freq=None, axis=0)
The parameters are as follows:
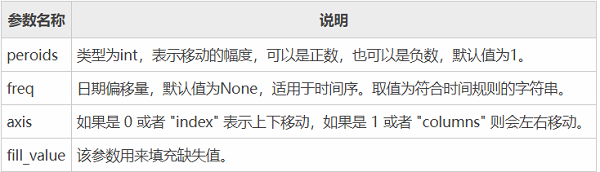
The return value of this function is the moved copy of the DataFrame. Let's look at a simple set of examples:
import pandas as pd
info= pd.DataFrame({'a_data': [40, 28, 39, 32, 18],
'b_data': [20, 37, 41, 35, 45],
'c_data': [22, 17, 11, 25, 15]})
#Move by 3
info.shift(periods=3)
Output results:
   a_data  b_data  c_data
0     NaN     NaN     NaN
1     NaN     NaN     NaN
2     NaN     NaN     NaN
3    40.0    20.0    22.0
4    28.0    37.0    17.0
Use fill_below The value parameter populates the missing values in the DataFrame as follows:
import pandas as pd
info= pd.DataFrame({'a_data': [40, 28, 39, 32, 18],
'b_data': [20, 37, 41, 35, 45],
'c_data': [22, 17, 11, 25, 15]})
#Move by 3
print(info.shift(periods=3))
#Replace missing and original values with 52
info.shift(periods=3,axis=1,fill_value= 52)
Output results:
Original output:
   a_data  b_data  c_data
0     NaN     NaN     NaN
1     NaN     NaN     NaN
2     NaN     NaN     NaN
3    40.0    20.0    22.0
4    28.0    37.0    17.0

Replaced output:
   a_data  b_data  c_data
0      52      52      52
1      52      52      52
2      52      52      52
3      52      52      52
4      52      52      52
Note: fill_ The value parameter can not only fill in missing values, but also replace the original data.