This article mainly explains the knowledge of distributed request link tracking Sleuth in spring cloud.
Reference article: https://www.yuque.com/sunxiaping/yg511q/xc44uq
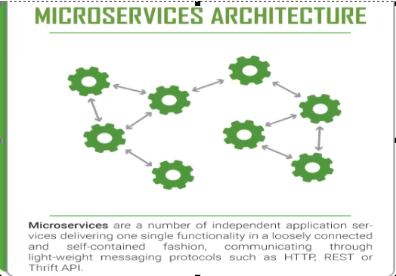
Problems under microservice architecture
-
In the microservicing construction of large-scale systems, a system will be divided into many modules. These modules are responsible for different functions, combined into a system, and finally can provide rich functions. In this architecture, a request often involves multiple services. The problem is that the software may be developed in different languages and deployed across several thousand data centers by different software teams
-
- How to find problems quickly?
-
- How to judge the fault influence range?
-
- How to sort out service dependence and the rationality of dependence?
-
- How to analyze link performance problems and real-time capacity planning?
-
Distributed tracking is to restore a distributed request to a calling link, log, monitor the performance, and display the call of a distributed request. For example, the time spent on each service node, the specific machine to which the request arrives, the request status of each service node, and so on.
-
At present, most of the popular link tracking systems in the industry, such as Zipkin of Twitter, eagle eye of Alibaba, Mtrace of meituan, cat of public comments, are based on dapper published by Google. Dapper described the concept, data display, buried point, transmission, collection, storage and display of link tracking in distributed systems, especially in micro service architecture.
Sleuth
Distributed request link tracking, very large system. When there are many micro service modules, such as 80 calling 8001 and 8001 calling 8002, a link is formed. If a link fails, we can use Sleuth to track the link to find the failed link.
In the microservice framework, a request initiated by the client will be called by multiple different service nodes in the back-end system to produce the final request result. Each previous request will form a complex distributed service call link. The high delay or error of any link in the link will cause the final failure of the whole request.
brief introduction
- The main function of Spring Cloud Sleuth is to provide tracking solutions in distributed systems, and it is compatible with zipkin. You only need to introduce corresponding dependencies in pom files.
- sleuth is responsible for tracking, while zipkin is responsible for displaying.
Related concepts
-
Spring Cloud Sleuth provides a distributed tracking solution for Spring Cloud. It borrows heavily from Google's Dapper design. You need to understand the terms and related concepts in Sleuth first.
-
Spring Cloud Sleuth uses the technical term of Dapper, Google's open source project.
-
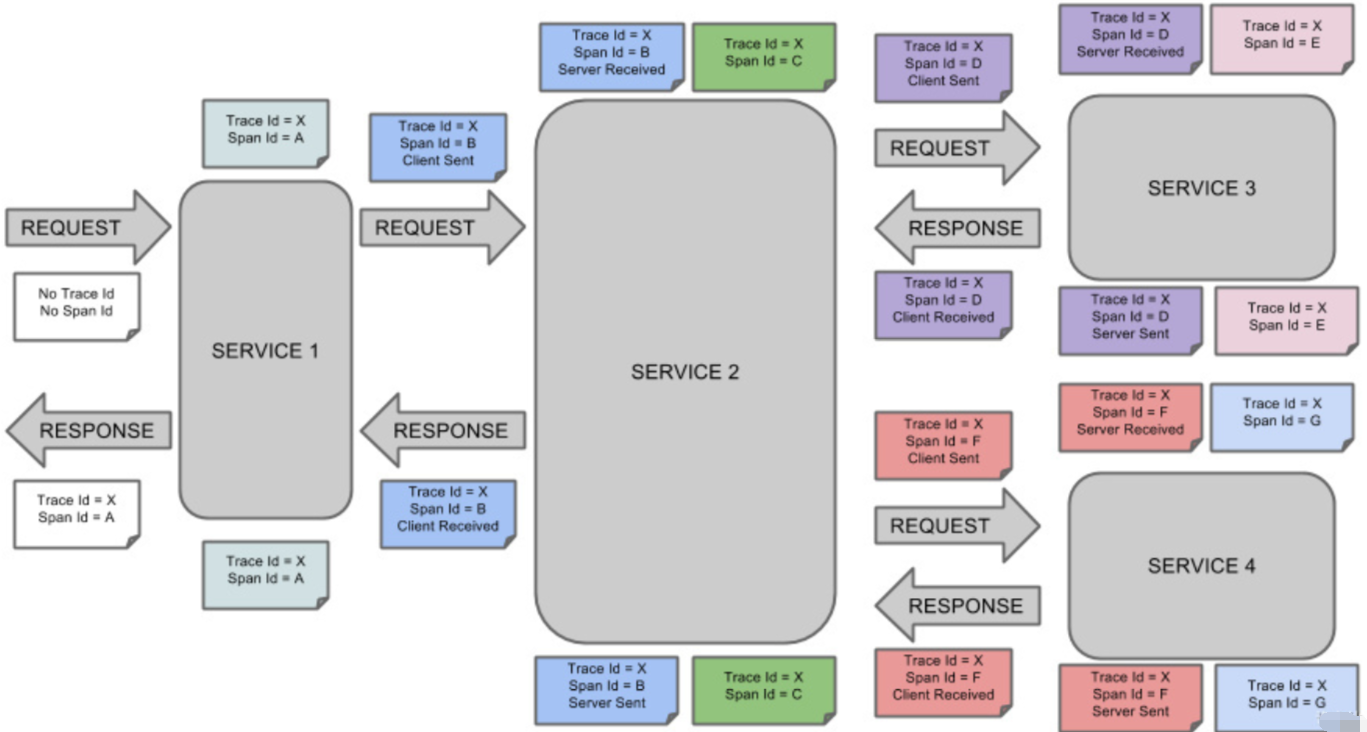
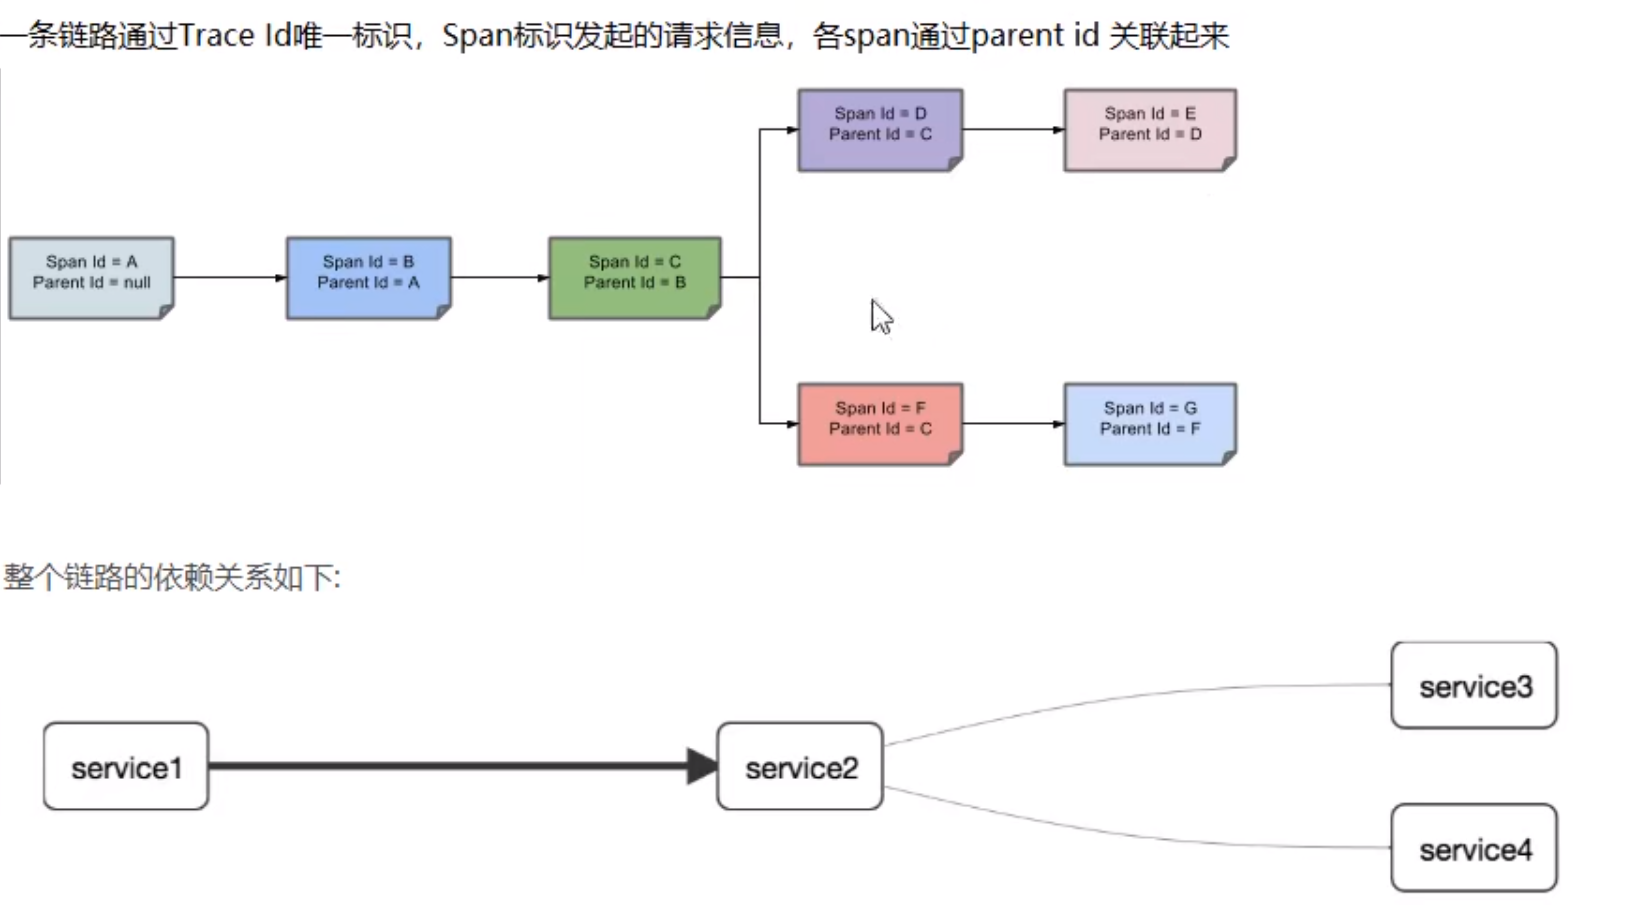
Span: basic work unit. For example, sending an RPC in a new span is equivalent to sending a response request to the RPC. Span is uniquely identified by a 64 bit ID, and trace is identified by another 64 bit ID. span also has other data information, such as summary, timestamp event, key value comments (tags), span ID and progress ID (usually IP address), Span records the time information while constantly starting and stopping. When you create a span, you must stop it at some time in the future.
-
Trace: a tree structure consisting of a series of span s. For example, when you are running a distributed big data project, you may need to create a trace.
-
Annotation: it is used to record the existence of an event in time. Some core annotations are used to define the beginning and end of a request.
-
- CS client server: the client sends a request. This annotation describes the beginning of the span.
-
- SR server received: the server obtains the request and is ready to start processing it. If the cs timestamp is subtracted from its srj, the network delay can be obtained.
-
- ss server sent: the annotation indicates the completion of the request processing (when the request returns to the client). If ss subtracts the sr timestamp, the processing time required by the server can be obtained.
-
- cr client received: indicates the end of span, and the client successfully receives the reply from the server. If cr subtracts the cs timestamp, all the time required for the client to obtain the reply from the server can be obtained.
After streamlining:
environment
zipkin Download
From springboot2 Since 0, the official no longer supports the use of self built Zipkin Server for service link tracking, but directly provides compiled jar packages for us to use. It can be downloaded from the official website Zipkin .
zipkin download address: Click me to download .
zipkin startup
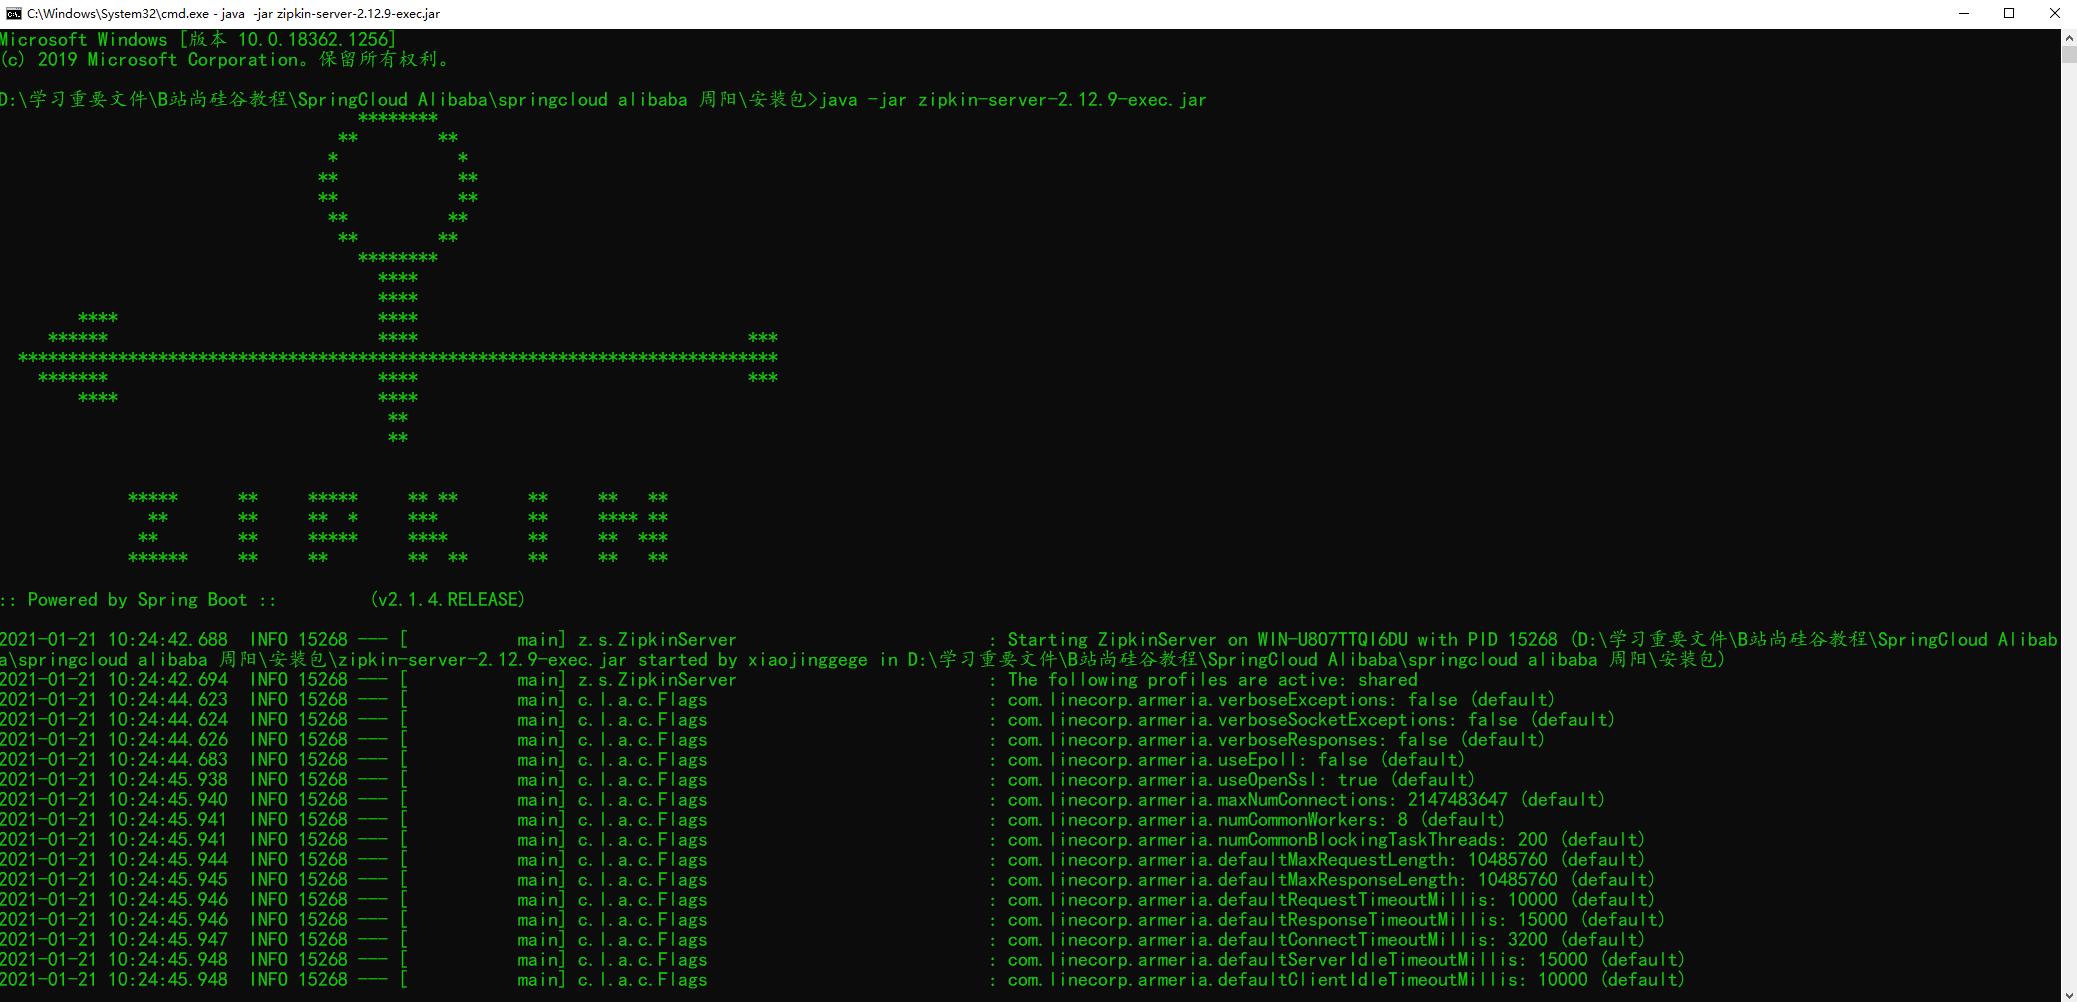
- On the command line, type Java - jar zipkin-server-2.12.9-exec Jar start Zipkin Server.
-
The default request port of Zipkin Server is 9411
-
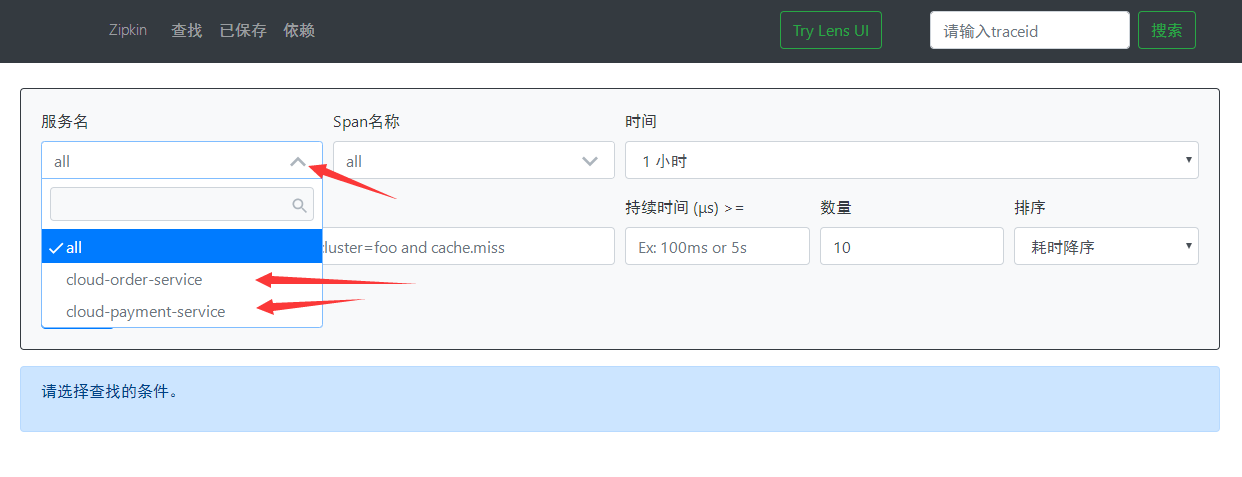
Enter in the browser http://localhost:9411 You can enter the management background of Zipkin Server.
Start Zipkin Server with Docker
docker run -d -p 9411:9411 --name zipkin openzipkin/zipkin:2.12.9
case
Use the previously created modules cloud provider payment8001 and cloud consumer order80 for transformation
Induced dependence
<!-- Contains sleuth + zipkin -->
<dependency>
    <groupId>org.springframework.cloud</groupId>
    <artifactId>spring-cloud-starter-zipkin</artifactId>
</dependency>
YML configuration
spring:
  # zipkin
  zipkin:
    base-url: http://localhost:9411/ # Zipkin Server request address
    sender:
      type: web # Data transmission mode: send data to Zipkin Server in the form of HTTP
  sleuth:
    sampler:
      probability: 1 # The default sampling ratio is 0.1, i.e. 10%. 1 is configured here to record all sleuth information in order to collect more data (for testing only)
   .......
consumer:
server:
  port: 80

spring:
  application:
    name: cloud-order-service
  zipkin:
    base-url: http://localhost:9411/ # Zipkin Server request address
    sender:
      type: web # Data transmission mode: send data to Zipkin Server in the form of HTTP
  sleuth:
    sampler:
      probability: 1 # The default sampling ratio is 0.1, i.e. 10%. 1 is configured here to record all sleuth information in order to collect more data (for testing only)

eureka:
  client:
    register-with-eureka: true
    fetch-registry: true
    service-url:
      defaultZone: http://eureka7001.com:7001/eureka/,http://eureka7002.com:7002/eureka/
Provider:
# Port number
server:
  port: 8001
spring:
  application:
    name: cloud-payment-service
  zipkin:
    base-url: http://localhost:9411/ # Zipkin Server request address
    sender:
      type: web # Data transmission mode: send data to Zipkin Server in the form of HTTP
  sleuth:
    sampler:
      probability: 1 # The default sampling ratio is 0.1, i.e. 10%. 1 is configured here to record all sleuth information in order to collect more data (for testing only)

  # data source
  datasource:
    type: com.alibaba.druid.pool.DruidDataSource
    driver-class-name: com.mysql.jdbc.Driver
    url: jdbc:mysql://localhost:3306/springcloud2020?useUnicode=true&characterEncoding=utf-8&useSSL=false
    username: root
    password: root

# mybatis related
mybatis:
  mapper-locations: classpath:mapper/*.xml
  type-aliases-package: com.itjing.springcloud.entities  # Package of all Entity alias classes

eureka:
  client:
    # Register with Eureka's Service Center
    register-with-eureka: true
    # Whether to retrieve the existing registration information from eureka. The default value is true. Single node doesn't matter. The cluster must be set to true to use load balancing with ribbon
    fetch-registry: true
    service-url:
      # Set the address to interact with Eureka Server
      defaultZone: http://eureka7001.com:7001/eureka/,http://eureka7002.com:7002/eureka/
    healthcheck:
      enabled: true # Start health check (relying on spring boot actuator)
  instance:
    instance-id: payment8001
    prefer-ip-address: true # The access path can display the ip address
    # The time interval between Eureka client sending heartbeat to server, unit: seconds (default: 30 seconds)
    lease-renewal-interval-in-seconds: 10
    # The upper limit of waiting time of Eureka server after receiving the last heartbeat, in seconds (the default is 90 seconds, and the service will be excluded in case of timeout)
    lease-expiration-duration-in-seconds: 20
Business class
Add a simple request in the Controller of 8001
@GetMapping("/payment/zipkin")
public String paymentZipkin() {
    return "hi,i'm paymentzipkin server fall back, ha-ha~";
}
Add request in Controller of 80
@GetMapping("/consumer/payment/zipkin")
public String paymentZipkin() {
    String result = restTemplate.getForObject(PAYMENT_URL + "/payment/zipkin", String.class);
    return result;
}
test
- Start eureka 7001
- Start provider 8001
- Start consumer 80
Make 80 visit 8001 several times: http://localhost/consumer/payment/zipkin
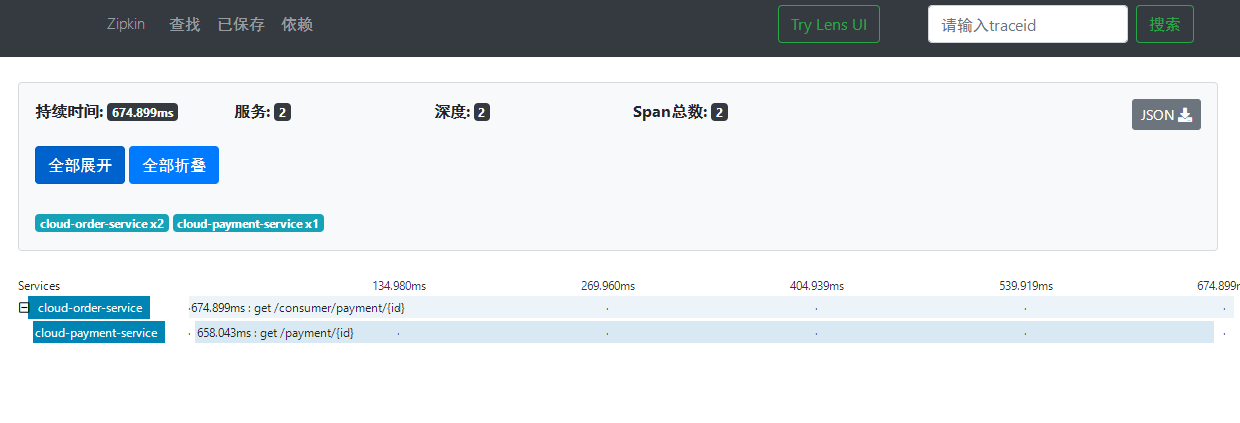
visit: http://localhost:9411/zipkin/ , check the situation
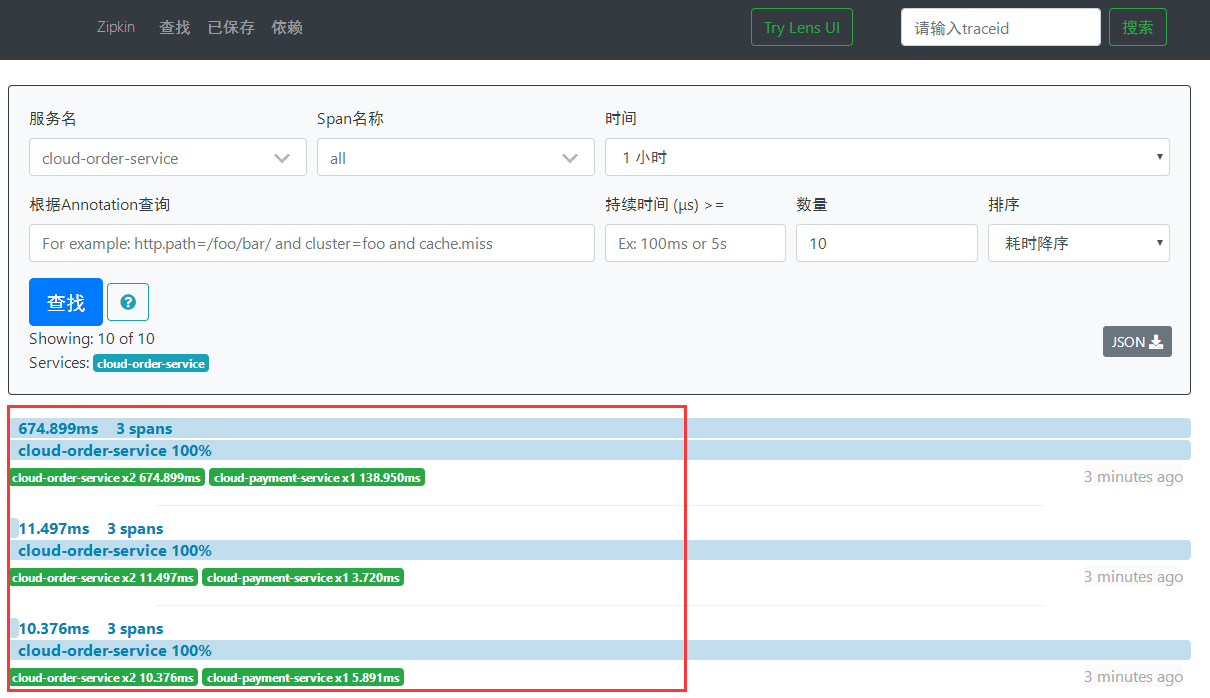
Click this trace to see the details of the request: