preface
Summarize some commands commonly used at ordinary times, not detailed explanations of commands, but continuous updates
1.nc command
nc is short for netcat
yum -y insatll nc

function
  (1)Network port connectivity
    nc -vz -w 1 192.168.1.129 3306                  Centos6
    nc -w 1 192.168.1.129 3306 </dev/null           Centos7
  (2)file transfer
    nc -l 10000 >a.txt        A The machine opens a port(arbitrarily)
    nc A machine ip 10000 <a.txt     B The machine sends data to the via port 10000 A transfer files
  (3)speed test
    yum -y install dstat
    nc -l 10000 >/dev/null      A The machine opens a port
    nc A machine ip 10000 < dev/zero B Machine image A The machine transmits data indefinitely
    dstat View the network card in B Data sent and in A Received data
  (4) nc -4u 192.168.1.129 162    send out udp data
  (5) nc -vuz 192.168.1.129 162   test udp Port connectivity
2. dstat command
yum -y install dstat

  dstat The command has default options and cannot be executed dstat The command does not add any parameters, and it collects data by default-cpu-,-disk-,-net-,-paging-,-system-Data,
  Collect once a second. Default input dstat Equal to input dstat -cdngy 1 or dstat -a 1.

  Common options:
    -c,--cpu   Statistics CPU Status, including user, system, idle(Idle wait time (percentage), wait(Wait for disk IO)Etc;
      -d, --disk Statistics of disk read and write status
      -D  total,sda Statistics the specified disk or summary information
      -l, --load Count the system load, including the average value of 1 minute, 5 minutes and 15 minutes
      -m, --mem Statistics of system physical memory usage, including used, buffers, cache, free
      -s, --swap Statistics swap Used and remaining
      -n, --net Statistics of network usage, including receiving and sending data
      -N  eth1,total  Statistics eth1 Interface summary flow
      -r, --io Statistics I/O Requests, including read and write requests
      -p, --proc Statistical process information, including runnable,uninterruptible,new
      -y, --sys Statistics system information, including interrupt and context switching
      -t  Display the statistical time, which is very useful for analyzing historical data
          --fs Count the number of files opened and inodes number

  Common commands:
    dstat -cmsdnl
3. Dial test
Domain name return code
curl -I -m 10 -o /dev/null -s -w %{http_code} domain name(port)
4.dd command generates files
dd if=/dev/zero of=/testblock bs=1M count=3

if: inputfile
of: outputfile
bs: blocksize
5. Temporarily configure the ip address on the command line
ifconfig eth0 192.168.1.10/24     # Change ip

ip a a 1.1.1.1/24 dev eth0        # Add ip
6. Add a route temporarily from the command line
route add -net 192.168.2.0/24 gw 192.168.2.254

route add –net 180.200.0.0 netmask 255.255.0.0 gw 10.200.6.201 dev eth0 metric 1

Command format:
route [-f] [-p] [Command [Destination] [mask Netmask] [Gateway] [metric Metric]] [if Interface]]

Parameters:
add:Add a new route.
del:Delete a route.
-net:The destination address is a network.
-host:The destination address is a host.
netmask:When adding a network route, you need to use a netmask.
gw:Route packets through the gateway. Note that the gateway you specify must be reachable.
metric: Set the number of routing hops.
Command Specify the command you want to run (Add/Change/Delete/Print).
Destination Specify the network destination for this route.
mask Netmask Specifies the netmask (also known as subnet mask) associated with the network target.
Gateway Specifies the forward or next hop that can be reached by the address set and subnet mask defined by the network target IP Address.
metric Metric Specify an integer cost value for the route (from 1 to 9999), when in the route table(Best match with the destination address of the forwarded packet)Can be used when selecting from multiple routes.
if Interface Specifies the interface index for the interface that can access the target. To get a list of interfaces and their corresponding interface indexes, use route print Display function of the command. You can use decimal or hexadecimal values for interface indexing.
7. Modify firewalld policy
firewall-cmd --list-all

firewall-cmd --zone=public --add-port=22/tcp --permanent # New port

firewall-cmd --zone= public --remove-port=80/tcp --permanent # delete a port

firewall-cmd --reload #Overload effective
8.cut command
Intercept information
cut -d'Separator character' -f fields
 Common options:
-d  : Followed by a separator character. And -f Use together;
-f  : basis -d The separator character of divides a piece of information into several segments -f Take out the meaning of the paragraph;
-b Which character is selected
-c How many characters are selected

echo "a:b:c" |cut -d: -f2

echo "a:b:c" |cut -b 3

echo "a:b:c" |cut -c 1-3
9.diff command
diff -w a.txt b.txt

> 111
< 44

"<"express a.txt Yes, but b.txt It does not contain;">"express a.txt No, but b.txt contain.

diff -w a.txt b.txt | grep \^\<    Output only a.xt There are, but b.txt File content not included

diff -w a.txt b.txt | grep \^\>    Output only b.xt There are, but a.txt File content not included
10.wc command
It is mainly used for statistics, such as the number of lines and characters
Common options:
-c The number of bytes of the printed document, one English letter is 1 byte, and one Chinese character accounts for 2-4 Bytes (according to encoding)
-m The number of characters in the printed document, one Chinese character accounts for 2 characters
-l How many lines are printed
-L Print the length of the longest line, or count the string length

wc -l  file # Count file lines

echo "hello" |wc -L # Get string length
11.sort command
Mainly used for sorting
Common options:
-f Ignore letter case
-M According to month comparison, for example JAN,DEC
-h Compare according to the size of readable units, such as 2 K,1G
-g Sort by regular value
-n Compare by string value
-r Reverse sort
-k Position 1,Which column does position 2 sort by
-t Specify separator
-u Go back again

du -sh * |sort -k1 -hr  # Sort by file size

echo -e "1\n1\n2\n3\n3" |sort -u  # duplicate removal
12.uniq command
It is mainly used for de duplication and counting the number of repetitions
Common options:
-c Number of printing occurrences
-d Print only duplicate lines
-u Print only non repeating lines
-D Print only duplicate lines and print all duplicate lines
-f N Skip before comparison N column
-i ignore case
-s N Skip before comparison N Characters
-w N For each line N The contents after characters are not compared

cat file
abc
cde
cde
xyz
xyz
abd

sort file |uniq # duplicate removal
abc
abd
cde
xyz

sort file |uniq -c # Prints the number of occurrences per line
1 abc
1 abd
2 cde
2 xyz

sort file |uniq -u # Print rows without duplicate data
abc
abd

sort file |uniq -d # Print rows with duplicate data
cde
xyz

sort file |uniq -d -c # Print rows with duplicate data and print the number of repetitions
2 cde
2 xyz
13.join command
Connect two files
Common options:
-i ignore case
-o Display according to the specified file field

cat file1
1 a
2 b
3 c

cat file2
1 x
2 y
3 z

join file1 file2  # Merge the same fields of two files into one column
1 a x
2 b y
3 c z


join -o 1.2 2.2 file1 file2 # Print the second column of file1 and the second column of file2:
a x
b y
c z
14.wget command
The command line is used for downloading
Common options:
-b, --background Background operation
 Logging and input files:
-o, --output-file=FILE Log write to file
-a, --append-output=FILE Append log to file
-d, --debug Print debug Information, including header information
-q, --quiet Exit, no output
-i, --input-file=FILE Read from file URL download
 Download options:
-t, --tries=NUMBER Set link retries
-O, --output-document=FILE Write content to file
-nc, --no-clobber Skip downloading existing files
-c, --continue Breakpoint continuation
 Server response header information
--spider Don't download anything
-T, --timeout=SECONDS Set the corresponding timeout (and--dns-timeout,--connect-timeout and
--read-timeout)
-w, --wait=SECONDS Wait time between retries
--limit-rate=RATE Limit download speed
 catalog:
-P, --directory-prefix=PREFIX Save file directory
FTP Options:
--ftp-user=USER set up ftp user name
--ftp-password=PASS set up ftp password
--no-passive-ftp Disable passive transmission mode

wget http://nginx.org/download/nginx-1.11.7.tar.gz # download files

wget -b http://nginx.org/download/nginx-1.11.7.tar.gz # background download

wget --ftp-user=admin --ftp-password=admin ftp://192.168.x.x/file/downloan.file # ftp download file
15.curl command
Similar to HTTP client, it realizes the function of browser
Common options:
-k, --insecure allow HTTPS Connect website
-C, --continue-at Breakpoint continuation
-b, --cookie STRING/FILE Read from file cookie
-c, --cookie-jar hold cookie Save to file
-D, --dump-header Save header information to file
-H, --header Send custom header information to the server
-I, --head see HTTP Header information
-o, --output FILE output to a file
-x, --proxy [PROTOCOL://]HOST[:PORT] use agent
-U, --proxy-user USER[:PASSWORD] Proxy user name and password
-O, --remote-name Write locally using the name on the remote server
--connect-timeout Connection timeout in seconds
--retry NUM Connection retries
--retry-delay Wait time between retries
-s, --silent Silent mode, no output
-Y, --speed-limit Limit download rate
-u, --user USER[:PASSWORD] appoint http and ftp User name and password

curl -o badu.html http://www.baidu.com # download page

curl -O ftp://user:pass@ip/a.txt # ftp download
curl ftp://ip/filename -u user:pass -o filename # ftp download
16.iconv command
Convert character set
Common options:
-l Lists all known character sets
-f Original text encoding
-t Output coding
-o output to a file

iconv -f gbk -t utf8 old.txt -o new.txt # Convert character set

echo $(echo "content" | iconv -f utf8 -t gbk) # Prevent SMS or email from being garbled
17.ss command
Powerful socket viewing tool
Common options:
-n Do not resolve names
-a Show all socket
-l Display all monitored socket
-e display socket detailed information
-m display socket Memory usage
-p Displays the information used by the process socket
-i Show internal TCP information
-s display socket Use summary
-4 Show only IPV4 of socket
-0 Display package socket
-t Show only TCP socket
-u Show only UDP socket
-d Show only DCCP socket
-w Show only RAW socket
-x Show only Unix field socket
-D The original TCP socket Dump to file
 Filtering:
-o state display TCP Connection status information

ss -t -a # Show all TCP connections

ss -u –a # Show all UDP connections

ss -s # Display socket Usage Summary

ss -o state established # Show all established connections

ss -o state TIME-WAIT # Display all TIME-WAIT status
18.vmstat command
Get statistics of memory, swap, cpu, io, etc
Common options:
-a Print active and inactive memory pages
-d Print hard disk statistics
-D Print hard disk table
-p Print hard disk partition statistics
-s Print virtual memory table
-m Print memory allocation( slab)information
-t Add timestamp to output
-S Display units, default k,KB,m,M,Capital is*1024

vmstat -t 1 5
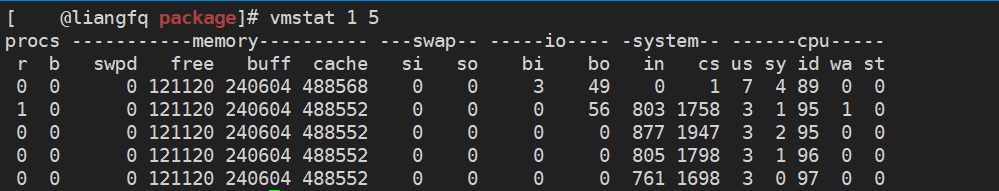
Detailed explanation:
r: CPU Number of running processes
b: Waiting I/O Number of processes
swpd: Swap memory used( kb)
free: Free physical memory( kb)
buff: Buffer memory used( kb);Generally, the device data is cached and the data written to the disk.
cache: Buffer memory used( kb);Generally, the file data is cached and the data read from the disk.
si: Number of swap pages swapped from disk to memory( kb/s)
so: Swap page data swapped from memory to disk( kb/s)
bi: Number of blocks received by the block device( kb/s)
bo: Number of blocks sent by the block device( kb/s)
in: Per second CPU Interrupt times
cs: Per second CPU Context switching times
us: User process usage CPU Time(%)
sy: System process usage CPU Time(%)
id: CPU Idle time(%)
wa: wait for I/O Response consumed CPU Time(%)
st: Time obtained from virtual device(%)
19.iostat command
Output cpu load and disk io
Common options:
-c display CPU Utilization rate
-d Show disk usage only
-k Company KB/s replace Block/s
-m Company MB/s replace Block/s
-N Displays all mapped device names
-t Print report time
-x Show extended statistics
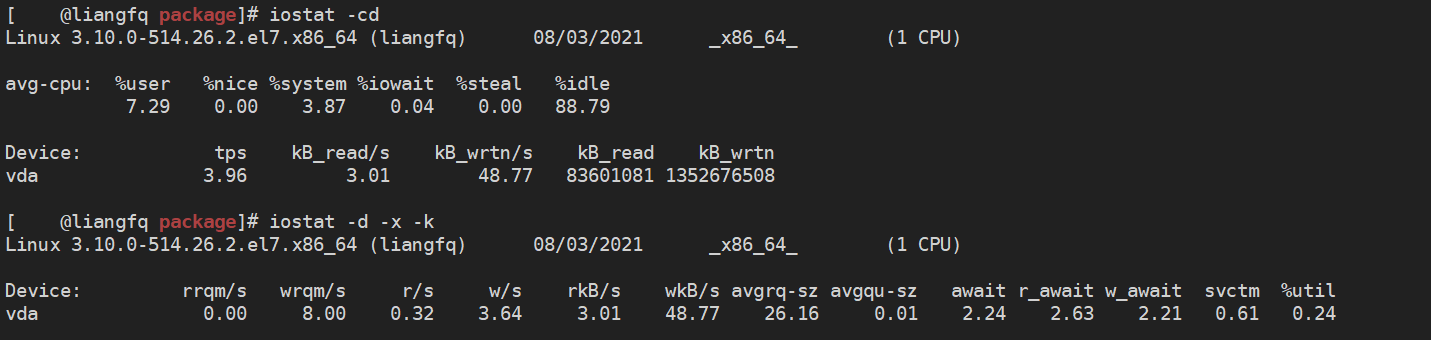
rrqm/s:   Per second merge Number of read operations. Namely delta(rmerge)/s
wrqm/s:  Per second merge Number of write operations. Namely delta(wmerge)/s
r/s:           Reads completed per second I/O Number of devices. Namely delta(rio)/s
w/s:         Writes completed per second I/O Number of devices. Namely delta(wio)/s
rsec/s:    Number of sectors read per second. Namely delta(rsect)/s
wsec/s:  Number of sectors written per second. Namely delta(wsect)/s
rkB/s:     Reads per second K Number of bytes. yes rsect/s Because the size of each sector is 512 bytes.(Need calculation)
wkB/s:    Write per second K Number of bytes. yes wsect/s Half.(Need calculation)
avgrq-sz: Average per device I/O Data size of the operation (a sector). delta(rsect+wsect)/delta(rio+wio)
avgqu-sz:average I/O Queue length. Namely delta(aveq)/s/1000 (because aveq Is in milliseconds).
await:    Average per device I/O Wait time for operation (millisecond). Namely delta(ruse+wuse)/delta(rio+wio)
svctm:   Average per device I/O Service time of operation (millisecond). Namely delta(use)/delta(rio+wio)
%util:      What percentage of a second is spent I/O Operation, or how much time is there in a second I/O The queue is not empty. Namely delta(use)/s/1000 (because use Is in milliseconds) If %util Close to 100%,Description generated I/O Too many requests, I/O The system is full and the disk
 Possible bottlenecks
20.tcpdump command
Capture and analyze packets
tcpdump [ option ] [ -c quantity ] [ -i network interface ] [ -w file name ] [ expression ]

Common options:
-l: Change standard output to buffered line form
-c: Packet capture times
-nn: Directly IP and Port Number Display instead of the host name and service name
-s : <Packet size> Set the size of each packet
-i: Specifies the network interface to listen on
-r: Reads the package from the specified file
-w: Save the output information to the specified file
-a: Convert network address and broadcast address into name
-d: The code matching the information package is given in an assembly format that people can understand
-e: Print the header information of the data link layer on the output line
-f: External Internet The address is printed out in digital form
-t: No time stamp is printed on each line of output
-v : Output slightly detailed message information; Add one v More detailed

tcpdump -c10 -nn tcp port 22 -i ens33 and source 192.168.1.129 # Grab from 192.168 1.129 packet to port 22 of ens33 network card

tcpdump -i ens33 tcp port 22 and host 192.168.1.129 -w /tmp/tmp.file # Grab host 192.168 1.129all packets on port 22 of ens33 network card are saved in / TMP / tmp file

tcpdump port 80 # Grab all packets of port 80

tcpdump src 192.168.1.129 # Grab from 192.168 All packets of 1.129
21.nmap command
Detect whether the host is online, scan the open port of the host and sniff network services for network detection and security scanning
Nmap [ Scan type ] [ General options ] { Scan target description }

Common options:
-sT: TCP connect()Scanning, this is the most basic TCP Scanning mode, used to create a TCP If the connection is successful, it is considered that the target port is listening. Otherwise, it is considered that there is no listener on the target port. This scan is easy to detect, and a large number of connection requests and error messages will be recorded in the log of the target host.
-sS: TCP Synchronous scanning(TCP SYN),Send to target only SYN Packet, if received SYN/ACK The response packet considers that the target port is listening and disconnects immediately; Otherwise, it is considered that there is no listener on the target port. So this technique is often called half open scanning(half-open). The biggest advantage of this technology is that few systems can record this in the system log. But you need root Permission to customize SYN Data packet.
-sF,-sX,-sN: secret FIN Packet scanning, Christmas tree(Xmas Tree),empty(Null)Scan mode. The theoretical basis of these scanning methods is that the closed port needs to respond to your probe packet RST Packets, and the open port must ignore the problematic packets. Through this scanning, it can be indirectly used to detect the robustness of the firewall.
-sP: ping Scan, with ping Method to check which hosts on the network are running. When the host is blocked ICMP  echo Request package is ping The scan is invalid. nmap In any case ping Scanning: subsequent scanning will be performed only when the target host is running.
-sU: UDP Scan, if you want to know what is available on a host UDP Service, you can use this option.
-sA: ACK Scanning, this advanced scanning method can usually be used to pass through the firewall.
-sW: Sliding window scanning, very similar to ACK Scan for.
-sR: RPC Scanning, combined with other different port scanning methods.
-b: FTP Rebound attack(bounce attack),Connect to one behind the firewall FTP The server acts as an agent, and then performs port scanning.

-n: Do not reverse DNS Parsing to speed up scanning
-P0: Before scanning, do not ping host; Some network firewalls may prohibit ICMP Request package, which can be skipped using this scan type ping test
-PT: Before scanning, use TCP ping Determine which hosts are running.
-PS: about root User, this option allows nmap use SYN Package instead of ACK Package to scan the target host.
-PI: Set this option so that nmap Use real ping(ICMP echo request)To scan whether the target host is running.
-PB: This is the default ping Scan options. It uses ACK(-PT)and ICMP(-PI)Two scan types scan in parallel. If the firewall can filter one of the packets, using this method, you can pass through the firewall.
-O: This option activates the pair TCP/IP Fingerprint feature(fingerprinting)Scan to get the flag of the remote host, that is, the operating system type.
-I: open nmap Reverse flag scanning function.
-f: Use fragments IP Packet sending SYN,FIN,XMAS,NULL. Packets make it more difficult for packet filtering and intrusion detection systems to know your attempt.
-v: It is highly recommended to use this option, which will give detailed information during the scanning process.
-S <IP>: In some cases, nmap Your source address may not be determined(nmap I'll tell you). In this case, use this option to give your IP Address.
-g port: Set the source port of the scan. Some naive firewall and packet filter rule sets allow the source port to be DNS(53)perhaps FTP-DATA(20)The package is connected through and. Obviously, if the attacker changes the source port to 20 or 53, the firewall protection can be destroyed.
-oN: Redirect the scan results to a readable file logfilename Yes.
-oS: Scan results are output to standard output.
-A: Turn on operating system detection and version detection.

-iL filename: from filename Read the target of the scan from the file.
-iR: Give Way nmap Randomly select the host for scanning.
-p: Port, this option allows you to select the range of port numbers to be scanned. Multiple ports can be separated by commas, and a minus sign connects a port range, which is specified in front of the list T: express TCP Port, U: express UDP port
-exclude: Exclude specified host
-exclude file: Exclude hosts from the specified file

nmap -sT -PO 10.50.133.222 # Probe host survival and listening port

nmap -sS -n -p 22 10.50.133.0/24 # Scan whether the host of a network segment opens port 22

nmap -O -n 10.50.133.222 # Get operating system and kernel

nmap –sS 10.50.133.0/24 # Detect the open service of a network segment
22. Format conversion from windows text to linux
Method 1:
:set fileformat=unix

Method 2:
:%s/\r*$//  #^ M can be replaced \ r
23.jvm garbage collection statistics jstat
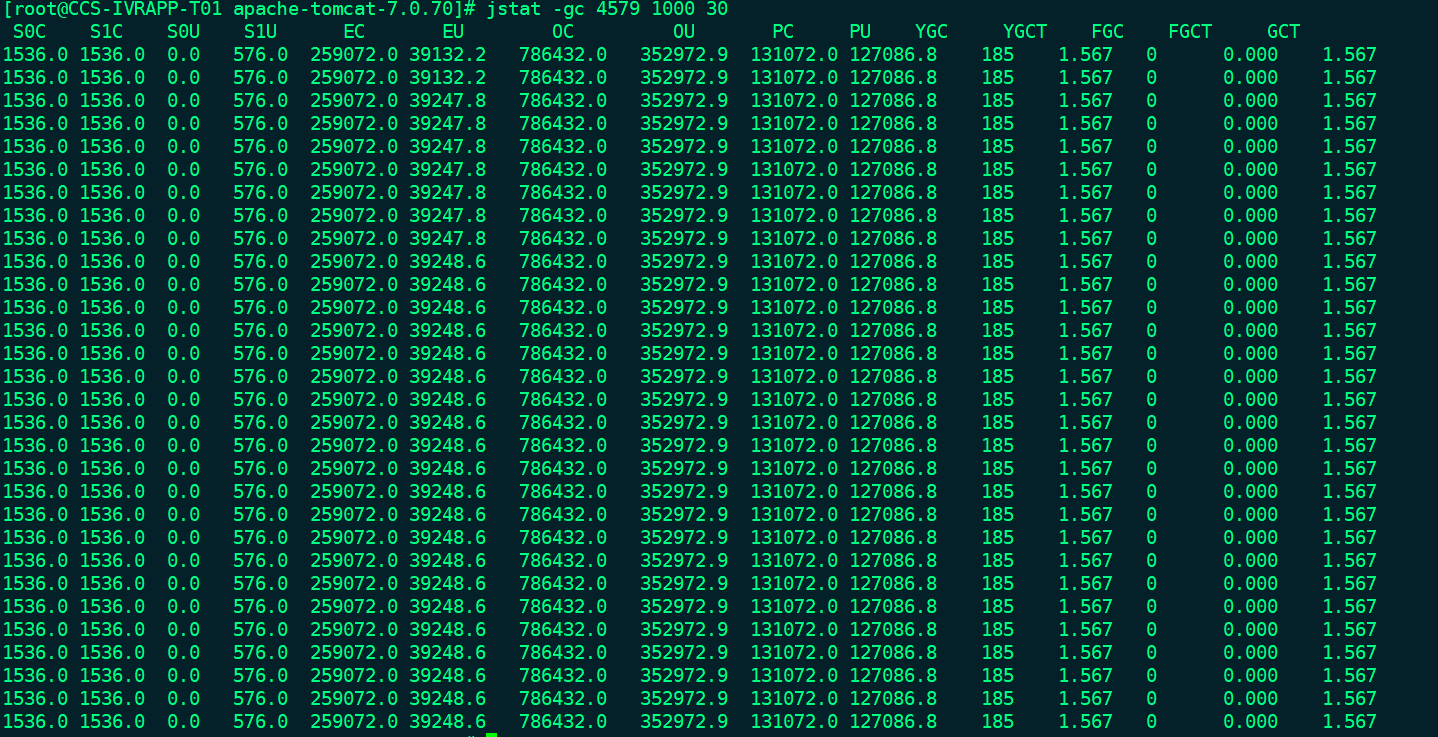
jstat -gc <pid> <time> <count>
pid Process number
time Refresh time unit ms 1000 It's 1 s
count Printing times


S0C: The first of the younger generation survivor(Capacity of surviving area)( KB)
S1C: The second of the younger generation survivor(Capacity of surviving area) (KB)
S0U : The first of the younger generation survivor(Surviving area) currently used space (KB)
S1U : The second of the younger generation survivor(Surviving area) currently used space (KB)
EC : Young generation Eden(Capacity of Eden (KB)
EU : Young generation Eden(Eden) currently used space (KB)
OC : Old Generation capacity (KB)
OU : Old Space currently used by generation (KB)
MC: metaspace(Meta space)Capacity of (KB)
MU: metaspace(Meta space)Currently used space (KB)
YGC : From application startup to sampling in the younger generation gc frequency
YGCT : From application startup to sampling in the younger generation gc Time taken(s)
FGC : From application startup to sampling old generation(whole gc)gc frequency
FGCT : From application startup to sampling old generation(whole gc)gc Time taken(s)
GCT: From application startup to sampling gc Total time spent(s)
24. View jvm details jmap
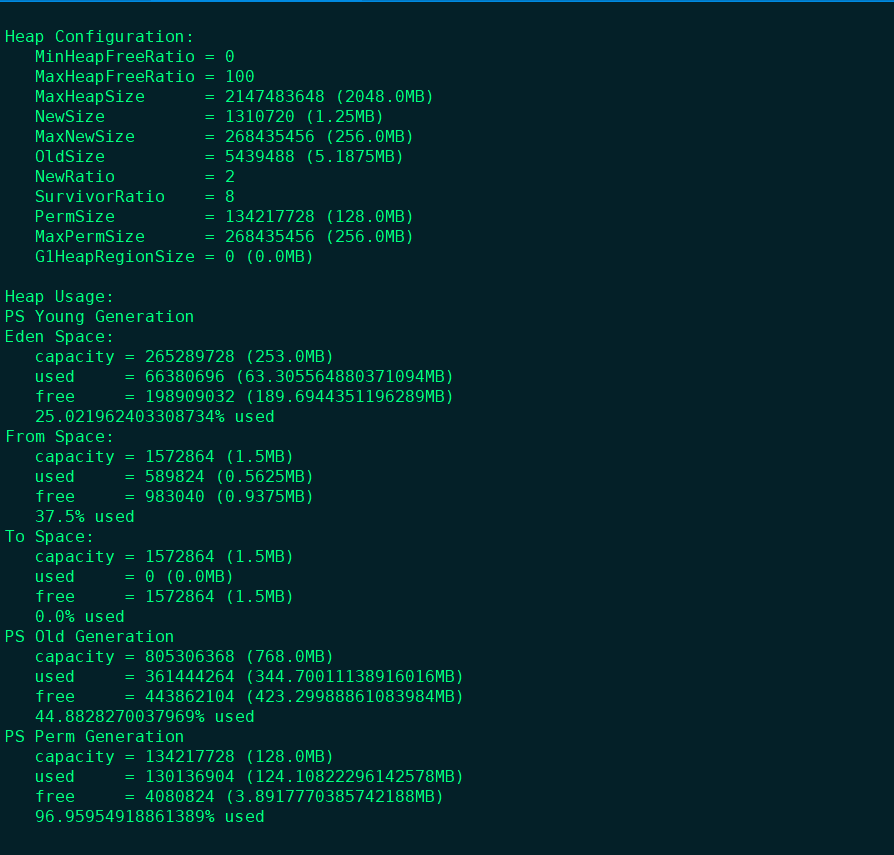
jmap  -heap  <pid>
Heap Configuration: # Stack configuration, that is, JVM parameter configuration
   MinHeapFreeRatio = 0 # Minimum heap usage ratio
   MaxHeapFreeRatio = 100 # Maximum heap usable ratio
   MaxHeapSize      = 2147483648 (2048.0MB) # Maximum heap space size
   NewSize          = 1310720 (1.25MB) # Cenozoic allocation size
   MaxNewSize       = 268435456 (256.0MB) # Maximum allocable space size of Cenozoic
   OldSize          = 5439488 (5.1875MB) # Old age size
   NewRatio         = 2 # The ratio of Cenozoic generation to old generation is 1:3
   SurvivorRatio    = 8 # Ratio of Cenozoic to suvivor
   PermSize         = 134217728 (128.0MB) # perm area permanent generation size
   MaxPermSize      = 268435456 (256.0MB) # The maximum allocable perm area is the permanent generation size
   G1HeapRegionSize = 0 (0.0MB)

Heap Usage: # Heap usage [actual usage of heap memory]
PS Young Generation # Cenozoic era
Eden Space: # Eden District Eden District
   capacity = 265289728 (253.0MB) # eden area size
   used     = 66380696 (63.305564880371094MB) # Used size
   free     = 198909032 (189.6944351196289MB) # Remaining size
   25.021962403308734% used # Utilization rate
From Space: # Survival area survivor0
   capacity = 1572864 (1.5MB) # Survivor0 area size
   used     = 589824 (0.5625MB) # Used size
   free     = 983040 (0.9375MB) # Remaining size
   37.5% used # Utilization rate
To Space: # Survivor1
   capacity = 1572864 (1.5MB) # Survivor1 area size
   used     = 0 (0.0MB) # Used size
   free     = 1572864 (1.5MB) # Remaining size
   0.0% used # Utilization rate
PS Old Generation # Old age
   capacity = 805306368 (768.0MB) # Old age size
   used     = 361444264 (344.70011138916016MB) # Used size
   free     = 443862104 (423.29988861083984MB) # Remaining size
   44.8828270037969% used # Utilization rate
PS Perm Generation # Permanent generation
   capacity = 134217728 (128.0MB) # Permanent generation size
   used     = 130136904 (124.10822296142578MB) # Used size
   free     = 4080824 (3.8917770385742188MB) # Remaining size
   96.95954918861389% used # Utilization rate
25.lsof command
lsof (list open files) is a tool to list the open files of the current system. In linux environment, everything exists in the form of files. Through files, you can access not only conventional data, but also network connections and hardware.
lsof -p <pid>  # View the open files and associated processes of a program
lsof -p 10000

lsof -i:<port> # View port listening
lsof -i:22

lsof <filesystem> # Check who is using the file system (good for mount and umount)
lsof /dev

lsof +d <dir> # View the files opened by the process in the directory
lsof /var/log
lsof data recovery:
When the file is being used (written or read) by the program, we rm the file. The file will not be deleted directly from the disk, but still exists in the disk. Because the program does not know that the file has been deleted, it will continue to write or read the file descriptor of the file. The file we delete is like a soft connection of the file descriptor, and the connection is deleted, The source file is still there. We can see that the file is deleted in the process.
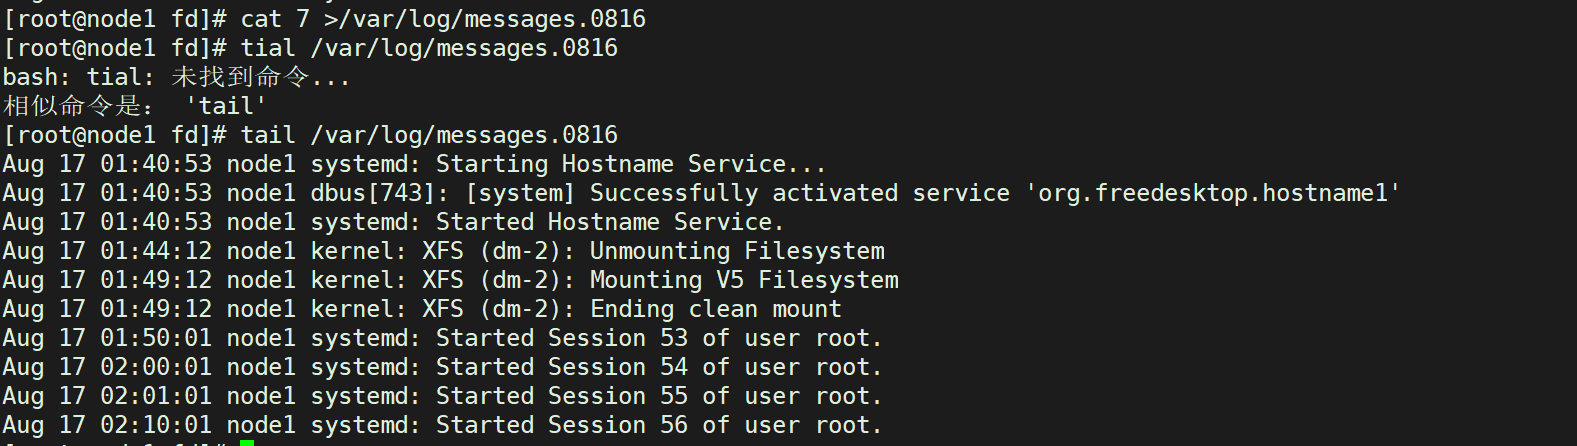
rm -f /var/log/messages
lsof  |grep /var/log/messages

Here is also a good analysis of why the space is not released after rm loses the file when our file system is highly used. The space is not released until the program is restarted. Because we don't delete files essentially, what we delete is just like a soft connection. Now we know that there is a file descriptor in the file content. We only need to restore the data stored in it to a file to realize the file recovery.
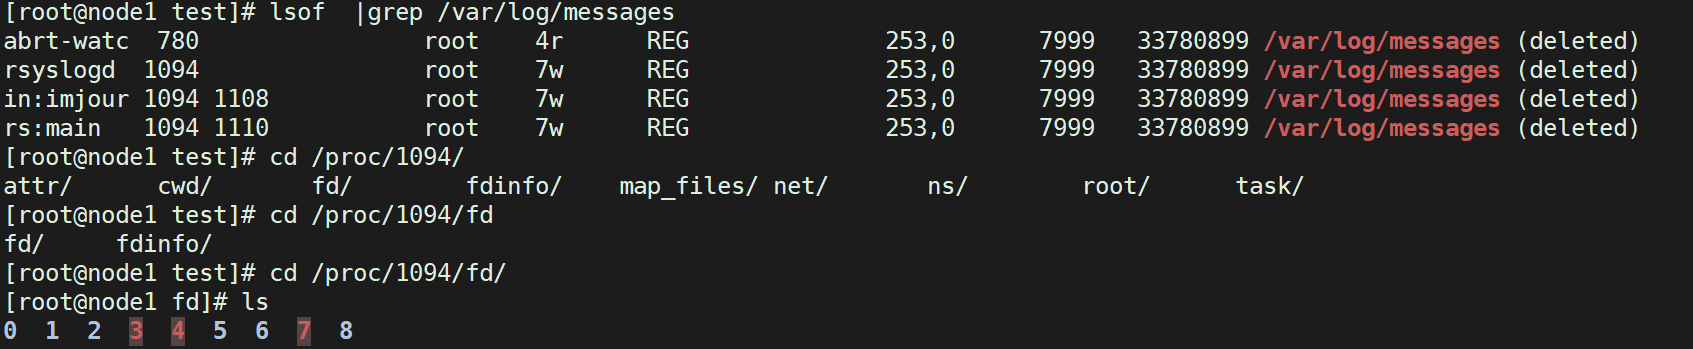
We use lsof to view the file descriptor used by the program, that is, 7. Let's look at the content of 7, that is, the message log
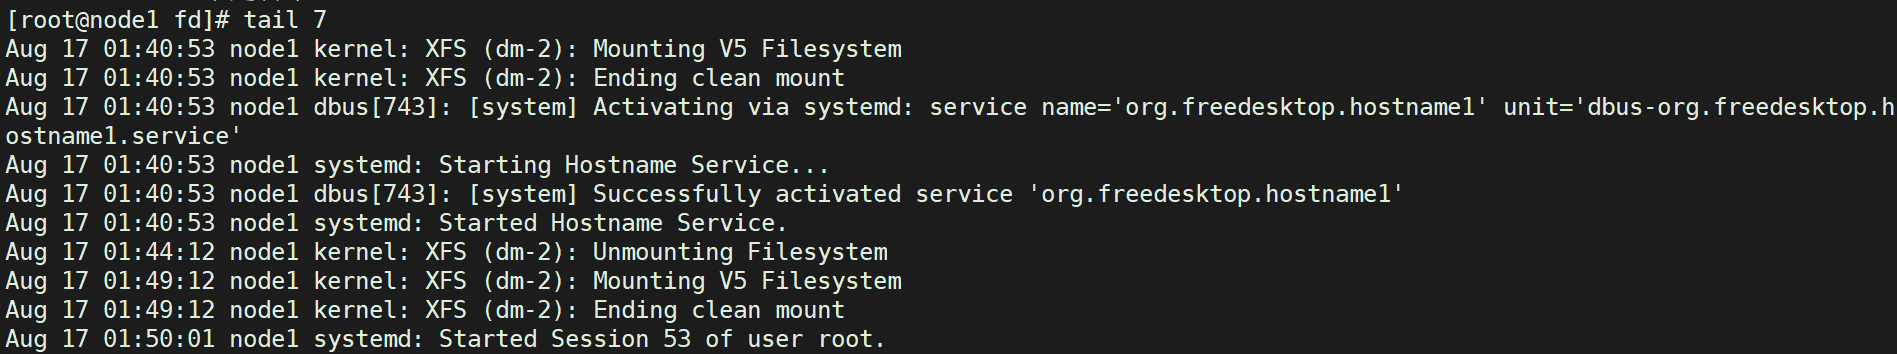
At this point, we can redirect the file contents to another file to realize file recovery (the host time is inaccurate, there is no timing, and the time is ignored)