What is elk:
ELK consists of three open source tools: Elastic Search, Logstash and Kiabana.
1) Elastic Search is an open source distributed search server based on Lucene. Its features are: distributed, zero configuration, automatic discovery, index automatic segmentation, index copy mechanism, restful style interface, multiple data sources, automatic search load, etc. It provides a full-text search engine with distributed multi-user capabilities, based on RESTful web interface. Elastic search, developed in Java and released as open source under the Apache license, is the second most popular enterprise search engine. Design for cloud computing, can achieve real-time search, stable, reliable, fast, easy to install and use.
In elastic search, all nodes have equal data.
2) Logstash is a fully open source tool that collects, filters and analyses your logs, supports a large number of data acquisition methods, and stores them for future use (such as search). When it comes to search, logstash comes with a web interface to search and display all logs. The general working mode is c/s architecture. client side is installed on the host which needs to collect logs. server side is responsible for filtering and modifying the logs received by each node and sending them to elastic search.
3) Kibana is an Elastic search front-end display tool based on browser pages, as well as an open source and free tool. Kibana can provide log analysis friendly Web interface for Logstash and Elastic Search, which can help you summarize, analyze and search important data logs.
A complete centralized logging system needs to include the following main features:
1) Collection - the ability to collect log data from multiple sources
2) Transport - the ability to stably transfer log data to the central system
3) Storage - How to Store Log Data
4) Analysis - UI analysis can be supported
5) Warning - error reporting, monitoring mechanism
ELK provides a whole set of solutions, and all of them are open source software, which can be used in conjunction with each other perfectly and efficiently to meet the needs of many applications. At present, a mainstream log system.
The working principle of ELK is as follows:
Log stash collects the logs generated by AppServer and stores them in the Elastic Search cluster, while Kibana queries the data from the ES cluster to generate graphs and returns them to Browser.
Environmental Science
Prepare two servers
One server: 192.168.80.100
One server: 192.168.80.101
Download and unzip
mkdir /usr/local/work //Create directories for elk
mkdir /usr/local/java /// Create directories for java
tar xf jdk-8u144-linux-x64.tar.gz -C /usr/local/java
tar xf kibana-6.2.3-linux-x86_64.tar.gz -C /usr/local/work/
tar xf logstash-6.2.3.tar.gz -C /usr/local/work/
tar xf elasticsearch-6.2.3.tar.gz -C /
Build java environment
cd /opt/
cp -r jdk1.8.0_144/ /usr/local/java
vi /etc/profile //Added at the end of the document
export JAVA_HOME=/usr/local/java
export JRE_HOME=/usr/local/java/jre
export PATH=$PATH:/usr/local/java/bin
export CLASSPATH=./:/usr/local/java/lib:/usr/local/java/jre/lib
java environment takes effect
source /etc/profile
View the java version
java -version
Create user
Elastic Serach requires that it be started as a non-root, so create a user:
Group add elastic search // create user groups
Useradd-g elastic search elastic search // create users
Modify the user group to elastic search-6.2.3
chown -R elasticsearch.elasticsearch /usr/local/work/elasticsearch-6.2.3
Modify host name
hostnamectl set-hostname elk-server
vi /etc/security/limits.conf Newly added
- soft nofile 65536
- hard nofile 131072
- soft nproc 2048
- hard nproc 4096
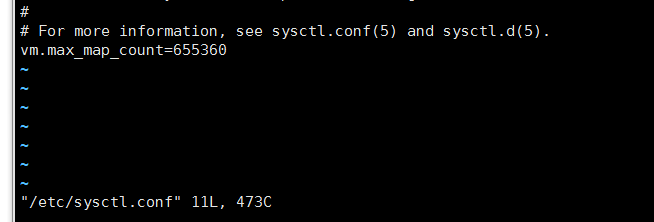
vi /etc/sysctl.conf Newly added
vm.max_map_count=655360
sysctl -p //Take effect
Reset computer

Start Elastic Serach
su - elasticsearch //Switching users
cd /usr/local/work/elasticsearch-6.2.3
bin/elasticsearch -d //start-up
tail -f /usr/local/work/elasticsearch-6.2.3/logs/elasticsearch.log //view log
Switch to root
curl 127.0.0.1:9200
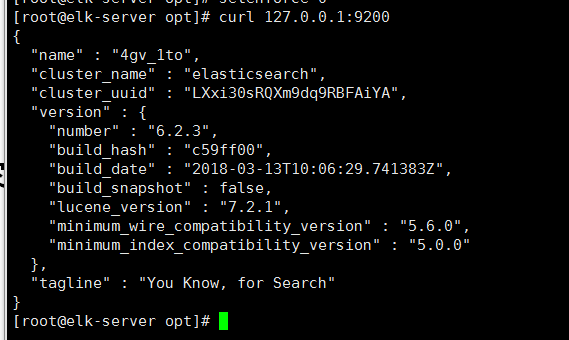
So far, the Elastic Serach service started successfully, followed by Logstash
cd /usr/local/work/logstash-6.2.3
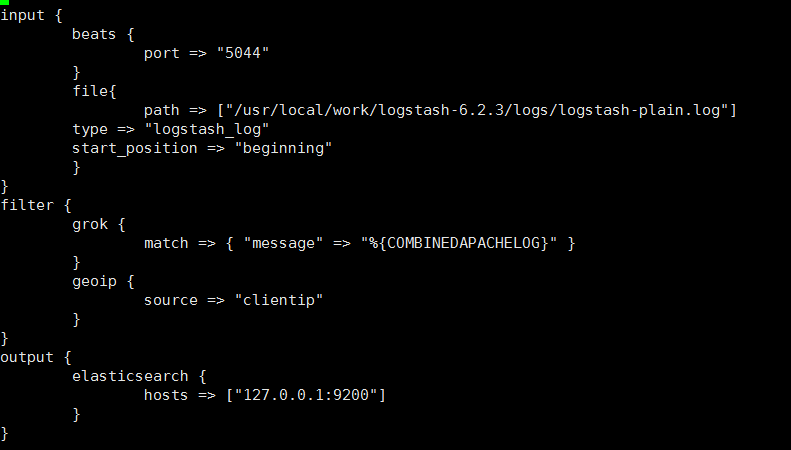
vi default.conf
input {
beats {
port => "5044"
}
file{
path => ["/usr/local/work/logstash-6.2.3/logs/logstash-plain.log"]
type => "logstash_log"
start_position => "beginning"
}
}
filter {
grok {
match => { "message" => "%{COMBINEDAPACHELOG}" }
}
geoip {
source => "clientip"
}
}
output {
elasticsearch {
hosts => ["127.0.0.1:9200"]
}
}
Start logstash
bin/logstash -f default.conf //- f Specifies configuration file startup
tail -f logs/logstash-plain.log //View configuration files
Configure and start Kibana
cd /usr/local/work/kibana-6.2.3-linux-x86_64/
vi config/kibana.yml
server.host: "192.168.80.100"
server.port: "5601"
start-up
nohup bin/kibana &
tail -f nohup.out //See
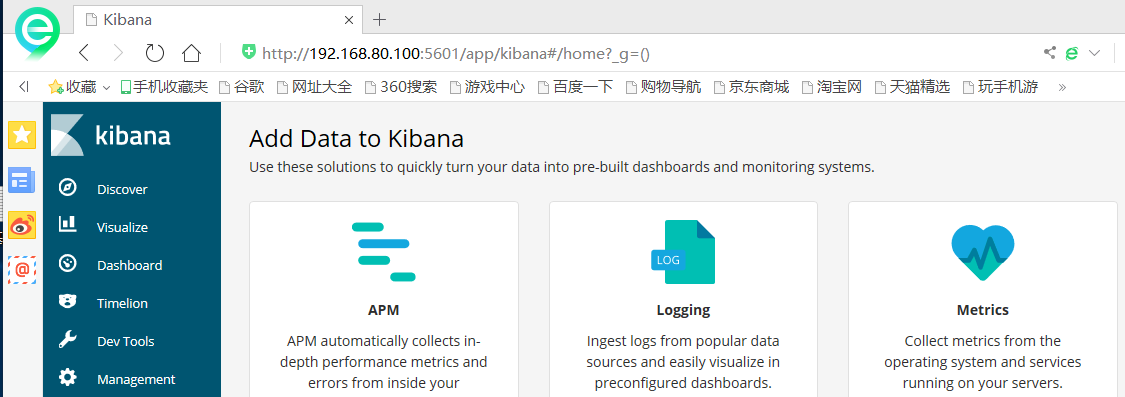
Access http://192.168.80.100:5601 in browser
Configure nginx-server
yum -y install epel-release //Installation source
yum -y install nginx httpd-tools //Installation package
start nginx
systemctl start nginx
Tools for collecting logs using filebeat
mkdir /usr/local/work/
tar xf filebeat-6.2.3-linux-x86_64.tar.gz -C /usr/local/work/
cd /usr/local/work/filebeat-6.2.3-linux-x86_64/
vi filebeat.yml
enabled: true
- var/log/.log => - /usr/local/nginx/logs/.log
output.elasticsearch: Add one to the front“#"Annotate
hosts: ["localhost:9200"] Add one to the front“#" Annotate
#output.logstash Remove commentary symbols
#Host: ["localhost:5400"] Remove the comment symbol and change it to ["192.168.80.100:5400"]
start-up FileBeat: ./filebeat -e -c filebeat.yml -d "publish"
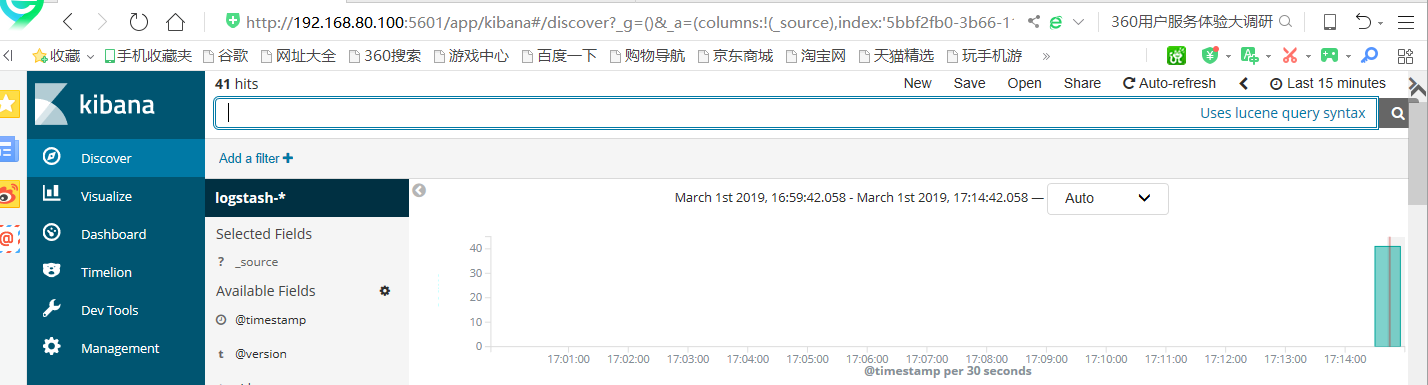
Access the nginx service several times through the browser, which can create more access logs
 Visit Kibana: http://192.168.80.100:5601
 Click on Discover in the upper left corner
 You can see that the access log has been collected by ELK.
Enter logstash - *, and click "Next step"
Select Time Filter and click "Create index pattern"

Click on the "Discover" button in the upper left corner to see the latest log information.

So far, we can find Nginx's access log on ELK.
Since then, elk has been completed