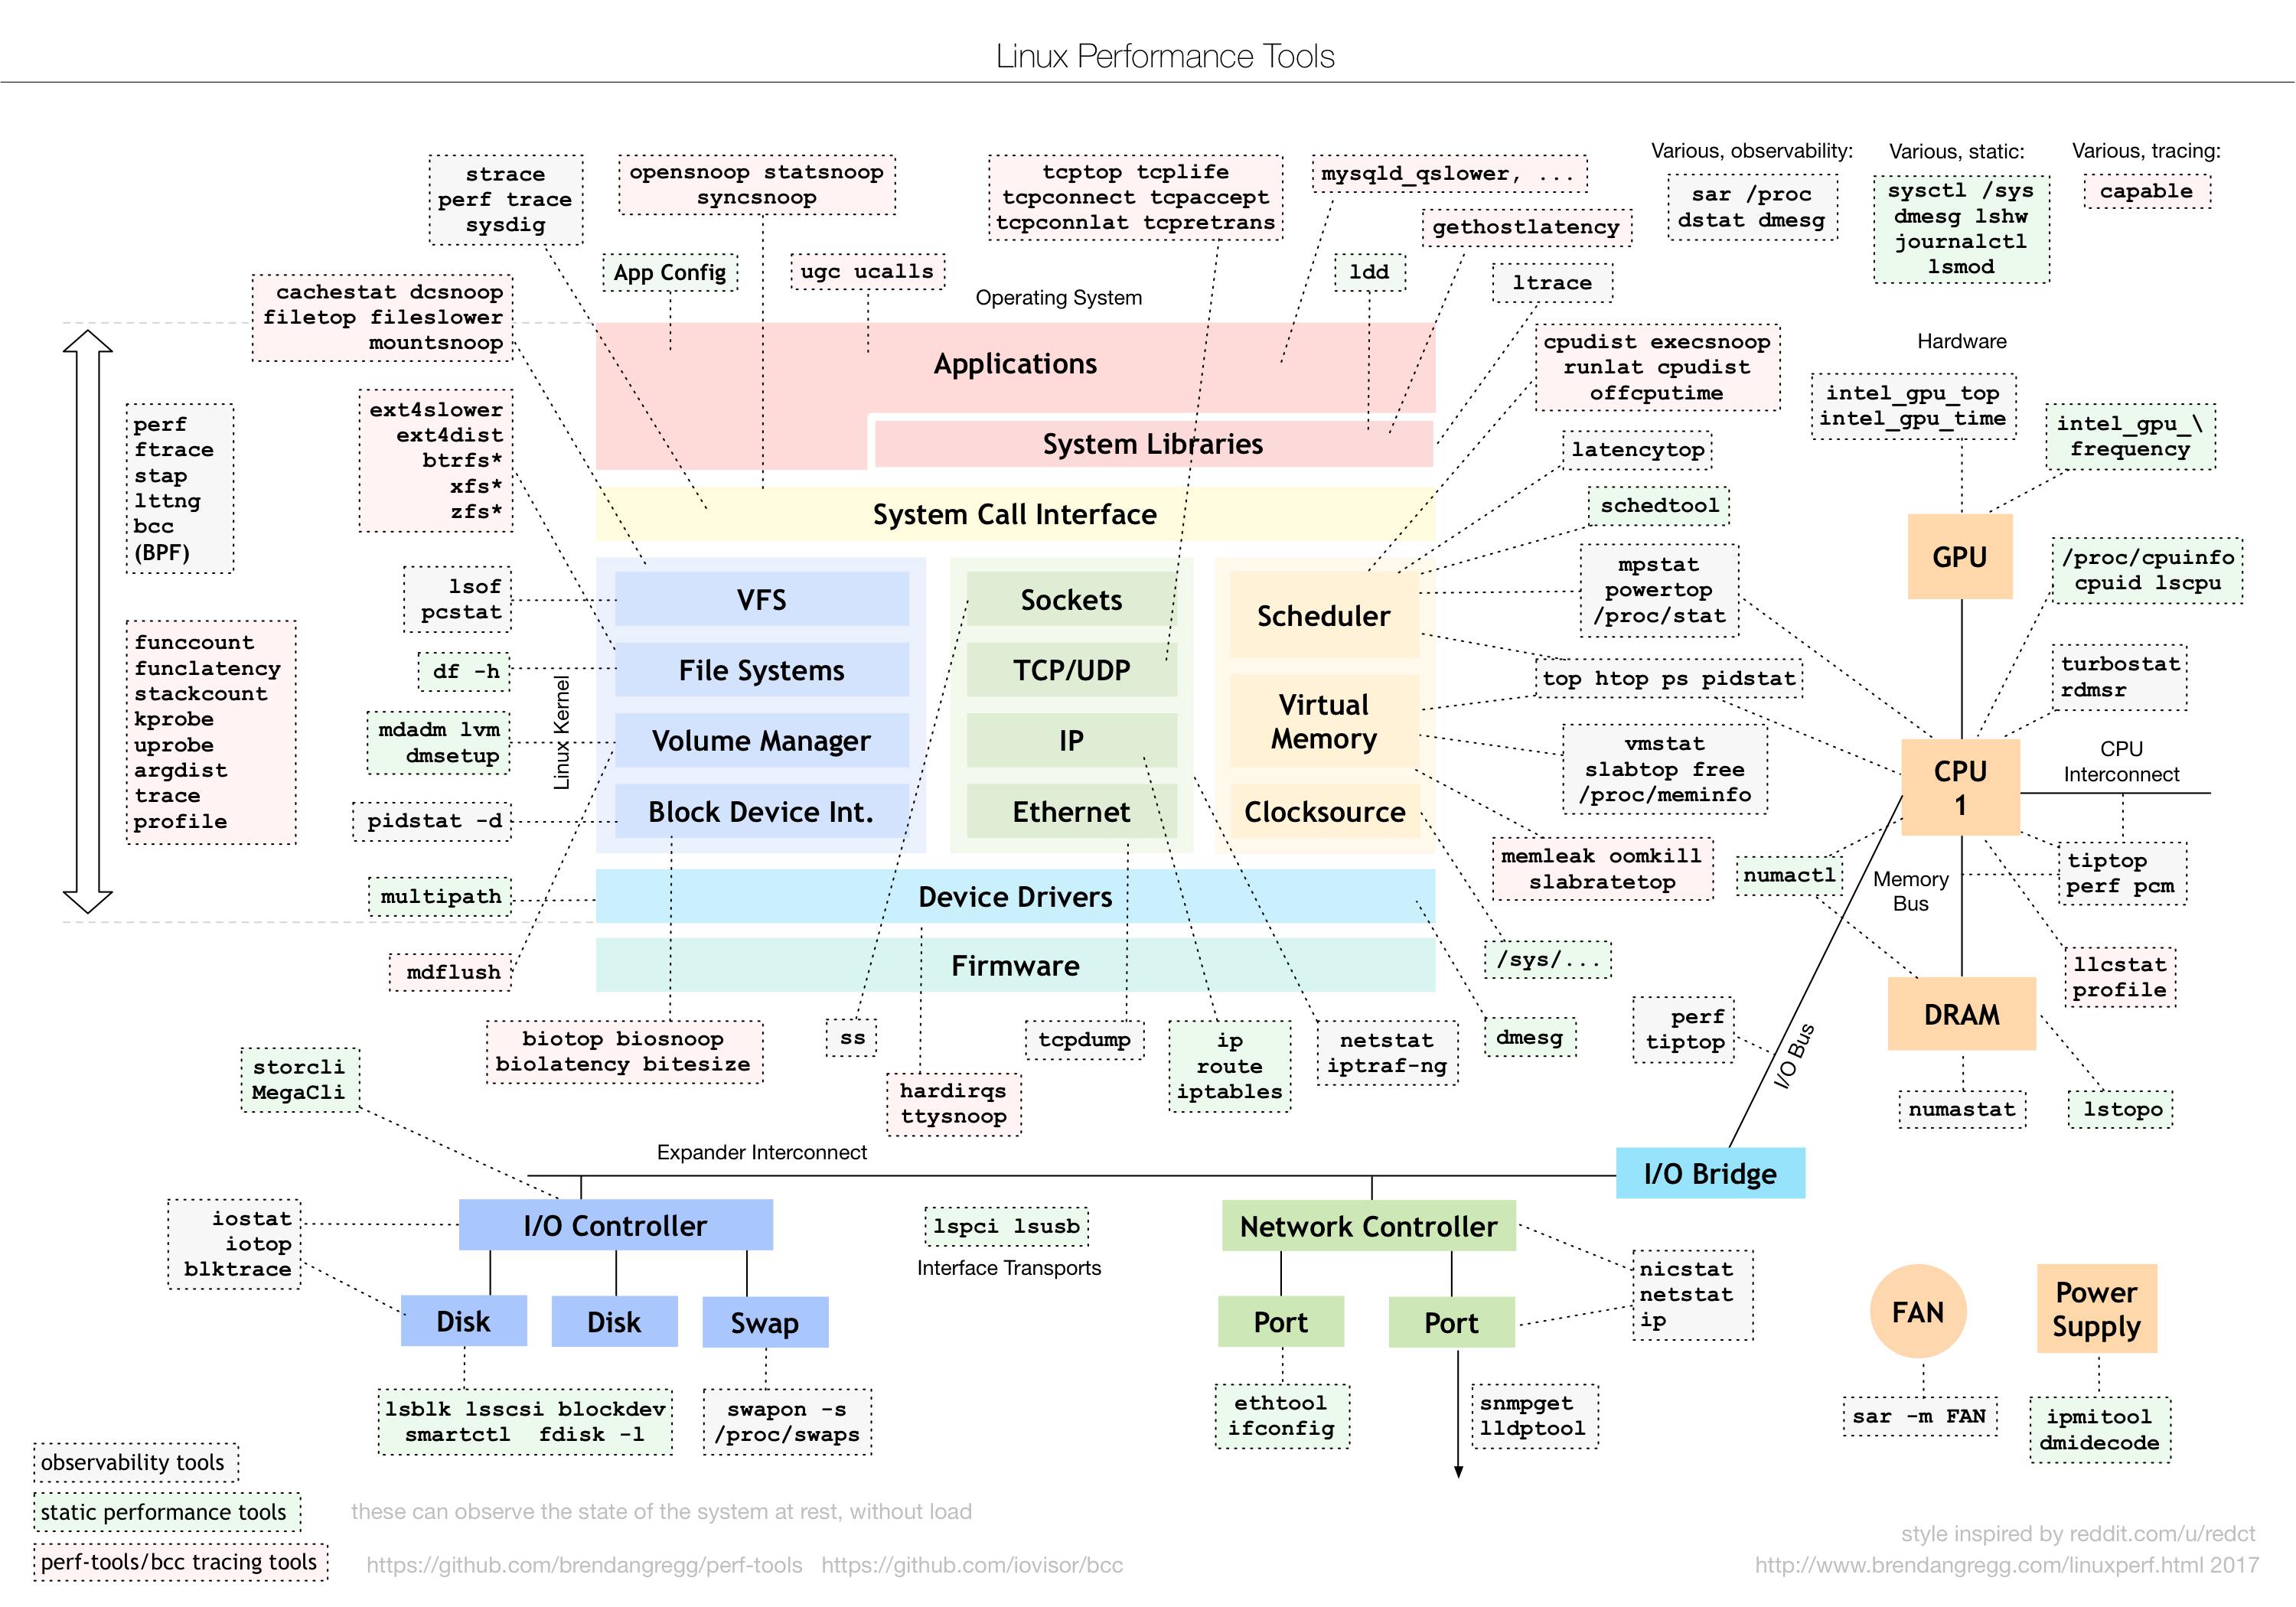
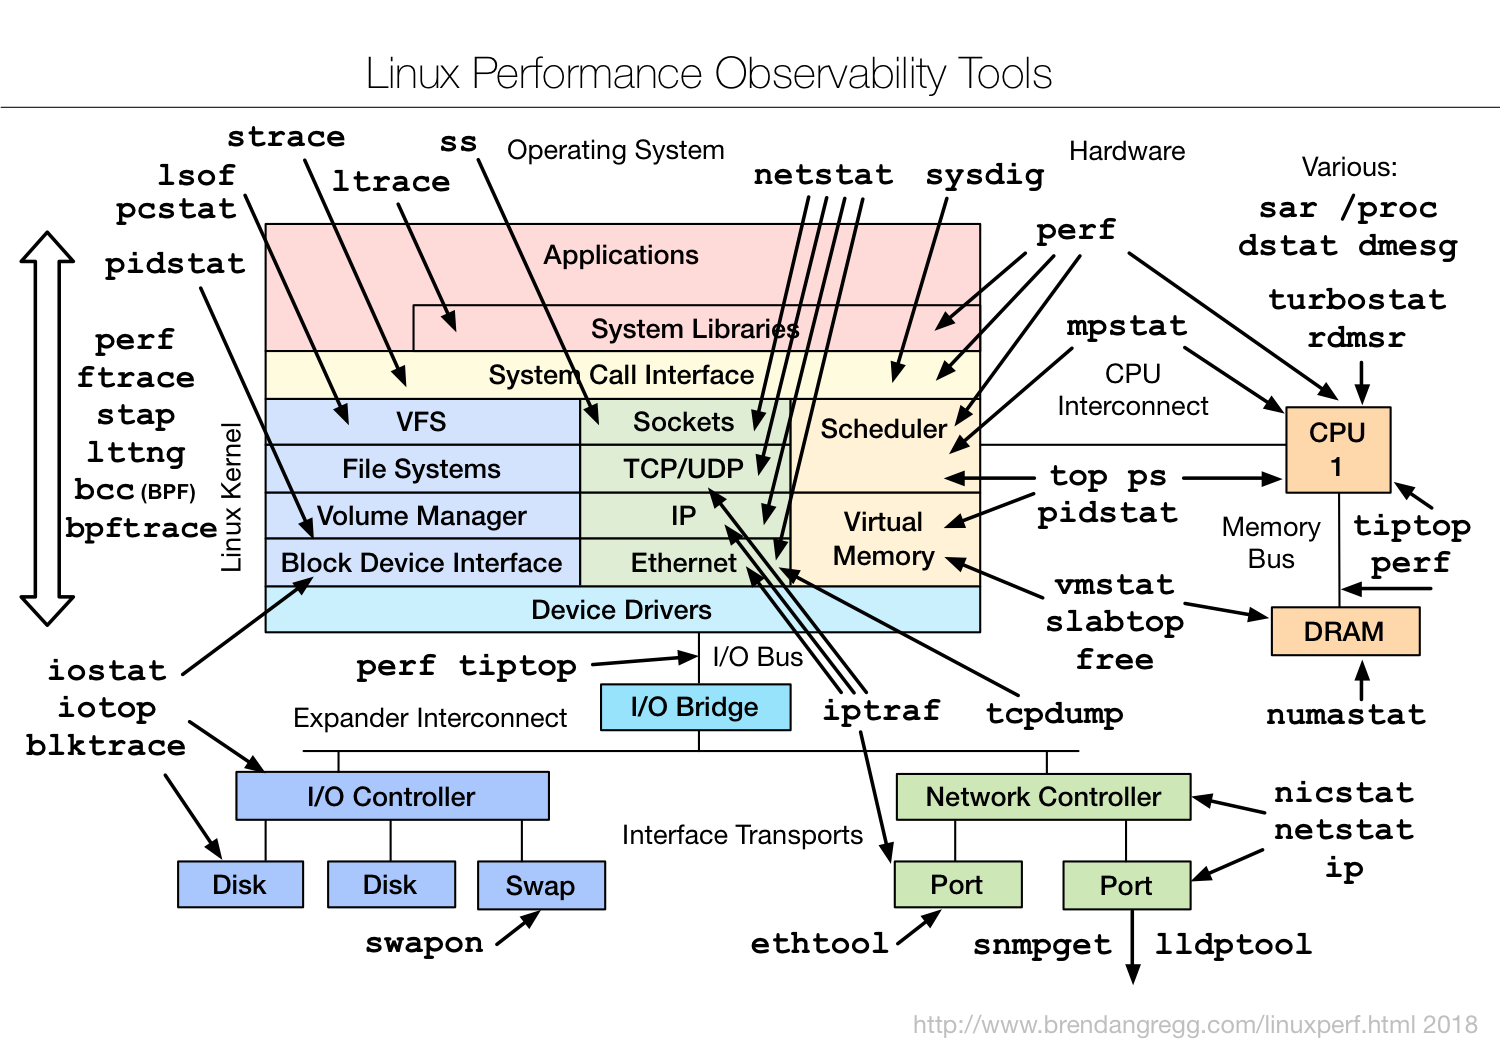
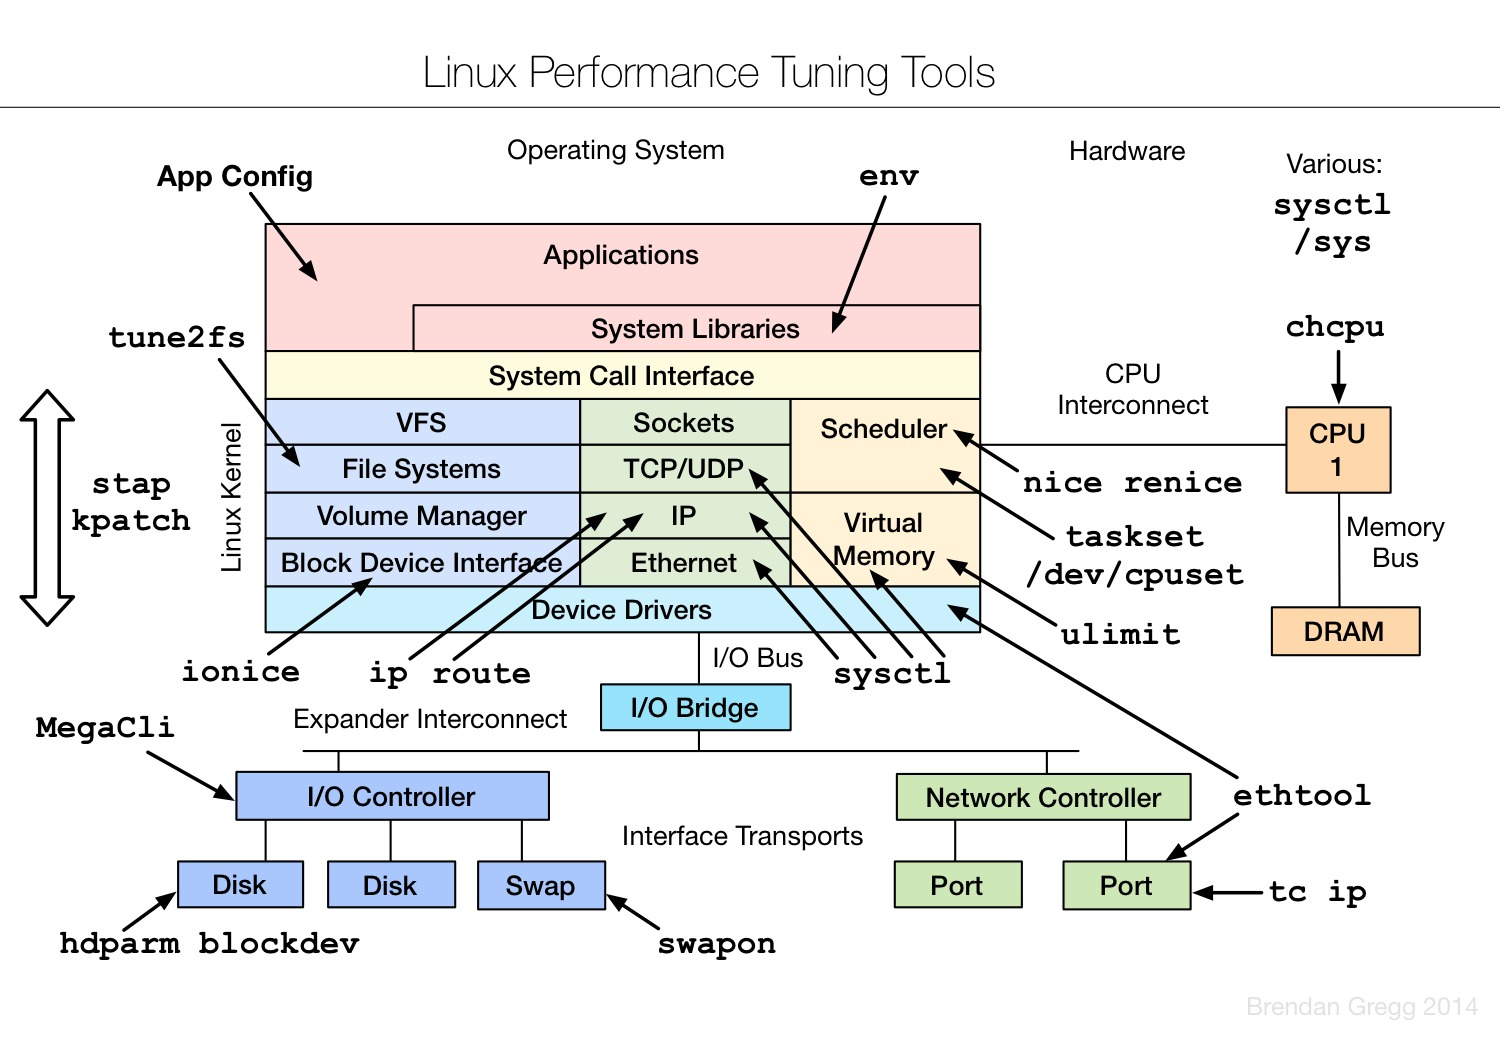
Various monitoring tools
Foreign linux Supervisory God: Baidu Search Brendan D. Gregg
http://www.brendangregg.com/linuxperf.html
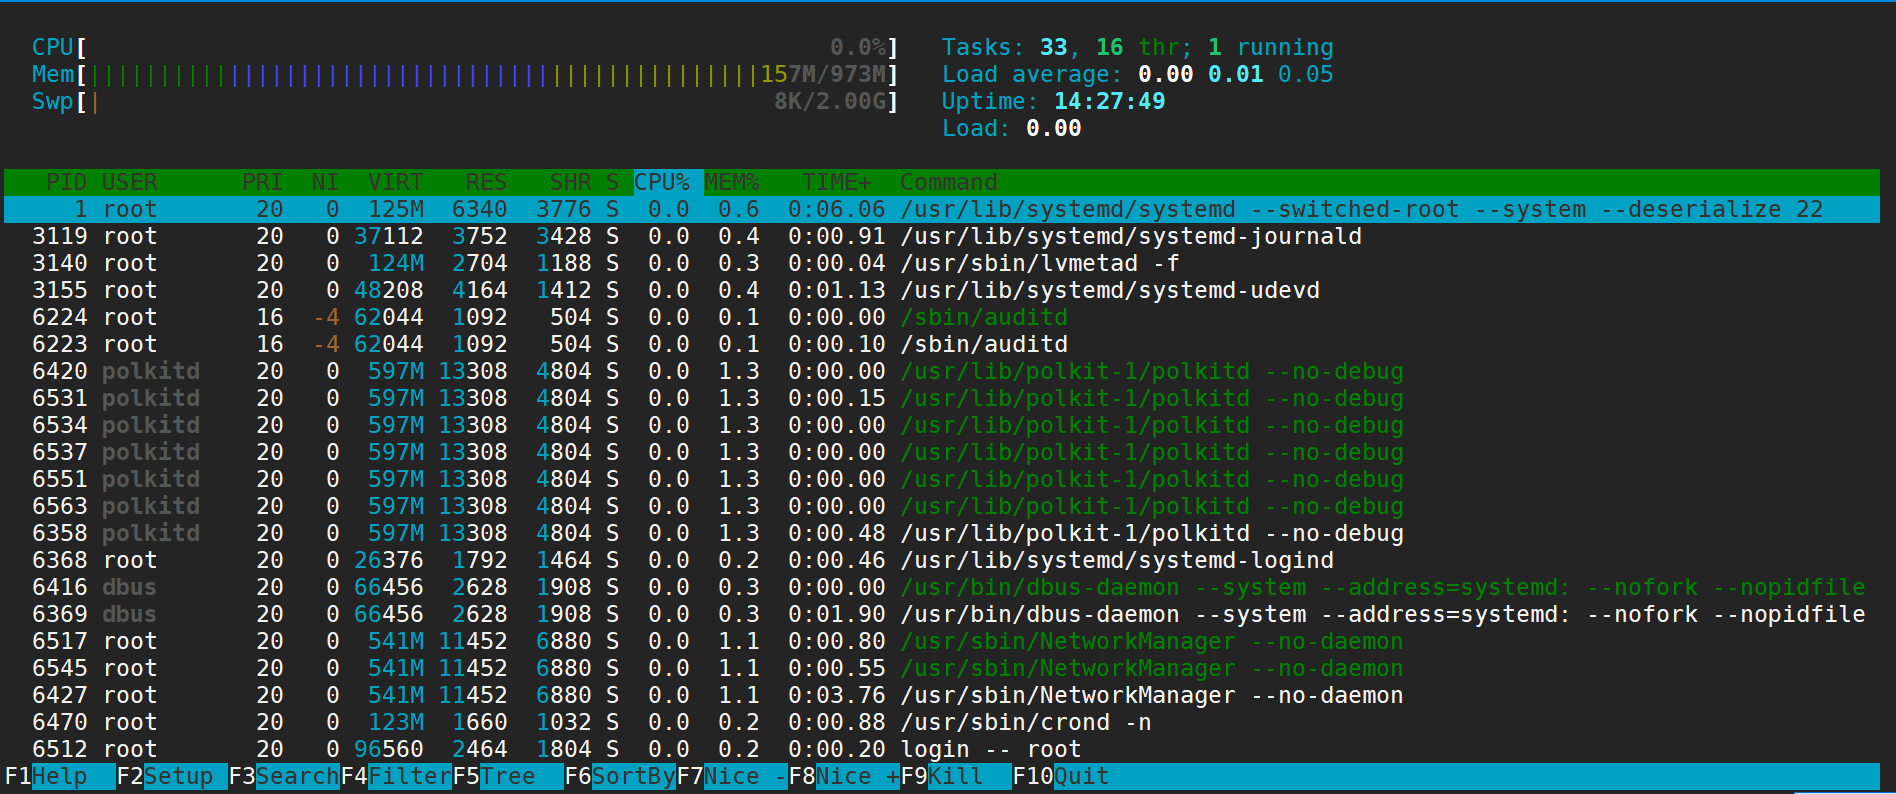
I. hatop
linux interactive process viewer supports mouse point, search and kill process, sorting, etc. It has quite powerful functions.
https://www.cnblogs.com/enet01/p/8316006.html
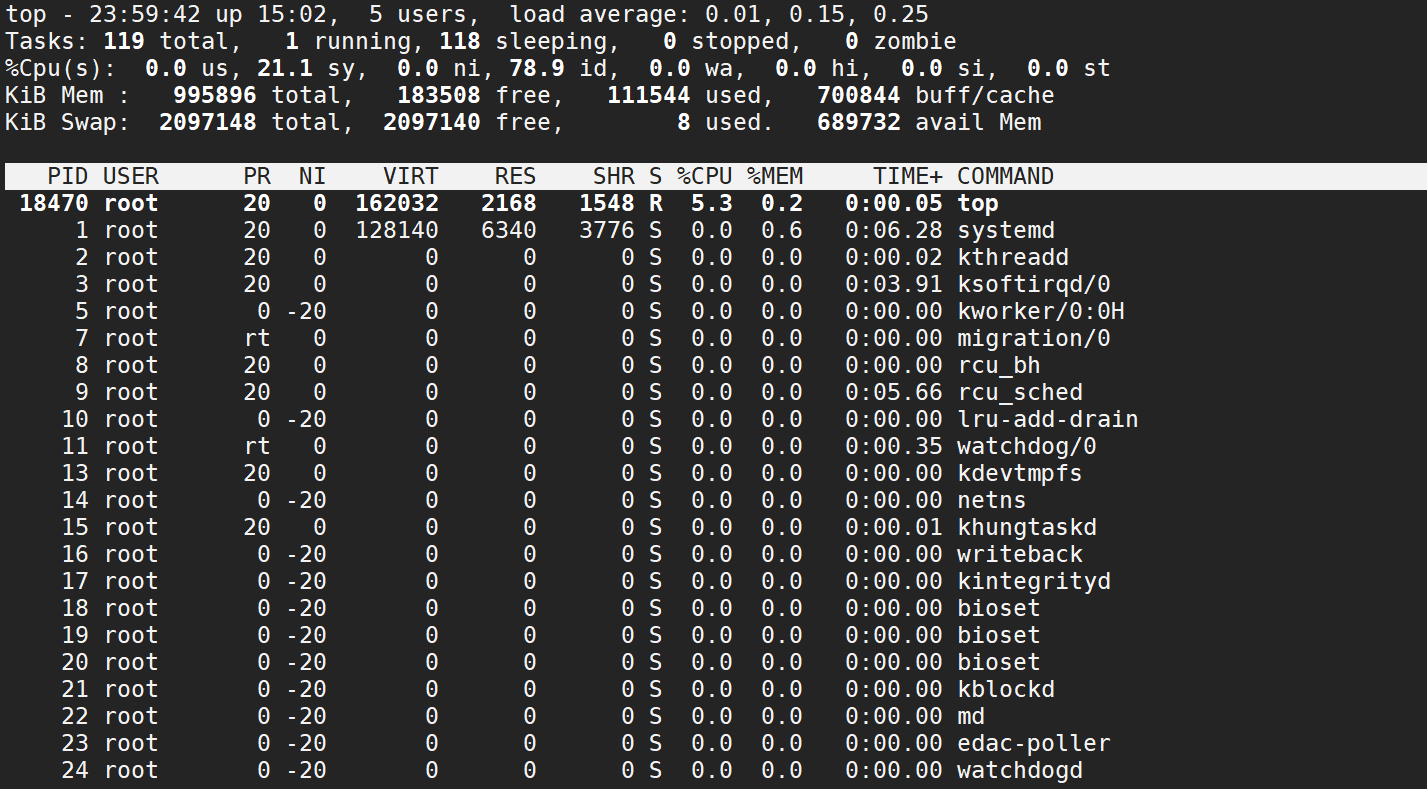
PID: Process flag number, non-zero positive integer

USER: User name of process owner

PR: Priority of processes

NI: Priority value of process

VIRT: Value of virtual memory occupied by processes

RES: The physical memory value occupied by a process

SHR: Shared memory values used by processes

S: The state of a process, where S is dormant, R is running, Z is deadly, and N is negative.

% CPU: CPU utilization for this process

% MEM: Percentage of physical and total memory occupied by the process

TIME+: Total CPU time taken by the process after it starts

COMMAND: Start command name for process startup
[root@linux1 ~]# yum install hatop -y
Ii. iftop
linux's powerful traffic monitoring tools can monitor which programs are heavily bandwidth-intensive
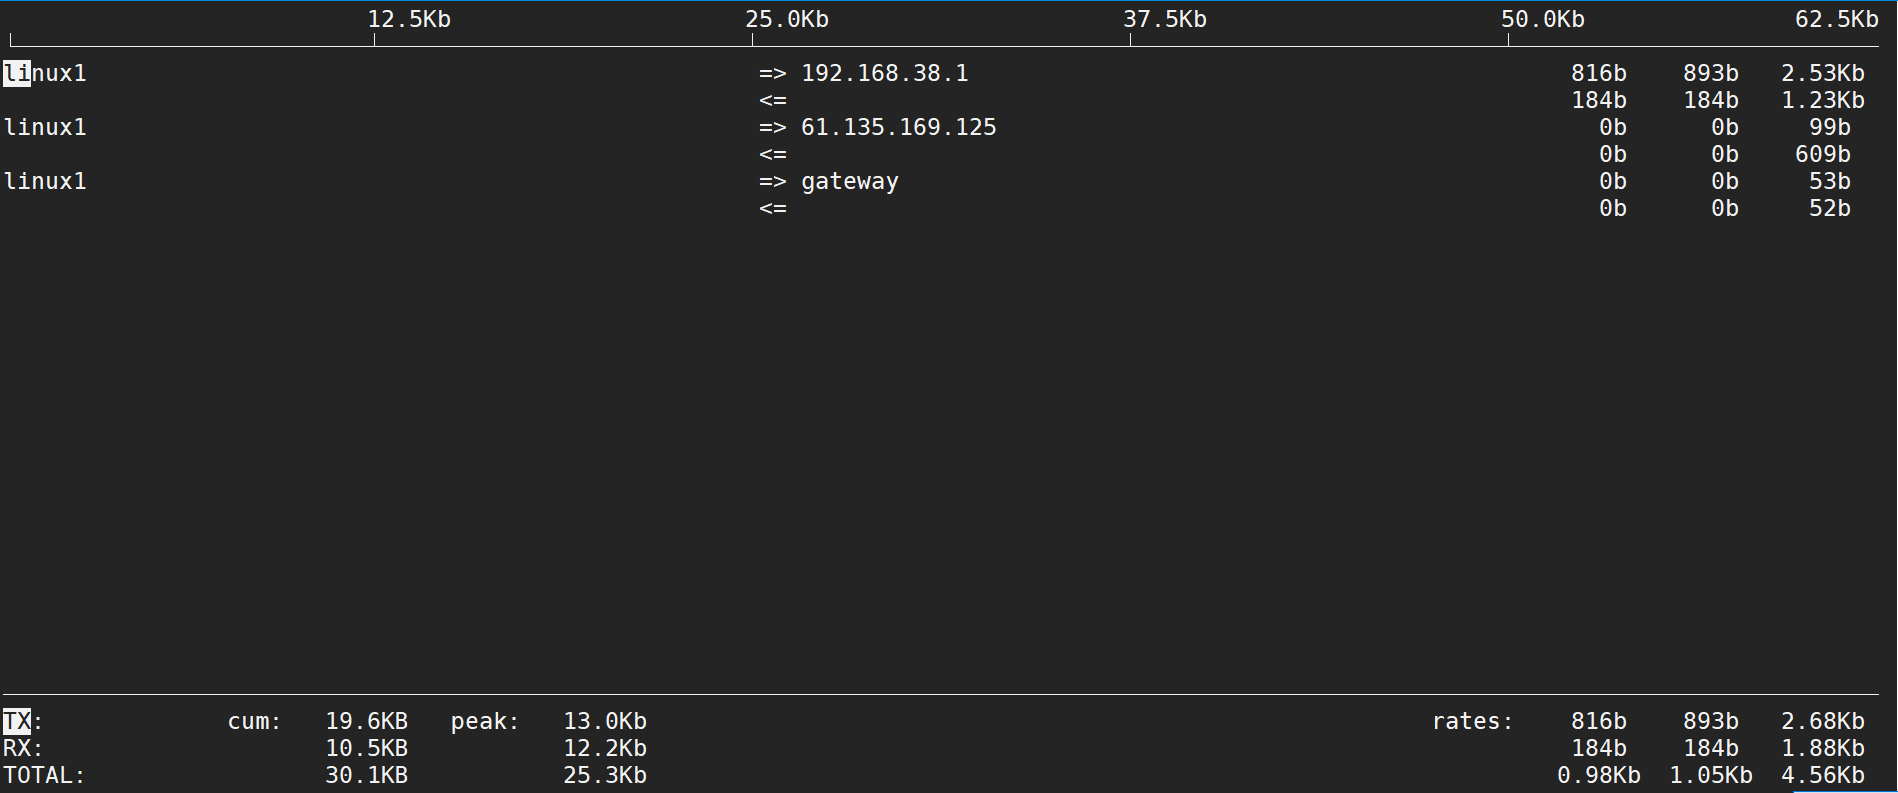
There's another command that's interesting, too.
[root@linux1 ~]# netstat -Iens33
Kernel Interface table
Iface             MTU    RX-OK RX-ERR RX-DRP RX-OVR    TX-OK TX-ERR TX-DRP TX-OVR Flg
ens33            1500  6688500      0      0 0       6485126      0      0      0 BMsU
III. iotop
A powerful tool for monitoring disk io to see which program reads and writes the disk badly
Reference resources:
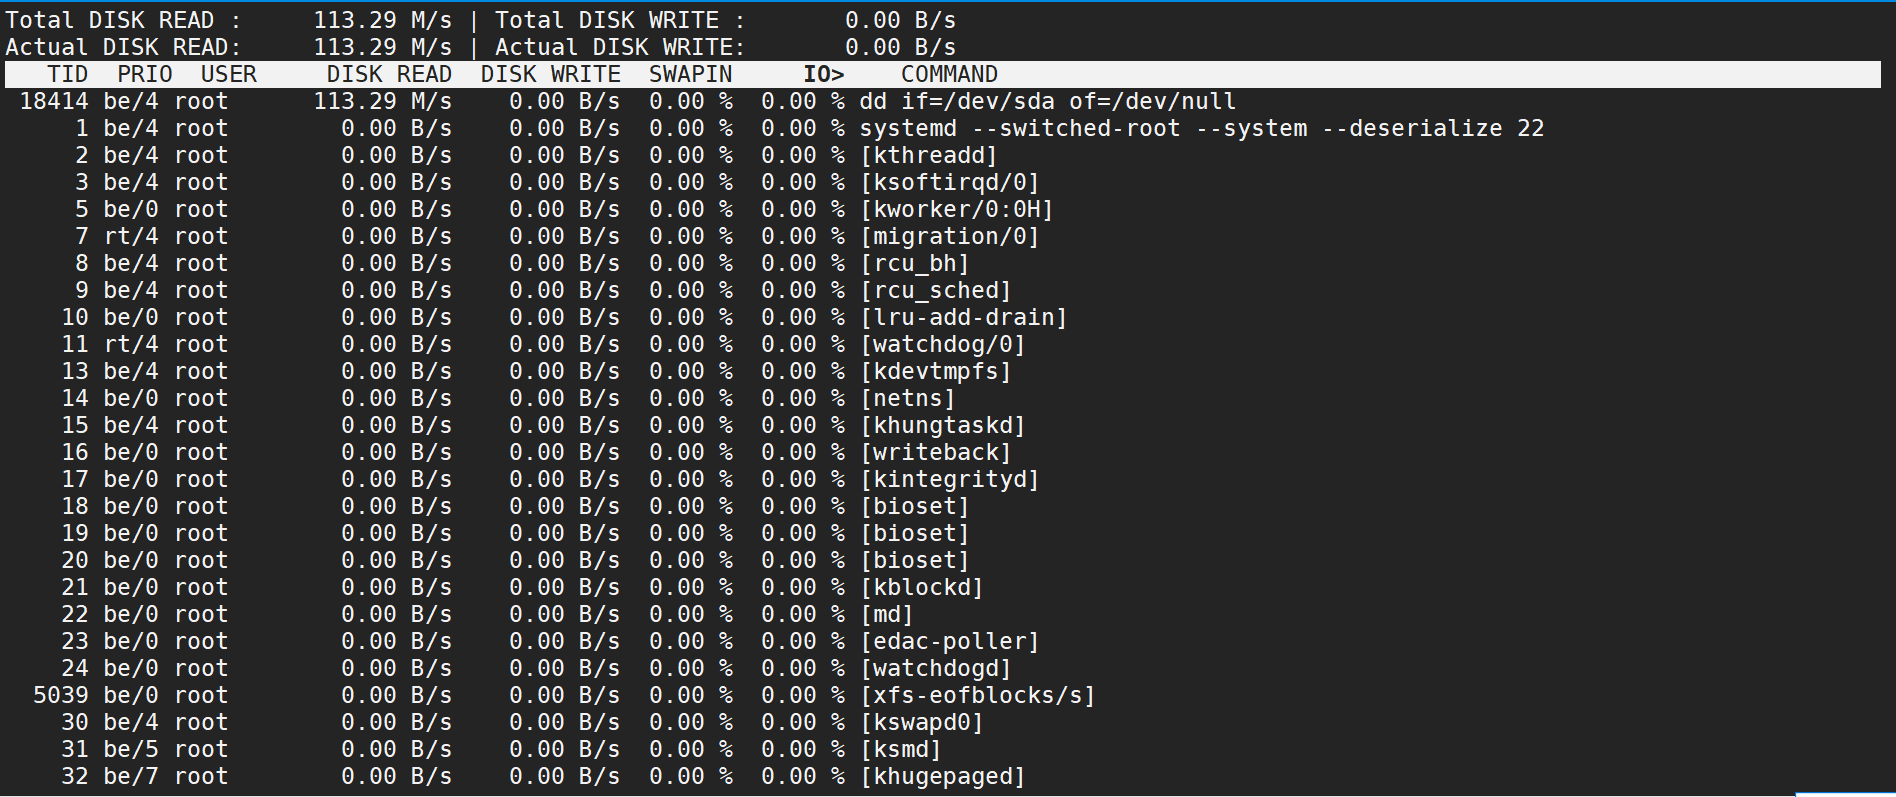
- n: Display output times
 - o: Displays only processes with io output
 - b: Prevent dynamic display
Output in case of io exception
[root@linux1 ~]# iotop -bon2
Total DISK READ :       0.00 B/s | Total DISK WRITE :       0.00 B/s
Actual DISK READ:       0.00 B/s | Actual DISK WRITE:       0.00 B/s
   TID  PRIO  USER     DISK READ  DISK WRITE  SWAPIN      IO    COMMAND
Total DISK READ :     386.67 M/s | Total DISK WRITE :       0.00 B/s
Actual DISK READ:     386.67 M/s | Actual DISK WRITE:       0.00 B/s
   TID  PRIO  USER     DISK READ  DISK WRITE  SWAPIN      IO    COMMAND
 18359 be/4 root        0.00 B/s    0.00 B/s  0.00 %  1.09 % [kworker/0:3]
 18414 be/4 root      386.67 M/s    0.00 B/s  0.00 %  0.00 % dd if=/dev/sda of=/dev/null
Non-interactive, output pid 18414
[root@linux1 ~]# iotop -botq -p 18414
23:48:22 Total DISK READ :       0.00 B/s | Total DISK WRITE :       0.00 B/s
23:48:22 Actual DISK READ:       0.00 B/s | Actual DISK WRITE:       0.00 B/s
    TIME   TID  PRIO  USER     DISK READ  DISK WRITE  SWAPIN      IO    COMMAND
23:48:23 Total DISK READ :     378.51 M/s | Total DISK WRITE :       0.00 B/s
23:48:23 Actual DISK READ:     378.51 M/s | Actual DISK WRITE:       0.00 B/s
23:48:23  18414 be/4 root      378.51 M/s    0.00 B/s  0.00 %  0.00 % dd if=/dev/sda of=/dev/null
23:48:24 Total DISK READ :     384.19 M/s | Total DISK WRITE :       0.00 B/s
23:48:24 Actual DISK READ:     384.22 M/s | Actual DISK WRITE:       0.00 B/s
23:48:24  18414 be/4 root      384.19 M/s    0.00 B/s  0.00 %  0.00 % dd if=/dev/sda of=/dev/null
23:48:25 Total DISK READ :     383.16 M/s | Total DISK WRITE :       0.00 B/s
23:48:25 Actual DISK READ:     383.16 M/s | Actual DISK WRITE:       0.00 B/s
23:48:25  18414 be/4 root      383.16 M/s    0.00 B/s  0.00 %  0.00 % dd if=/dev/sda of=/dev/null
23:48:26 Total DISK READ :     382.40 M/s | Total DISK WRITE :       0.00 B/s
23:48:26 Actual DISK READ:     382.40 M/s | Actual DISK WRITE:       0.00 B/s
23:48:26  18414 be/4 root      382.40 M/s    0.00 B/s  0.00 %  0.00 % dd if=/dev/sda of=/dev/null
IV. iostat
Iostat is the abbreviation of I/O statistics (input/output statistics). The iostat tool monitors the disk operation activities of the system. Its characteristic is to report the statistics of disk activity and CPU usage. Iostat also has a weakness, that is, it can not analyze a process in depth, only the overall situation of the system.
Reference resources: https://www.cnblogs.com/ftl1012/p/iostat.html
# Refresh three times every 2 seconds
[root@linux1 yum.repos.d]# iostat 2 3
Linux 3.10.0-957.el7.x86_64 (linux1)    08/19/2019  _x86_64_    (1 CPU)

avg-cpu:  %user   %nice %system %iowait  %steal   %idle
           0.28    0.00    0.83    0.01    0.00   98.88

Device:            tps    kB_read/s    kB_wrtn/s    kB_read    kB_wrtn
sda               4.33      2011.50        12.25  107916522     657311
scd0              0.00         0.02         0.00       1028          0
dm-0              0.40        12.49        12.18     670047     653191
dm-1              0.00         0.05         0.00       2460          4
dm-2              0.00         0.02         0.04       1119       2048

avg-cpu:  %user   %nice %system %iowait  %steal   %idle
           0.00    0.00    0.50    0.00    0.00   99.50

Device:            tps    kB_read/s    kB_wrtn/s    kB_read    kB_wrtn
sda               0.00         0.00         0.00          0          0
scd0              0.00         0.00         0.00          0          0
dm-0              0.00         0.00         0.00          0          0
dm-1              0.00         0.00         0.00          0          0
dm-2              0.00         0.00         0.00          0          0

avg-cpu:  %user   %nice %system %iowait  %steal   %idle
           0.00    0.00    0.00    0.00    0.00  100.00

Device:            tps    kB_read/s    kB_wrtn/s    kB_read    kB_wrtn
sda               0.00         0.00         0.00          0          0
scd0              0.00         0.00         0.00          0          0
dm-0              0.00         0.00         0.00          0          0
dm-1              0.00         0.00         0.00          0          0
dm-2              0.00         0.00         0.00          0          0
If the value of% iowait is too high, it means that there is an I/O bottleneck in the hard disk.
If the% idle value is high, the CPU is idler
If the% idle value is high but the system responds slowly, it may be that the CPU is waiting to allocate memory, and the memory capacity should be increased.
If the% idle value continues to be less than 10, it indicates that the CPU processing capacity is relatively low, and the most needed resource in the system is CPU.
V. vmstat
The vmstat(Virtual Memory Statistics Virtual Memory Statistics) command is used to display the virtual memory status of the Linux system, and also to report the overall running status of the process, memory, I/O system.
Examination: https://www.cnblogs.com/ftl1012/p/vmstat.html
[root@linux1 yum.repos.d]# vmstat 2 3
procs -----------memory---------- ---swap-- -----io---- -system-- ------cpu-----
 r  b   swpd   free   buff  cache   si   so    bi    bo   in   cs us sy id wa st
 2  0      8 184004 401904 298628    0    0  2006    12   87   49  0  1 99  0  0
 0  0      8 184004 401904 298628    0    0     0     0   32   47  0  0 100  0  0
 0  0      8 184004 401904 298628    0    0     0     0   31   43  0  0 100  0  0
VI. top
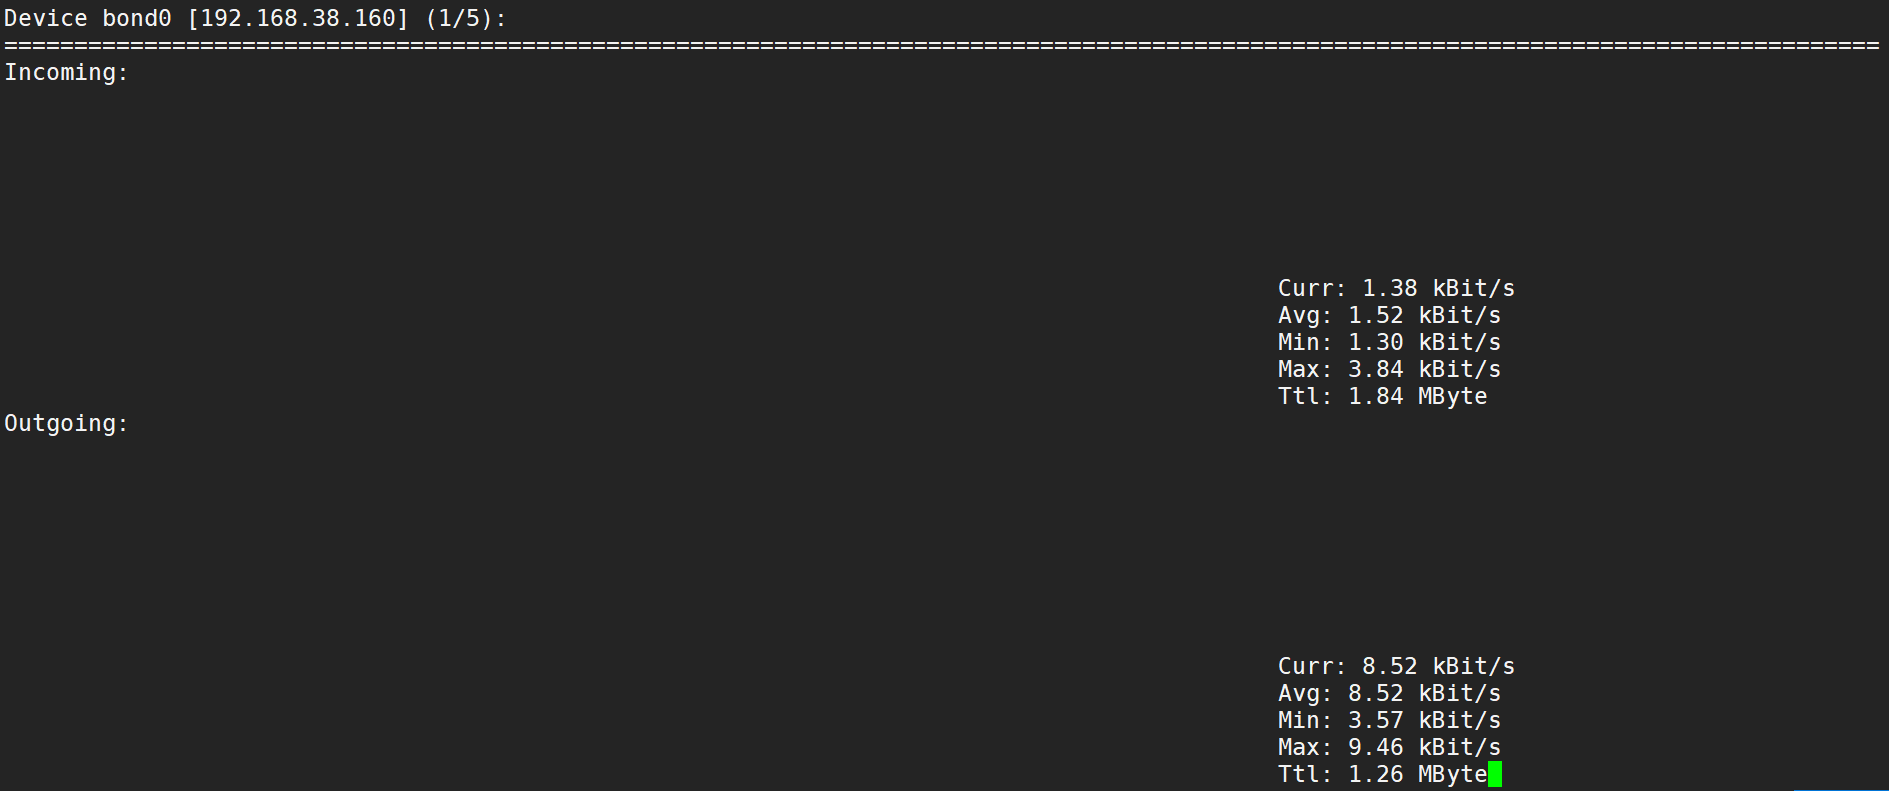
7. nload
The monitoring network card and iftop function are similar.
Multiple network cards can be switched left or right or return.
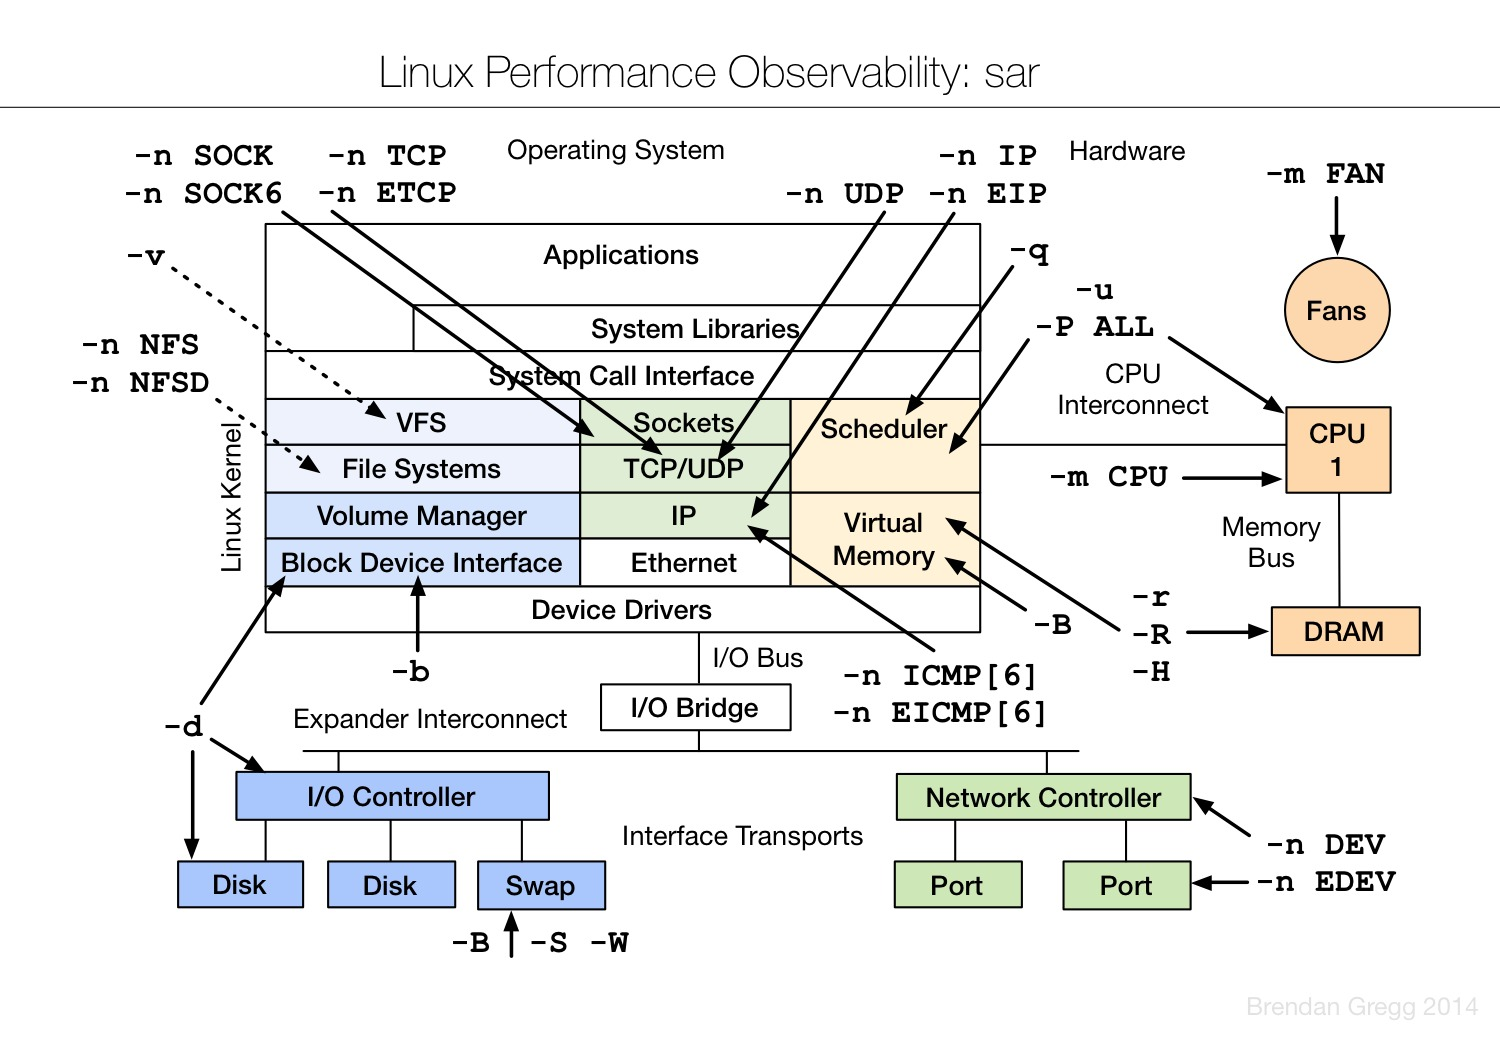
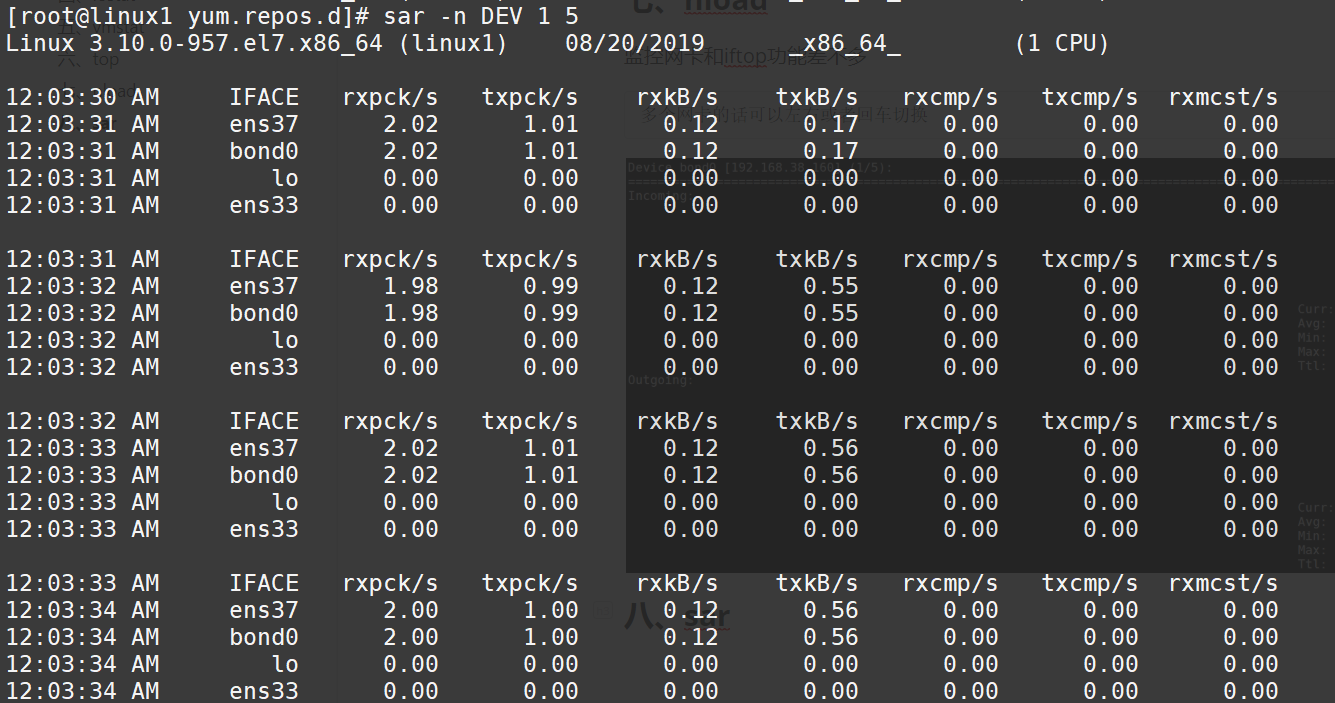
8. sar
It's also awesome.
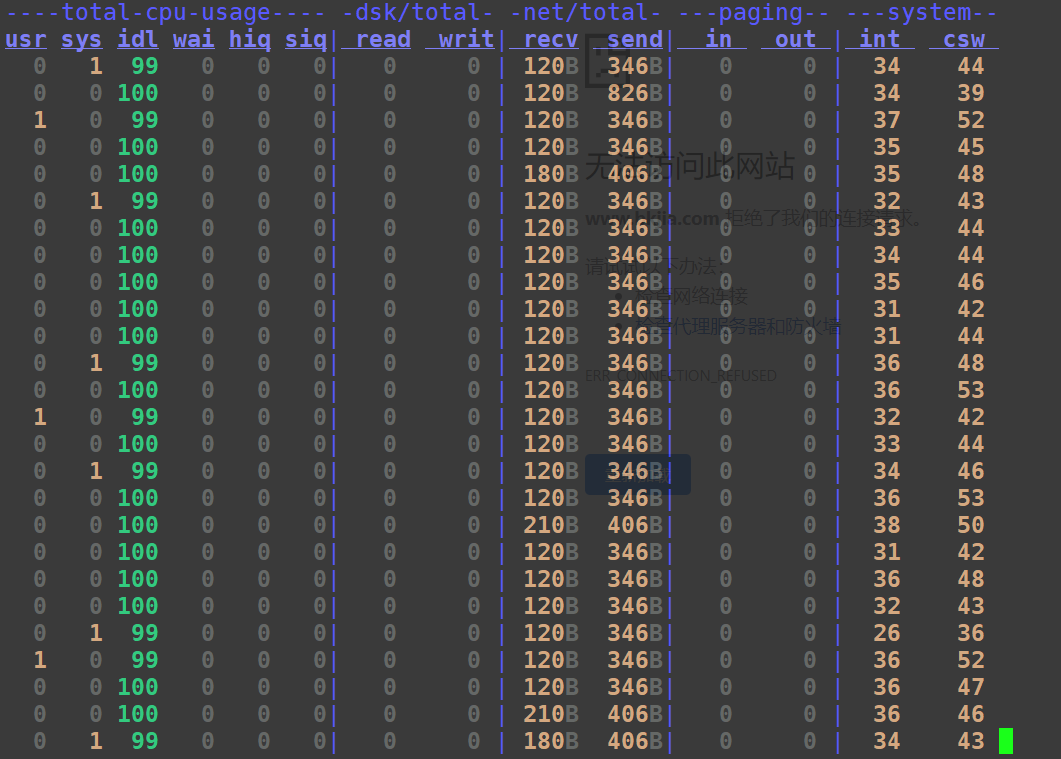
9. dstat
Claiming to be a bullnose
Reference resources: https://www.cnblogs.com/wuling129/p/4773199.html
There are many parameters.
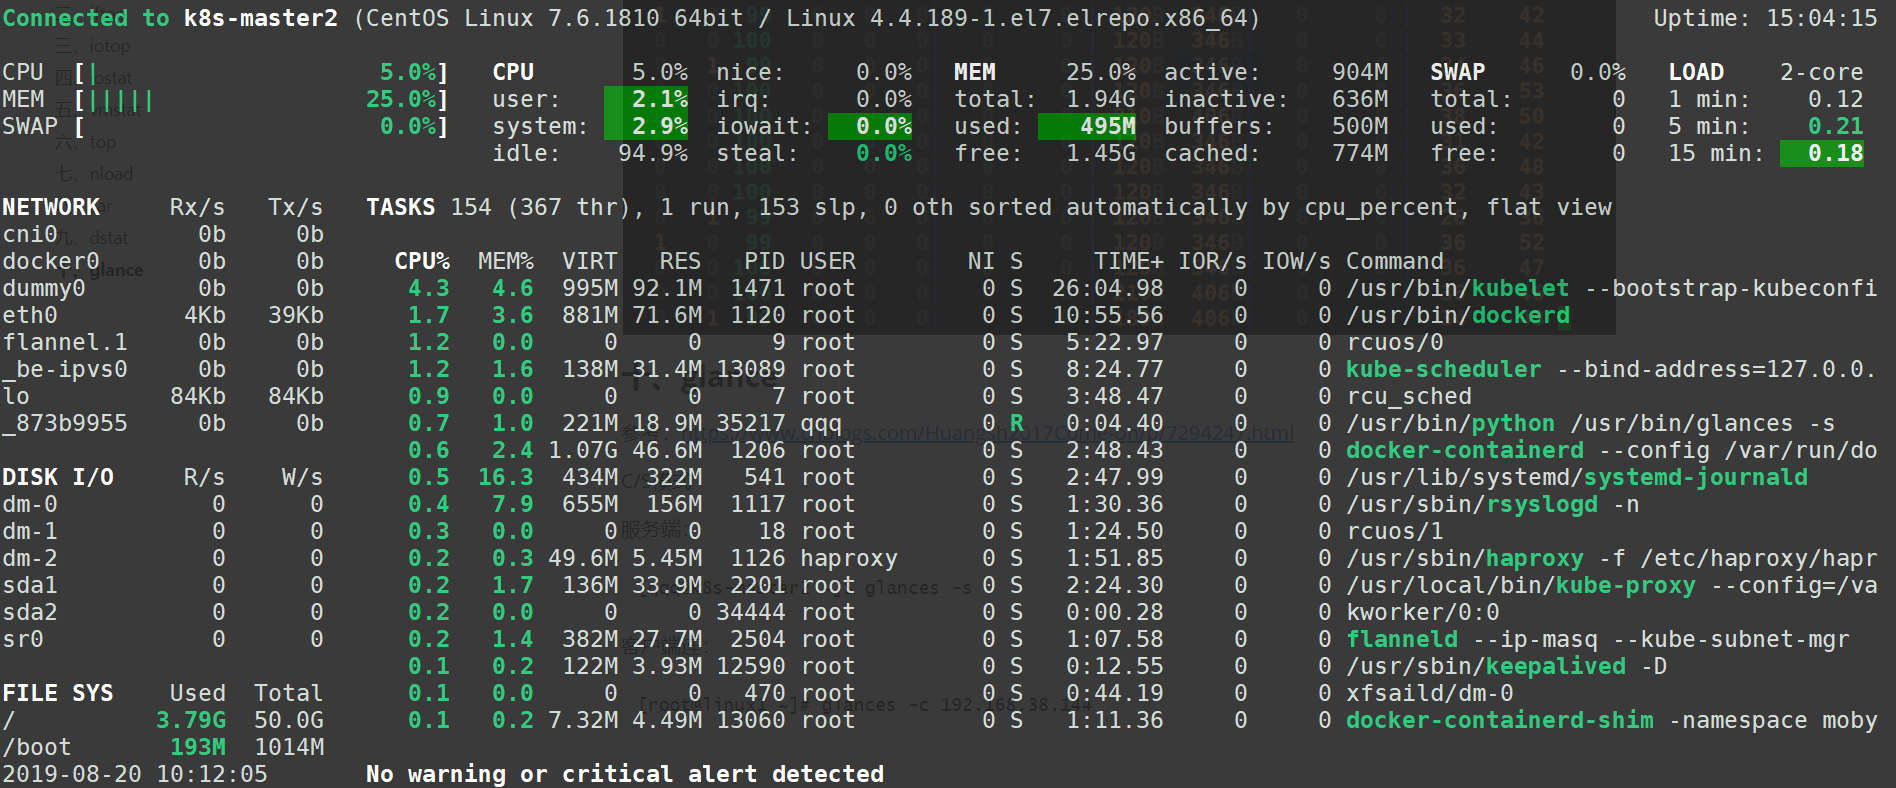
X. glance
Reference resources: https://www.cnblogs.com/Huangsh2017Come-on/p/7294247.html
C/S mode
Server side:
[qqq@k8s-master2 ~]$ glances -s
Client Company:
[root@linux1 ~]# glances -c 192.168.38.144
The other: