The official account of WeChat: the story of operation and development.
Master some performance optimization tools and methods, which need to be accumulated in the work; Basic computer knowledge is very important, such as network knowledge, operating system knowledge and so on. Mastering the basic knowledge can enable you to grasp the key of performance problems in the optimization process and be comfortable in the performance optimization process.
Although monitoring tools can help us solve most problems, we sometimes need to log in to the instance and run some standard Linux performance tools.
Take a look at this article by the Netflix performance engineering team Bowen , see them diagnose machine performance problems in one minute with ten commands.
In 60 seconds, you can have a high-level understanding of system resource usage and running processes by running the following ten commands. Look for errors and saturation indicators because they are easy to explain, followed by resource utilization. Saturation refers to the situation that the load of a resource exceeds its processing capacity. It can be disclosed as the length of the request queue or waiting time.
When we find all the key level-1 counters of the Linux operating system, we will get such a picture:
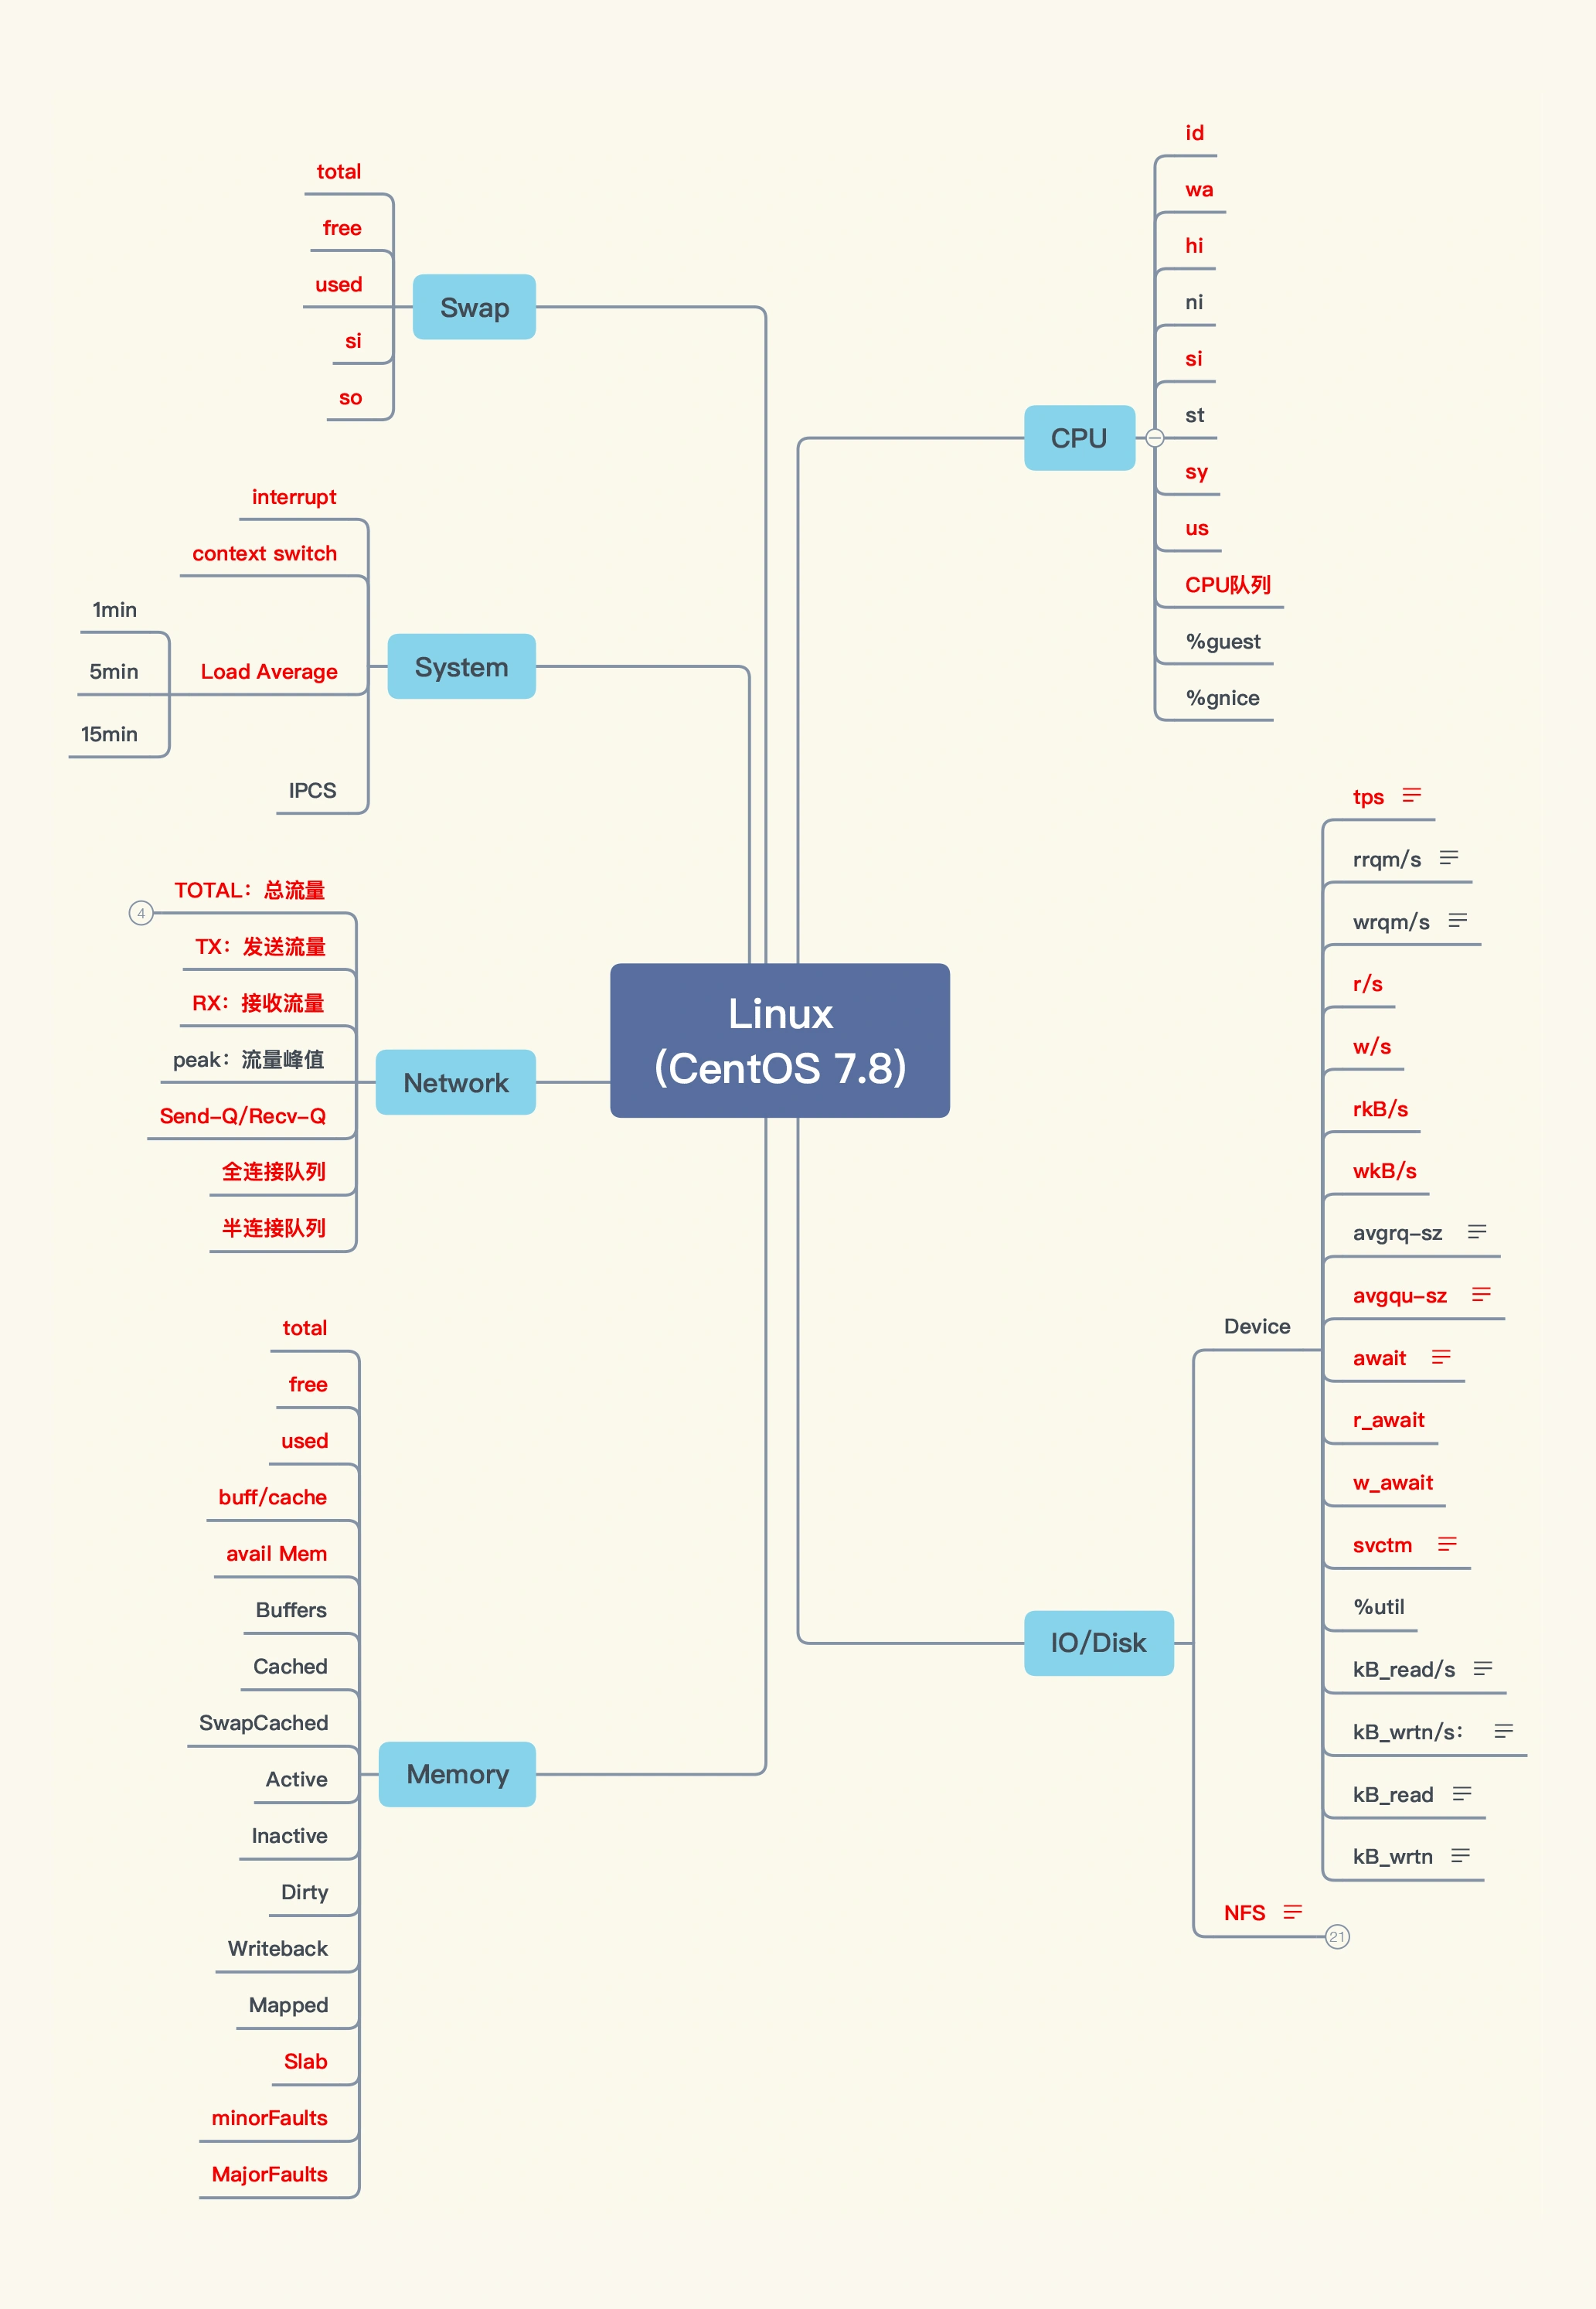
The output of these commands helps to quickly locate performance bottlenecks. It mainly checks the red counters in the figure, and the utilization, saturation and error measures of all resources (CPU, memory, disk IO, etc.), which is proposed by Brendan Gregg USE method.

uptime
dmesg | tail
vmstat 1
mpstat -P ALL 1
pidstat 1
iostat -xz 1
free -m
sar -n DEV 1
sar -n TCP,ETCP 1
top
Let's introduce these commands one by one. For more parameters and descriptions of these commands, please refer to the command manual.
1.uptime
This command can quickly view the load of the machine:
$ uptime
23:51:26 up 21:31,  1 user,  load average: 30.02, 26.43, 19.02
- In Linux system, the average load refers to the average number of processes in the Running state and non interruptible state of the system in unit time, that is, the average number of active processes. Runnable processes refer to processes that are using CPU or waiting for CPU, that is, processes in R state (Running or runnable) as we often see with ps command. Non interruptible processes are processes in the kernel state key processes, and these processes are non interruptible. These data can give us a macro understanding of the use of system resources.
- The output of the command represents the average load of 1 minute, 5 minutes and 15 minutes respectively. Through these three data, we can know whether the server load is becoming tense or alleviated in the region. If the 1-minute average load is very high and the 15 minute average load is very low, it indicates that the server is commanding high load, and it is necessary to further investigate where CPU resources are consumed. On the contrary, if the average load in 15 minutes is very high and the average load in 1 minute is low, it may be that the time of CPU resource shortage has passed.
- From the output in the above example, we can see that the average load in the last minute is very high and much higher than that in the last 15 minutes. Therefore, we need to continue to check what processes in the current system consume a lot of resources. You can use the vmstat, mpstat and other commands described below for further troubleshooting.
2.dmesg | tail
$ dmesg | tail
[1880957.563150] perl invoked oom-killer: gfp_mask=0x280da, order=0, oom_score_adj=0
[...]
[1880957.563400] Out of memory: Kill process 18694 (perl) score 246 or sacrifice child
[1880957.563408] Killed process 18694 (perl) total-vm:1972392kB, anon-rss:1953348kB, file-rss:0kB
[2320864.954447] TCP: Possible SYN flooding on port 7001. Dropping request.  Check SNMP counters.
This will view the last 10 system messages, if any. Look for errors that may cause performance problems. The above examples include oom killer and TCP drop requests.
Don't miss this step! dmesg is always worth checking. These logs can help troubleshoot performance problems.
3.vmstat
$ vmstat 1
procs ---------memory---------- ---swap-- -----io---- -system-- ------cpu-----
r  b swpd   free   buff  cache   si   so    bi    bo   in   cs us sy id wa st
34  0    0 200889792  73708 591828    0    0     0     5    6   10 96  1  3  0  0
32  0    0 200889920  73708 591860    0    0     0   592 13284 4282 98  1  1  0  0
32  0    0 200890112  73708 591860    0    0     0     0 9501 2154 99  1  0  0  0
32  0    0 200889568  73712 591856    0    0     0    48 11900 2459 99  0  0  0  0
32  0    0 200890208  73712 591860    0    0     0     0 15898 4840 98  1  1  0  0
^C
Each line will output some system core indicators, which can let us understand the system status in more detail. The following parameter 1 indicates that statistical information is output every second. The header prompts the meaning of each column. These introduce some columns related to performance tuning:
- r: The number of processes waiting for CPU resources. This data can better reflect the CPU load than the average load. The data does not include processes waiting for IO. If this value is greater than the number of CPU cores of the machine, the CPU resources of the machine are saturated.
- Free: the amount of memory available to the system (in kilobytes). If the remaining memory is insufficient, it will also lead to system performance problems. The free command described below allows you to understand the system memory usage in more detail.
- si, so: the number of writes and reads in the swap area. If the data is not 0, it indicates that the system is already using the swap and the physical memory of the machine is insufficient.
- us, sy, id, wa, st: these represent CPU time consumption. They represent user time (user), system (kernel) time (sys), idle time (idle), IO wait time (wait) and stolen time (stolen, generally consumed by other virtual machines).
These CPU times can let us quickly know whether the CPU is busy. Generally, if the sum of user time and system time is very large, the CPU is busy executing instructions. If the IO wait time is very long, the bottleneck of the system may be disk IO.
As can be seen from the output of the example command, a large amount of CPU time is consumed in the user state, that is, the user application consumes CPU time. This is not necessarily a performance problem. It needs to be analyzed together with the r queue.
4.mpstat -P ALL 1
$ mpstat -P ALL 1
Linux 3.13.0-49-generic (titanclusters-xxxxx)  07/14/2015  _x86_64_ (32 CPU)
07:38:49 PM  CPU   %usr  %nice   %sys %iowait   %irq  %soft  %steal  %guest  %gnice  %idle
07:38:50 PM  all  98.47   0.00   0.75    0.00   0.00   0.00    0.00    0.00    0.00   0.78
07:38:50 PM    0  96.04   0.00   2.97    0.00   0.00   0.00    0.00    0.00    0.00   0.99
07:38:50 PM    1  97.00   0.00   1.00    0.00   0.00   0.00    0.00    0.00    0.00   2.00
07:38:50 PM    2  98.00   0.00   1.00    0.00   0.00   0.00    0.00    0.00    0.00   1.00
07:38:50 PM    3  96.97   0.00   0.00    0.00   0.00   0.00    0.00    0.00    0.00   3.03
[...]
This command can display the usage of each CPU. If the CPU usage is particularly high, it may be caused by a single threaded application.
5.pidstat 1
$ pidstat 1
Linux 3.13.0-49-generic (titanclusters-xxxxx)  07/14/2015    _x86_64_    (32 CPU)

07:41:02 PM   UID       PID    %usr %system  %guest    %CPU   CPU  Command
07:41:03 PM     0         9    0.00    0.94    0.00    0.94     1  rcuos/0
07:41:03 PM     0      4214    5.66    5.66    0.00   11.32    15  mesos-slave
07:41:03 PM     0      4354    0.94    0.94    0.00    1.89     8  java
07:41:03 PM     0      6521 1596.23    1.89    0.00 1598.11    27  java
07:41:03 PM     0      6564 1571.70    7.55    0.00 1579.25    28  java
07:41:03 PM 60004     60154    0.94    4.72    0.00    5.66     9  pidstat

07:41:03 PM   UID       PID    %usr %system  %guest    %CPU   CPU  Command
07:41:04 PM     0      4214    6.00    2.00    0.00    8.00    15  mesos-slave
07:41:04 PM     0      6521 1590.00    1.00    0.00 1591.00    27  java
07:41:04 PM     0      6564 1573.00   10.00    0.00 1583.00    28  java
07:41:04 PM   108      6718    1.00    0.00    0.00    1.00     0  snmp-pass
07:41:04 PM 60004     60154    1.00    4.00    0.00    5.00     9  pidstat
^C
The pidstat command outputs the CPU utilization of the process. This command will continue to output and will not overwrite the previous data. It is convenient to observe the system dynamics. From the above output, you can see that the two JAVA processes occupy nearly 1600% of CPU time, consuming about 16 CPU cores of computing resources.
6.iostat -xz 1
$ iostat -xz 1
avg-cpu:  %user   %nice %system %iowait  %steal   %idle
           0.13    0.00    0.10    0.01    0.00   99.76

Device:         rrqm/s   wrqm/s     r/s     w/s    rkB/s    wkB/s avgrq-sz avgqu-sz   await r_await w_await  svctm  %util
vda               0.00     0.62    0.03    0.89     0.57     7.97    18.52     0.00    0.68    1.96    0.64   0.60   0.06
vdb               0.00     0.02    0.00    0.38     0.05     2.64    14.12     0.00    0.84    0.46    0.84   0.54   0.02
dm-0              0.00     0.00    0.00    0.40     0.01     2.75    13.62     0.00    0.98    0.37    0.98   0.35   0.01

avg-cpu:  %user   %nice %system %iowait  %steal   %idle
           0.25    0.00    0.00    0.00    0.00   99.75

Device:         rrqm/s   wrqm/s     r/s     w/s    rkB/s    wkB/s avgrq-sz avgqu-sz   await r_await w_await  svctm  %util
vda               0.00     0.00    0.00    1.00     0.00     4.00     8.00     0.00    0.00    0.00    0.00   1.00   0.10

avg-cpu:  %user   %nice %system %iowait  %steal   %idle
           0.00    0.00    0.00    0.00    0.00  100.00
The iostat command is mainly used to view the IO status of the machine disk. The output columns of this command mainly mean:
- r/s, w/s, rkB/s, wkB/s: respectively represents the number of reads and writes per second and the amount of data read and written per second (kilobytes). Excessive reading and writing may cause performance problems.
- await: average wait time of IO operation, in milliseconds. This is the time consumed when the application interacts with the disk, including IO waiting and actual operation time. If this value is too large, the hardware device may encounter a bottleneck or failure.
- avgqu-sz: the average number of requests to the device. If this value is greater than 1, the hardware device may be saturated (some front-end hardware devices support parallel writing).
- %util: device utilization. This value indicates the busy degree of the equipment. The empirical value is that if it exceeds 60, the IO performance may be affected (refer to the average waiting time of IO operation). If it reaches 100%, the hardware device is saturated.
If the data of logical devices is displayed, the device utilization does not mean that the actual hardware devices at the back end are saturated. It is worth noting that even if the IO performance is not ideal, it does not necessarily mean that the application performance will be poor. Strategies such as pre read and write cache can be used to improve the application performance.
7.free –m
$ free -m
            total       used       free     shared    buffers     cached
Mem:        245998      24545     221453         83         59        541
-/+ buffers/cache:      23944     222053
Swap:            0          0          0
The free command can view the usage of system memory, and the - m parameter indicates that it is displayed in megabytes. The last two columns represent the memory used for IO caching and the memory used for file system page caching, respectively. It should be noted that in the second line - / + buffers/cache, it seems that the cache takes up a lot of memory space. This is the memory usage strategy of the Linux system. Use memory as much as possible. If the application needs memory, this part of memory will be recycled and allocated to the application immediately. Therefore, this part of memory is generally regarded as available memory.
If the available memory is very small, the system may use the swap area (if configured), which will increase the IO overhead (which can be withdrawn in the iostat command) and reduce the system performance.
8.sar -n DEV 1
$ sar -n DEV 1
Linux 3.13.0-49-generic (titanclusters-xxxxx)  07/14/2015     _x86_64_    (32 CPU)
12:16:48 AM     IFACE   rxpck/s   txpck/s    rxkB/s    txkB/s   rxcmp/s   txcmp/s  rxmcst/s   %ifutil
12:16:49 AM      eth0  18763.00   5032.00  20686.42    478.30      0.00      0.00      0.00      0.00
12:16:49 AM        lo     14.00     14.00      1.36      1.36      0.00      0.00      0.00      0.00
12:16:49 AM   docker0      0.00      0.00      0.00      0.00      0.00      0.00      0.00      0.00
12:16:49 AM     IFACE   rxpck/s   txpck/s    rxkB/s    txkB/s   rxcmp/s   txcmp/s  rxmcst/s   %ifutil
12:16:50 AM      eth0  19763.00   5101.00  21999.10    482.56      0.00      0.00      0.00      0.00
12:16:50 AM        lo     20.00     20.00      3.25      3.25      0.00      0.00      0.00      0.00
12:16:50 AM   docker0      0.00      0.00      0.00      0.00      0.00      0.00      0.00      0.00
^C
Here you can view the throughput of network devices with the sar command. When troubleshooting performance problems, you can judge whether the network equipment is saturated by the throughput of the network equipment. As shown in the example output, the throughput of eth0 network card device is about 22 Mbytes/s, i.e. 176 Mbits/sec, which does not reach the hardware upper limit of 1Gbit/sec.
9.sar -n TCP,ETCP 1
$ sar -n TCP,ETCP 1
Linux 3.13.0-49-generic (titanclusters-xxxxx)  07/14/2015    _x86_64_    (32 CPU)
12:17:19 AM  active/s passive/s    iseg/s    oseg/s
12:17:20 AM      1.00      0.00  10233.00  18846.00
12:17:19 AM  atmptf/s  estres/s retrans/s isegerr/s   orsts/s
12:17:20 AM      0.00      0.00      0.00      0.00      0.00
12:17:20 AM  active/s passive/s    iseg/s    oseg/s
12:17:21 AM      1.00      0.00   8359.00   6039.00
12:17:20 AM  atmptf/s  estres/s retrans/s isegerr/s   orsts/s
12:17:21 AM      0.00      0.00      0.00      0.00      0.00
^C
The sar command is used here to view the TCP connection status, including:
- active/s: the number of locally initiated TCP connections per second, i.e. TCP connections created through connect call;
- passive/s: the number of remote initiated TCP connections per second, that is, the TCP connections created through the accept call;
- retrans/s: number of TCP retransmissions per second;
The number of tcp connections can be used to determine whether the performance problem is due to the establishment of too many connections, and further determine whether it is an actively initiated connection or a passively accepted connection. tcp retransmission may be caused by poor network environment or excessive server pressure. Retransmission will seriously affect the efficiency of tcp. You can use a lightweight tcp retransmission capture tool developed by Brendan Gregg: tcpretrans.
10.top
$ top
top - 00:15:40 up 21:56,  1 user,  load average: 31.09, 29.87, 29.92
Tasks: 871 total,   1 running, 868 sleeping,   0 stopped,   2 zombie
%Cpu(s): 96.8 us,  0.4 sy,  0.0 ni,  2.7 id,  0.1 wa,  0.0 hi,  0.0 si,  0.0 st
KiB Mem:  25190241+total, 24921688 used, 22698073+free,    60448 buffers
KiB Swap:        0 total,        0 used,        0 free.   554208 cached Mem
  PID USER      PR  NI    VIRT    RES    SHR S  %CPU %MEM     TIME+ COMMAND
20248 root      20   0  0.227t 0.012t  18748 S  3090  5.2  29812:58 java
 4213 root      20   0 2722544  64640  44232 S  23.5  0.0 233:35.37 mesos-slave
66128 titancl+  20   0   24344   2332   1172 R   1.0  0.0   0:00.07 top
 5235 root      20   0 38.227g 547004  49996 S   0.7  0.2   2:02.74 java
 4299 root      20   0 20.015g 2.682g  16836 S   0.3  1.1  33:14.42 java
    1 root      20   0   33620   2920   1496 S   0.0  0.0   0:03.82 init
    2 root      20   0       0      0      0 S   0.0  0.0   0:00.02 kthreadd
    3 root      20   0       0      0      0 S   0.0  0.0   0:05.35 ksoftirqd/0
    5 root       0 -20       0      0      0 S   0.0  0.0   0:00.00 kworker/0:0H
    6 root      20   0       0      0      0 S   0.0  0.0   0:06.94 kworker/u256:0
    8 root      20   0       0      0      0 S   0.0  0.0   2:38.05 rcu_sched
The top command contains the check contents of several previous commands. For example, system load (uptime), system memory usage (free), system CPU usage (vmstat), etc. Therefore, through this command, you can view the source of system load relatively comprehensively. At the same time, the top command supports sorting, which can be sorted according to different columns. It is convenient to find out the processes that occupy the most memory and the processes that occupy the most CPU.
However, compared with the previous commands, the output of the top command is an instantaneous value. If you don't keep staring, you may miss some clues. At this time, you may need to pause the top command refresh to record and compare data.
summary
There are many tools for troubleshooting Linux server performance problems. The commands described above can help us quickly locate problems. For example, in the previous example output, multiple evidences prove that JAVA processes occupy a lot of CPU resources, and then the performance tuning can be carried out for the application.