Author email: 2107810343@qq.com
Time: 14:39, May 16, 2021
Implementation environment: Linux
System: ubuntu 18.04
CPU: 2 cores
Memory size: 4G
Disk capacity view: df
For a disk, the most common performance problem is insufficient disk space, so let's first introduce how to check the disk capacity of Linux, and enter the following command on the command line:
# -h means that the output content is converted to GB (or other units such as MB), and the default is the number of bytes
ubuntu@VM-0-2-ubuntu:~/python_file$ df -h
Filesystem      Size  Used Avail Use% Mounted on
udev            1.9G     0  1.9G   0% /dev
tmpfs           379M  6.9M  372M   2% /run
/dev/vda1        50G   19G   29G  41% /
tmpfs           1.9G   24K  1.9G   1% /dev/shm
tmpfs           5.0M     0  5.0M   0% /run/lock
tmpfs           1.9G     0  1.9G   0% /sys/fs/cgroup
/dev/loop0       62M   62M     0 100% /snap/core20/975
/dev/loop2       85M   85M     0 100% /snap/protobuf/52
/dev/loop3       33M   33M     0 100% /snap/snapd/11588
tmpfs           379M     0  379M   0% /run/user/500
/dev/loop4       33M   33M     0 100% /snap/snapd/11841
overlay          50G   19G   29G  41% /var/lib/docker/overlay2/1dc4a0a89413f9af8da6bf84f78f980b248ef588f0ec7b316ec0d7bc74545cf7/merged
Sometimes, we may encounter the problem of insufficient disk space, because our index files also occupy part of the capacity. Use the - i parameter to check the size of the index:
ubuntu@VM-0-2-ubuntu:~/python_file$ df -i -h
Filesystem     Inodes IUsed IFree IUse% Mounted on
udev             466K   399  465K    1% /dev
tmpfs            474K  2.1K  471K    1% /run
/dev/vda1        3.2M  229K  3.0M    8% /
tmpfs            474K     7  474K    1% /dev/shm
tmpfs            474K     4  474K    1% /run/lock
tmpfs            474K    18  474K    1% /sys/fs/cgroup
/dev/loop0        12K   12K     0  100% /snap/core20/975
/dev/loop2        157   157     0  100% /snap/protobuf/52
/dev/loop3        474   474     0  100% /snap/snapd/11588
tmpfs            474K    74  473K    1% /run/user/500
/dev/loop4        474   474     0  100% /snap/snapd/11841
overlay          3.2M  229K  3.0M    8% /var/lib/docker/overlay2/1dc4a0a89413f9af8da6bf84f78f980b248ef588f0ec7b316ec0d7bc74545cf7/merged
How to measure disk performance
There are five common performance indicators for disks:
- Utilization: refers to the percentage of time that the disk processes I/O.
- Saturation: refers to the busy degree of disk processing I/O.
- IOPS: refers to the number of I/O requests per second.
- Throughput: refers to the size of I/O requests per second.
- Response time: refers to the interval between I/O sending and receiving response.
To observe these performance indicators, we need to use some tools: such as iostat, pidstat and so on.
Usage observation per disk: iostat
Tap the following command on the command line:
# -d -x indicates the indicator showing all disk I/O
ubuntu@VM-0-2-ubuntu:~/python_file$ iostat -d -x 1
Linux 4.15.0-140-generic (VM-0-2-ubuntu)        05/16/2021      _x86_64_        (2 CPU)

Device            r/s     w/s     rkB/s     wkB/s   rrqm/s   wrqm/s  %rrqm  %wrqm r_await w_await aqu-sz rareq-sz wareq-sz  svctm  %util
loop0            0.00    0.00      0.00      0.00     0.00     0.00   0.00   0.00    0.73    0.00   0.00     1.90     0.00   0.04   0.00
loop1            0.00    0.00      0.00      0.00     0.00     0.00   0.00   0.00    4.20    0.00   0.00     8.12     0.00   0.00   0.00
loop2            0.00    0.00      0.00      0.00     0.00     0.00   0.00   0.00    3.59    0.00   0.00    18.16     0.00   0.28   0.00
loop3            0.03    0.00      0.03      0.00     0.00     0.00   0.00   0.00    0.80    0.00   0.00     1.01     0.00   0.03   0.00
loop4            0.01    0.00      0.01      0.00     0.00     0.00   0.00   0.00    0.31    0.00   0.00     1.04     0.00   0.01   0.00
loop5            0.00    0.00      0.00      0.00     0.00     0.00   0.00   0.00    0.00    0.00   0.00     2.50     0.00   0.00   0.00
scd0             0.00    0.00      0.00      0.00     0.00     0.00   0.00   0.00    0.26    0.00   0.00     5.27     0.00   0.24   0.00
vda              0.48    8.76     15.28     93.19     0.00     3.51   0.03  28.59    1.98    2.07   0.02    32.11    10.64   0.21   0.19
iostat provides a wealth of performance indicators. In addition to the information about the machine in the first row, the specific explanations of the following columns are as follows:
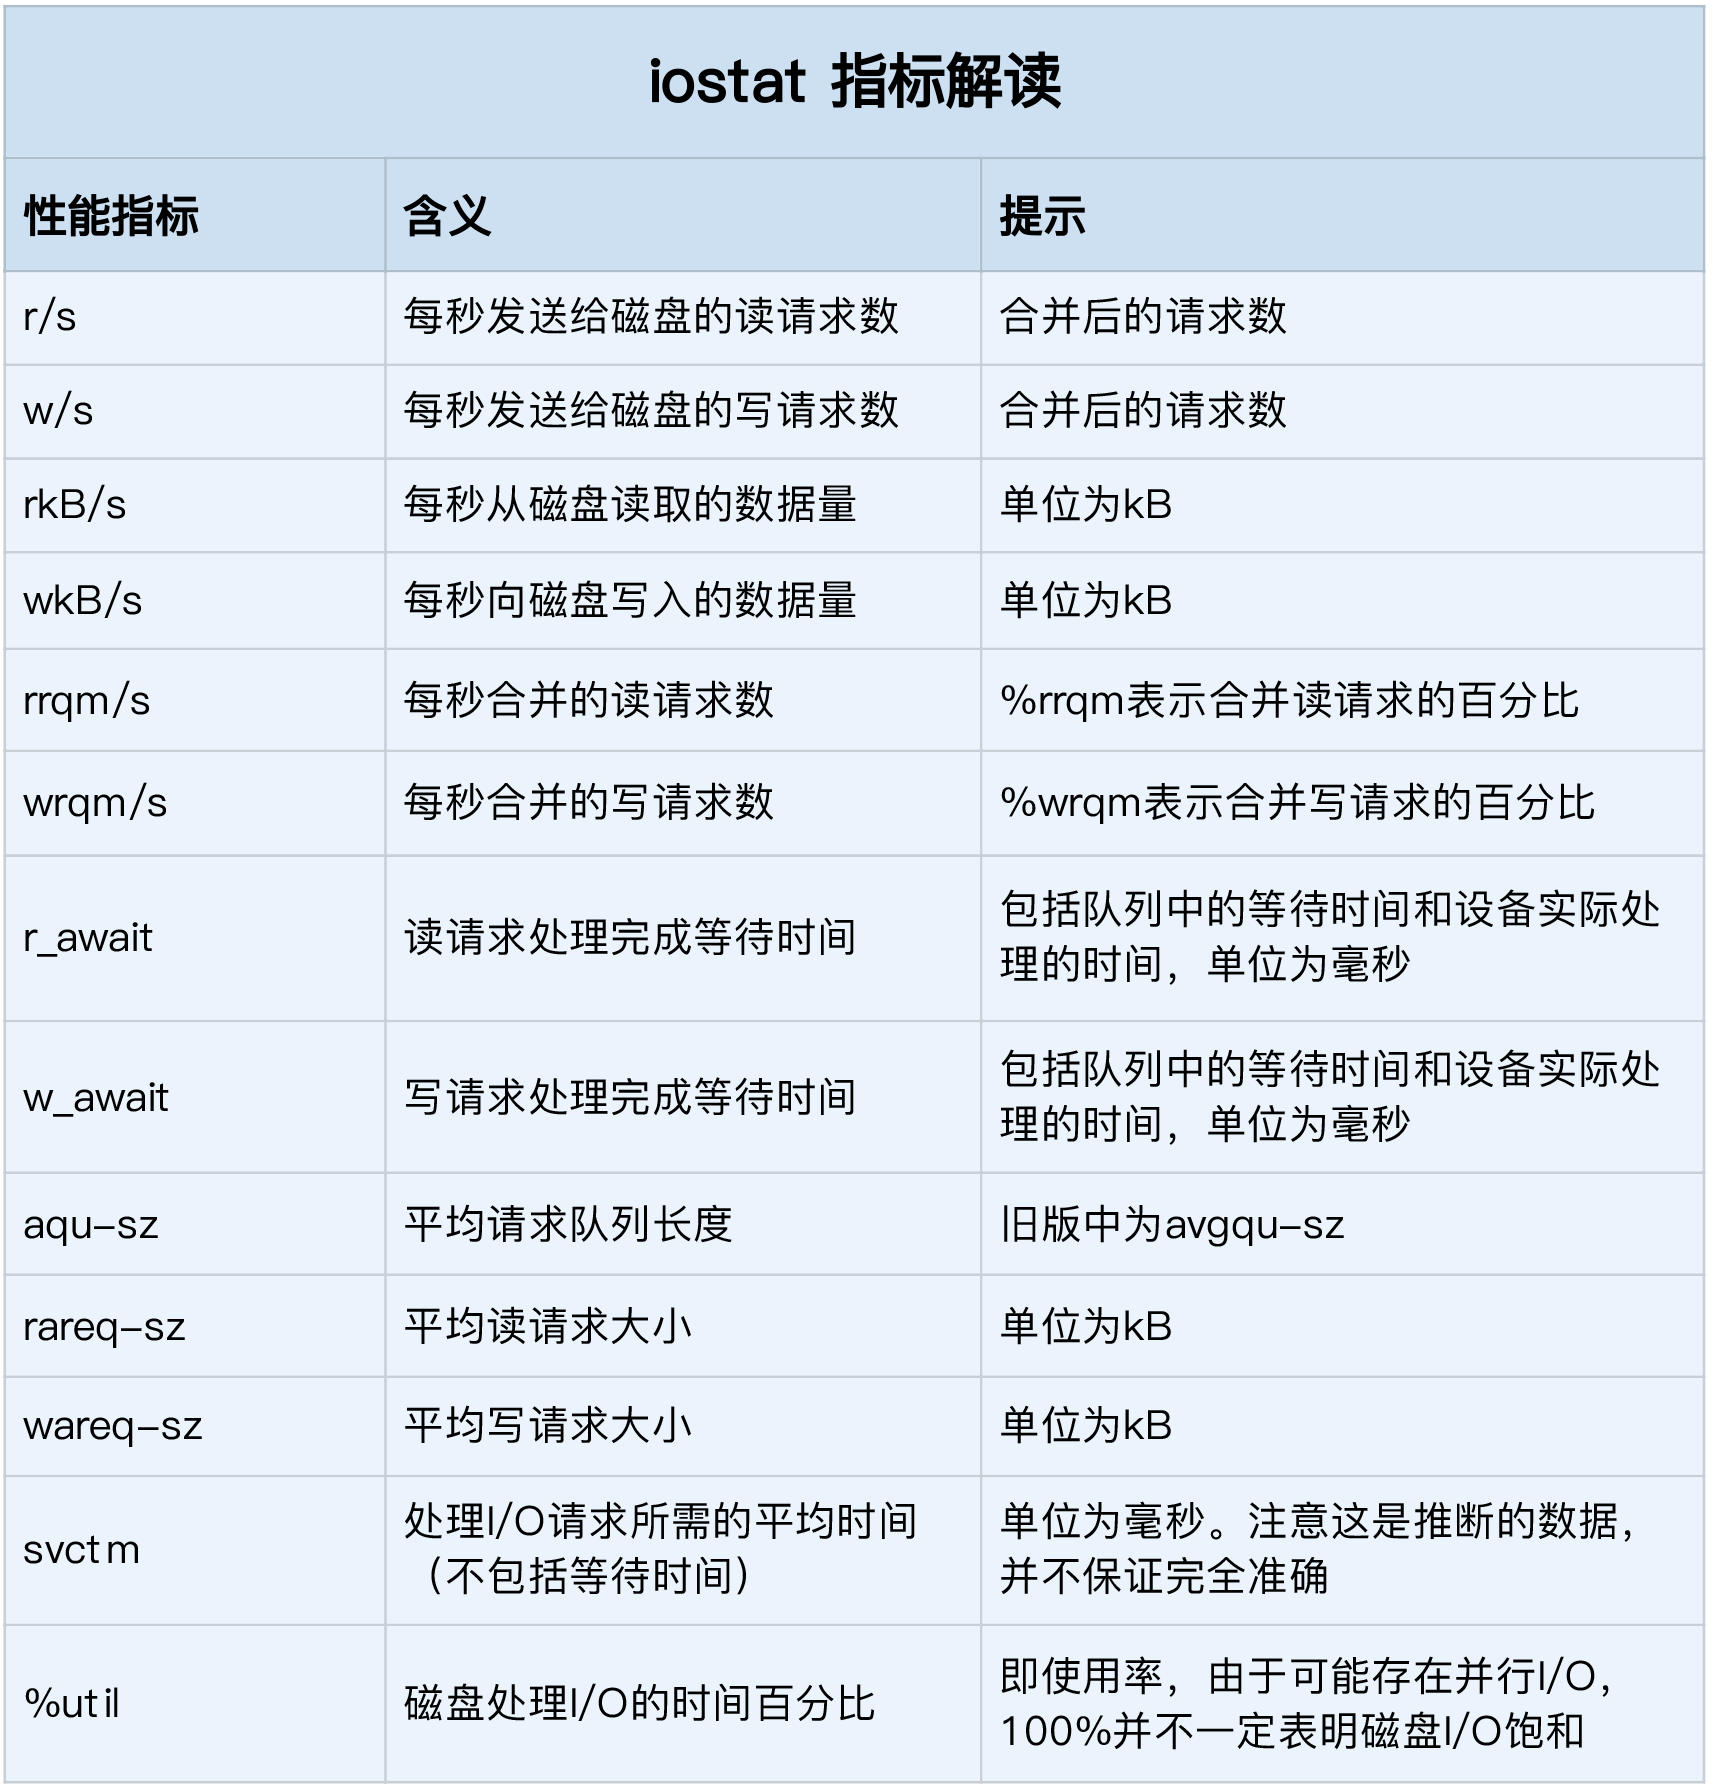
Among them, we mainly focus on the indicators in the following lines:
- %util: disk I/O usage
- r/s + w/s: IOPS
- rkB/s + wkB/s: throughput
- r_await + w_await: response time
Process io observation: pidstat, iotop
iostat can only observe about one I/O of each disk. If we want to observe the disk I/O occupied by the process, we need to use pidstat tool:
# -d means to check the disk condition
ubuntu@VM-0-2-ubuntu:~/python_file$ pidstat -d 1
Linux 4.15.0-140-generic (VM-0-2-ubuntu)        05/16/2021      _x86_64_        (2 CPU)

02:25:11 PM   UID       PID   kB_rd/s   kB_wr/s kB_ccwr/s iodelay  Command
Since the machine does not run programs that consume disk IO at present, there is no printing here, but we still need to pay attention to these columns:
- UID: user id
- PID: process id
- kB_wr/s: write request data size per second
- kB_wr/s: read data size per second
- kB_ccwr/s: the size of write request data cancelled per second
- iodelay: block IO delay, including the time to wait for the end of synchronization block IO and swap in block IO, but it is a time cycle
In addition to pidstat viewing disk IO information, we can also use the iotop command to view it. Iotop can sort the disk IO usage of processes:
ubuntu@VM-0-2-ubuntu:~/python_file$ sudo iotop
Total DISK READ :       0.00 B/s | Total DISK WRITE :      19.23 K/s
Actual DISK READ:       0.00 B/s | Actual DISK WRITE:      57.70 K/s

  TID  PRIO  USER     DISK READ  DISK WRITE  SWAPIN     IO>    COMMAND
  355 be/3 root        0.00 B/s    0.00 B/s  0.00 %  0.25 % [jbd2/vda1-8]
11845 be/4 root        0.00 B/s    0.00 B/s  0.00 %  0.01 % [kworker/u4:0]
  434 be/3 root        0.00 B/s   19.23 K/s  0.00 %  0.00 % systemd-journald
The first two lines represent the total disk read-write size and the real disk read-write size of the process respectively. Because of the influence of cache, buffer, IO merging and other factors, they may not be the same.
case analysis
Let's introduce a case of Ni Pengfei's disk performance Troubleshooting:
First, we run the following command at the interrupt:
ubuntu@VM-0-2-ubuntu:~/python_file$ docker run -v /tmp:/tmp --name=app -itd feisky/logapp
This will start a docker program packaged by teacher Ni Pengfei, and then we will interrupt the ps command to see whether the program is started successfully:
ubuntu@VM-0-2-ubuntu:~/python_file$ ps -ef | grep /app.py
If the following prints appear, the program runs successfully:
root     16310 16283 46 14:36 pts/0    00:00:13 python /app.py
ubuntu   16456 12437  0 14:37 pts/5    00:00:00 grep /app.py
Then we can use top to check the CPU and memory usage of the current system, and then use other tools to check:
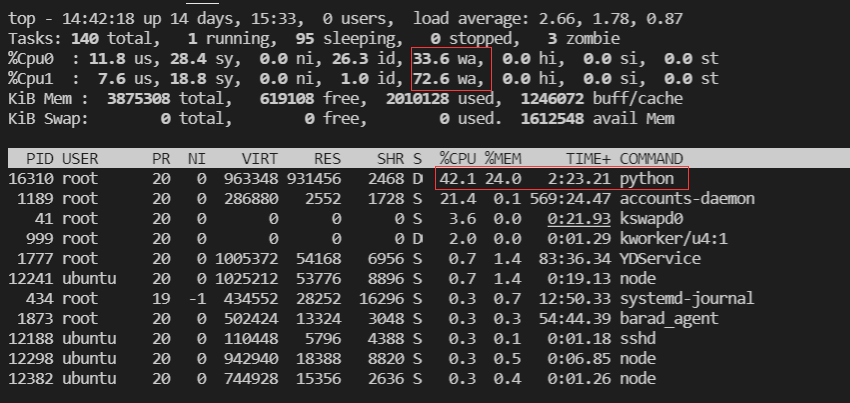
We can see that the iowait utilization rate of CPU1 is very high. It can be determined that IO intensive programs are running, and the python program occupying 42.1% is undoubtedly a suspect.
Now let's use the iostat command to view the current overall I/O situation:
ubuntu@VM-0-2-ubuntu:~/python_file$ iostat -x -d 1
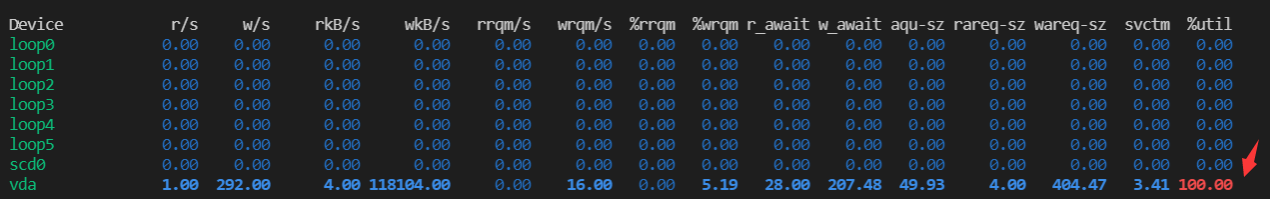
It can be seen that the IO utilization rate of disk vad has reached 100%, forming IO saturation. Let's use the pidstat command to see which process is responsible for this:
ubuntu@VM-0-2-ubuntu:~/python_file$ pidstat -d 1
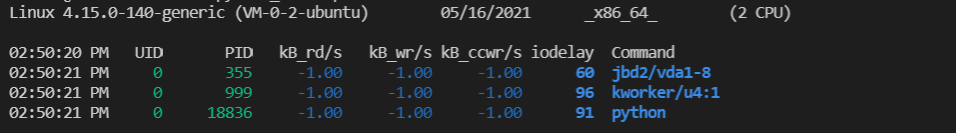
We can see that there are three threads running now, among which kworker and jdb2 are kernel threads used to ensure the basic functions of the file system, and the remaining python process is undoubtedly the culprit.
Next, let's use strace to see what the python process is doing:
ubuntu@VM-0-2-ubuntu:~/python_file$ sudo strace -p 18836
strace: Process 18836 attached
mmap(NULL, 393220096, PROT_READ|PROT_WRITE, MAP_PRIVATE|MAP_ANONYMOUS, -1, 0) = 0x7f158636f000
mremap(0x7f158636f000, 393220096, 314576896, MREMAP_MAYMOVE) = 0x7f158636f000
munmap(0x7f159da70000, 314576896)       = 0
lseek(3, 0, SEEK_END)                   = 943718535
lseek(3, 0, SEEK_CUR)                   = 943718535
munmap(0x7f158636f000, 314576896)       = 0
close(3)                                = 0
stat("/tmp/logtest.txt.1", {st_mode=S_IFREG|0644, st_size=943718535, ...}) = 0
unlink("/tmp/logtest.txt.1")            = 0
stat("/tmp/logtest.txt", {st_mode=S_IFREG|0644, st_size=943718535, ...}) = 0
rename("/tmp/logtest.txt", "/tmp/logtest.txt.1") = 0
open("/tmp/logtest.txt", O_WRONLY|O_CREAT|O_APPEND|O_CLOEXEC, 0666) = 3
fcntl(3, F_SETFD, FD_CLOEXEC)           = 0
fstat(3, {st_mode=S_IFREG|0644, st_size=0, ...}) = 0
lseek(3, 0, SEEK_END)                   = 0
ioctl(3, TIOCGWINSZ, 0x7fffba4e6cb0)    = -1 ENOTTY (Inappropriate ioctl for device)
lseek(3, 0, SEEK_CUR)                   = 0
ioctl(3, TIOCGWINSZ, 0x7fffba4e6bd0)    = -1 ENOTTY (Inappropriate ioctl for device)
lseek(3, 0, SEEK_CUR)                   = 0
mmap(NULL, 314576896, PROT_READ|PROT_WRITE, MAP_PRIVATE|MAP_ANONYMOUS, -1, 0) = 0x7f159da70000
mmap(NULL, 314576896, PROT_READ|PROT_WRITE, MAP_PRIVATE|MAP_ANONYMOUS, -1, 0) = 0x7f158ae6f000
write(3, "2021-05-16 06:53:28,950 - __main"..., 314572844) = 314572844
Focus on the last line. The python process frantically writes 300MB files to the file with file descriptor 3, which is also the culprit of our high disk IO!
Let's use lsof to see which file the culprit is writing data to:
ubuntu@VM-0-2-ubuntu:~/python_file$ sudo lsof -p 18836
COMMAND   PID USER   FD   TYPE DEVICE  SIZE/OFF    NODE NAME
python  18836 root  cwd    DIR   0,51      4096 2630212 /
python  18836 root  rtd    DIR   0,51      4096 2630212 /
python  18836 root  txt    REG   0,51     28016 2624992 /usr/local/bin/python3.7
python  18836 root  mem    REG  252,1           2624992 /usr/local/bin/python3.7 (stat: No such file or directory)
...... # Omit some useless information
python  18836 root    0u   CHR  136,0       0t0       3 /dev/pts/0
python  18836 root    1u   CHR  136,0       0t0       3 /dev/pts/0
python  18836 root    2u   CHR  136,0       0t0       3 /dev/pts/0
python  18836 root    3w   REG  252,1 186933248  411519 /tmp/logtest.txt
The last line tells us, / TMP / logtest Txt file is the file that carries the culprit data. Once we find the culprit, we can check the corresponding source code. So far, the investigation is successful!
reference
[1] Ni Pengfei.Linux Performance Optimization Practice.Geek time