Performance test of each protocol layer
Forwarding performance
-
hping3: as a SYN attack tool, but it is more used as a performance tool to test the processing ability of network packets.
-
Pktgen: high performance network testing tool pktgen provided with Linux kernel. Pktgen supports a wealth of custom options to facilitate the construction of required network packages according to actual needs, so as to more accurately test the performance of the target server.
-
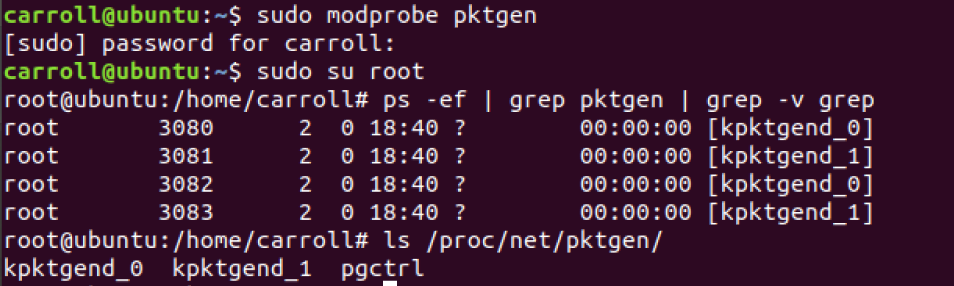
In Linux systems, the pktgen command cannot be found directly. Because pktgen runs as a kernel thread, you need to load the pktgen kernel module and then interact through the / proc file system. The following are the interactive files of the two kernel threads started by pktgen and the / proc file system:
-
Pktgen starts a kernel thread on each CPU and can interact with these threads through the file with the same name under / proc/net/pktgen; pgctrl is mainly used to control the start and stop of this test.
If the modprobe command fails, your kernel is not configured with config_ NET_ Pktgen option. This requires you to configure the pktgen kernel module (i.e. CONFIG_NET_PKTGEN=m) and recompile the kernel before it can be used.
-
When using pktgen to test network performance, you need to give each kernel thread kpktend first_ X and test the network card, configure the pktgen option, and then start the test through pgctrl.
TCP/UDP performance
- iperf and netperf are the most commonly used network performance testing tools to test the throughput of TCP and UDP.
- Start the iperf server on the target machine:
# -s represents the start-up server, - i represents the reporting interval, and - p represents the listening port
$ iperf3 -s -i 1 -p 10000
- Next, run the iperf client on another machine and run the test:
# -c means start the client, and 192.168.0.30 is the IP address of the target server
# -b represents the target bandwidth (in bits/s)
# -t is the test time
# -P indicates the number of concurrent and - P indicates the listening port of the target server
$ iperf3 -c 192.168.0.30 -b 1G -t 15 -P 2 -p 10000
- After the trial, go back to the target server and check the iperf report.
HTTP performance
ab, webch, etc. are commonly used HTTP stress testing tools. Among them, ab is Apache's own HTTP pressure test tool, which mainly tests the number of requests per second, request delay, throughput and distribution of request delay of HTTP service.
- On the target machine, use Docker to start an Nginx service, and then use ab to test its performance. First, run the following command on the target machine:
$ docker run -p 80:80 -itd nginx
- On another machine, run the ab command to test the performance of Nginx:
# -c indicates that the number of concurrent requests is 1000, - n indicates that the total number of requests is 10000
$ ab -c 1000 -n 10000 http://192.168.0.30/
Application load performance
wrk is an HTTP performance testing tool with built-in LuaJIT, which is convenient for you to generate the required request load or customize the response processing method according to the actual needs.
- When calling Lua script, wrk can divide the HTTP request into three stages: setup, running and done, as shown in the following figure:

Domain name and DNS resolution
DNS (Domain Name System), that is, Domain Name System, is the most basic service in the Internet. It mainly provides the query service of the mapping relationship between domain name and IP address.
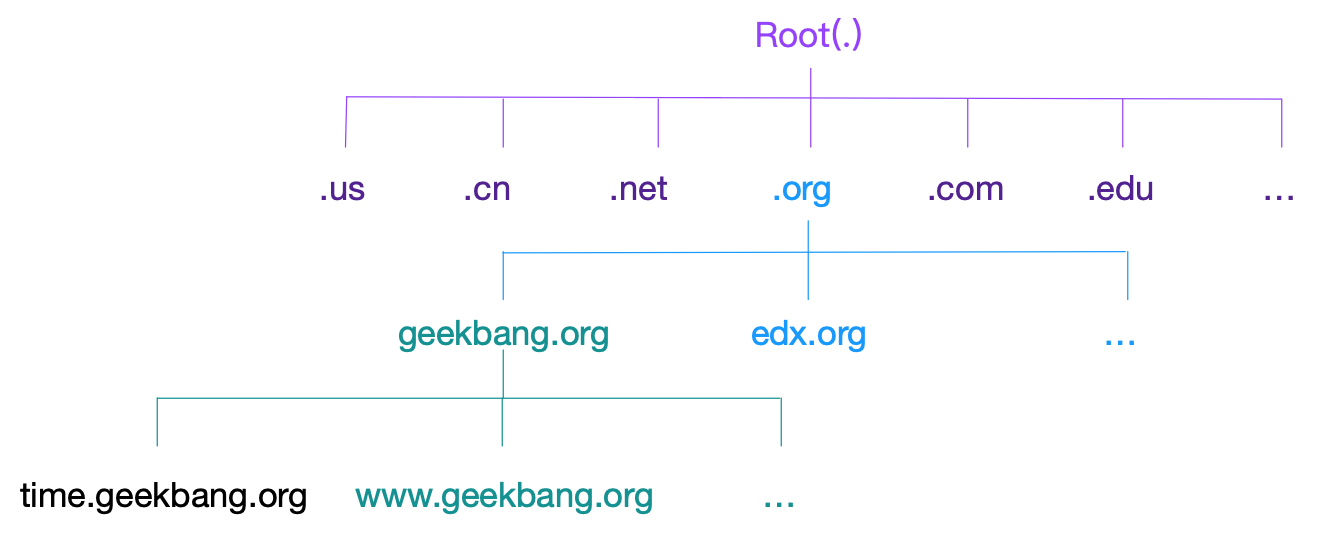
- The domain name is mainly for people to remember, and the IP address is the real mechanism of communication between machines. The service that converts a domain name to an IP address is the domain name resolution service (DNS), and the corresponding server is the domain name server, and the network protocol is the DNS protocol.
- DNS service manages all data through resource records. It supports A, CNAME, MX, NS, PTR and other types of records. For example:
- A record, which is used to convert the domain name into IP address;
- CNAME record, used to create alias;
- The NS record represents the domain name server address corresponding to the domain name.
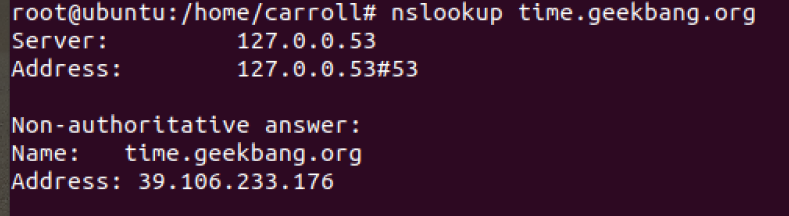
- When we visit A Web address, we need to query the IP address corresponding to the domain name through the A record of DNS, and then access the Web service through the IP.
- Query the A record of this domain name (time.geekbang.org):
- In addition to nslookup, another commonly used DNS resolution tool dig provides the trace function, which can show the whole process of recursive query. You can execute the following command to get query results:
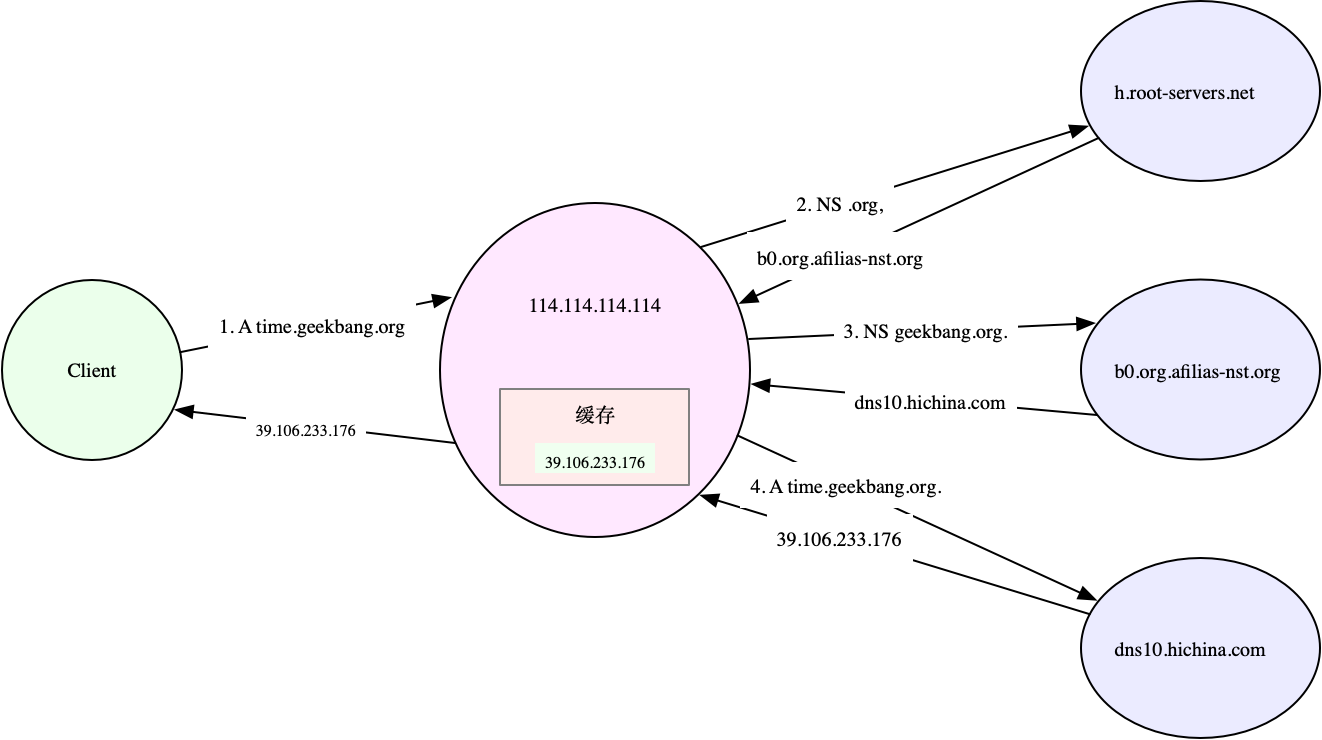
# +trace means to enable tracking query
# +nodnssec indicates that DNS Security extension is prohibited
$ dig +trace +nodnssec time.geekbang.org

; <<>> DiG 9.11.3-1ubuntu1.3-Ubuntu <<>> +trace +nodnssec time.geekbang.org
;; global options: +cmd
.			322086	IN	NS	m.root-servers.net.
.			322086	IN	NS	a.root-servers.net.
.			322086	IN	NS	i.root-servers.net.
.			322086	IN	NS	d.root-servers.net.
.			322086	IN	NS	g.root-servers.net.
.			322086	IN	NS	l.root-servers.net.
.			322086	IN	NS	c.root-servers.net.
.			322086	IN	NS	b.root-servers.net.
.			322086	IN	NS	h.root-servers.net.
.			322086	IN	NS	e.root-servers.net.
.			322086	IN	NS	k.root-servers.net.
.			322086	IN	NS	j.root-servers.net.
.			322086	IN	NS	f.root-servers.net.
;; Received 239 bytes from 114.114.114.114#53(114.114.114.114) in 1340 ms

org.			172800	IN	NS	a0.org.afilias-nst.info.
org.			172800	IN	NS	a2.org.afilias-nst.info.
org.			172800	IN	NS	b0.org.afilias-nst.org.
org.			172800	IN	NS	b2.org.afilias-nst.org.
org.			172800	IN	NS	c0.org.afilias-nst.info.
org.			172800	IN	NS	d0.org.afilias-nst.org.
;; Received 448 bytes from 198.97.190.53#53(h.root-servers.net) in 708 ms

geekbang.org.		86400	IN	NS	dns9.hichina.com.
geekbang.org.		86400	IN	NS	dns10.hichina.com.
;; Received 96 bytes from 199.19.54.1#53(b0.org.afilias-nst.org) in 1833 ms

time.geekbang.org.	600	IN	A	39.106.233.176
;; Received 62 bytes from 140.205.41.16#53(dns10.hichina.com) in 4 ms
- The output of dig trace mainly includes four parts.
- The first part is the NS records of some root domain name servers (.) found from 114.114.114.114.
- The second part is to select one of the NS record results (d.root-servers.net) and query the NS record of the top-level domain name org.
- The third part is to select one (b0.org.afilias-nst.org) from the NS records of org. And query the NS server of the secondary domain name geekbang.org.
- The last part is to query the A record of the final host time.geekbang.org. From the NS server of geekbang.org (dns10.hichina.com).
tcpdump and Wireshark analyze network traffic
- tcpdump and Wireshark are the most commonly used network packet capture and analysis tools, and they are also essential tools for analyzing network performance.
- tcpdump only supports the use of command line format. It is often used to capture and analyze network packets in the server.
- In addition to capturing packets, Wireshark also provides a powerful graphical interface and summary analysis tool, which is particularly simple and practical when analyzing complex network scenarios.
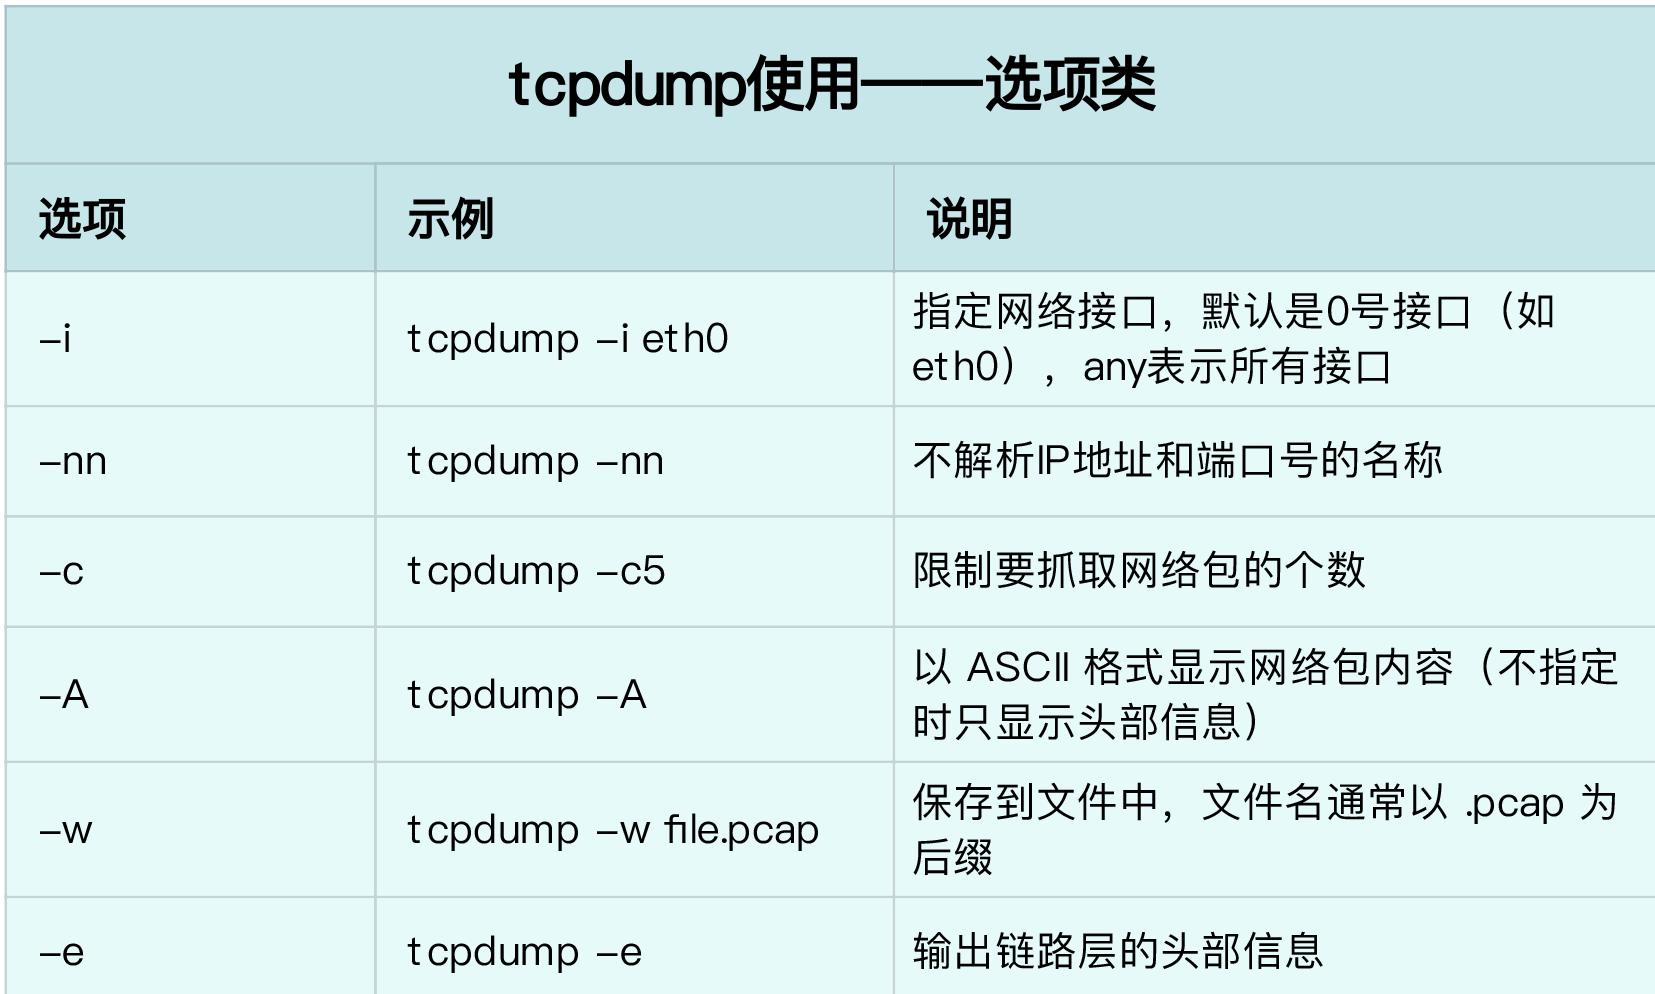
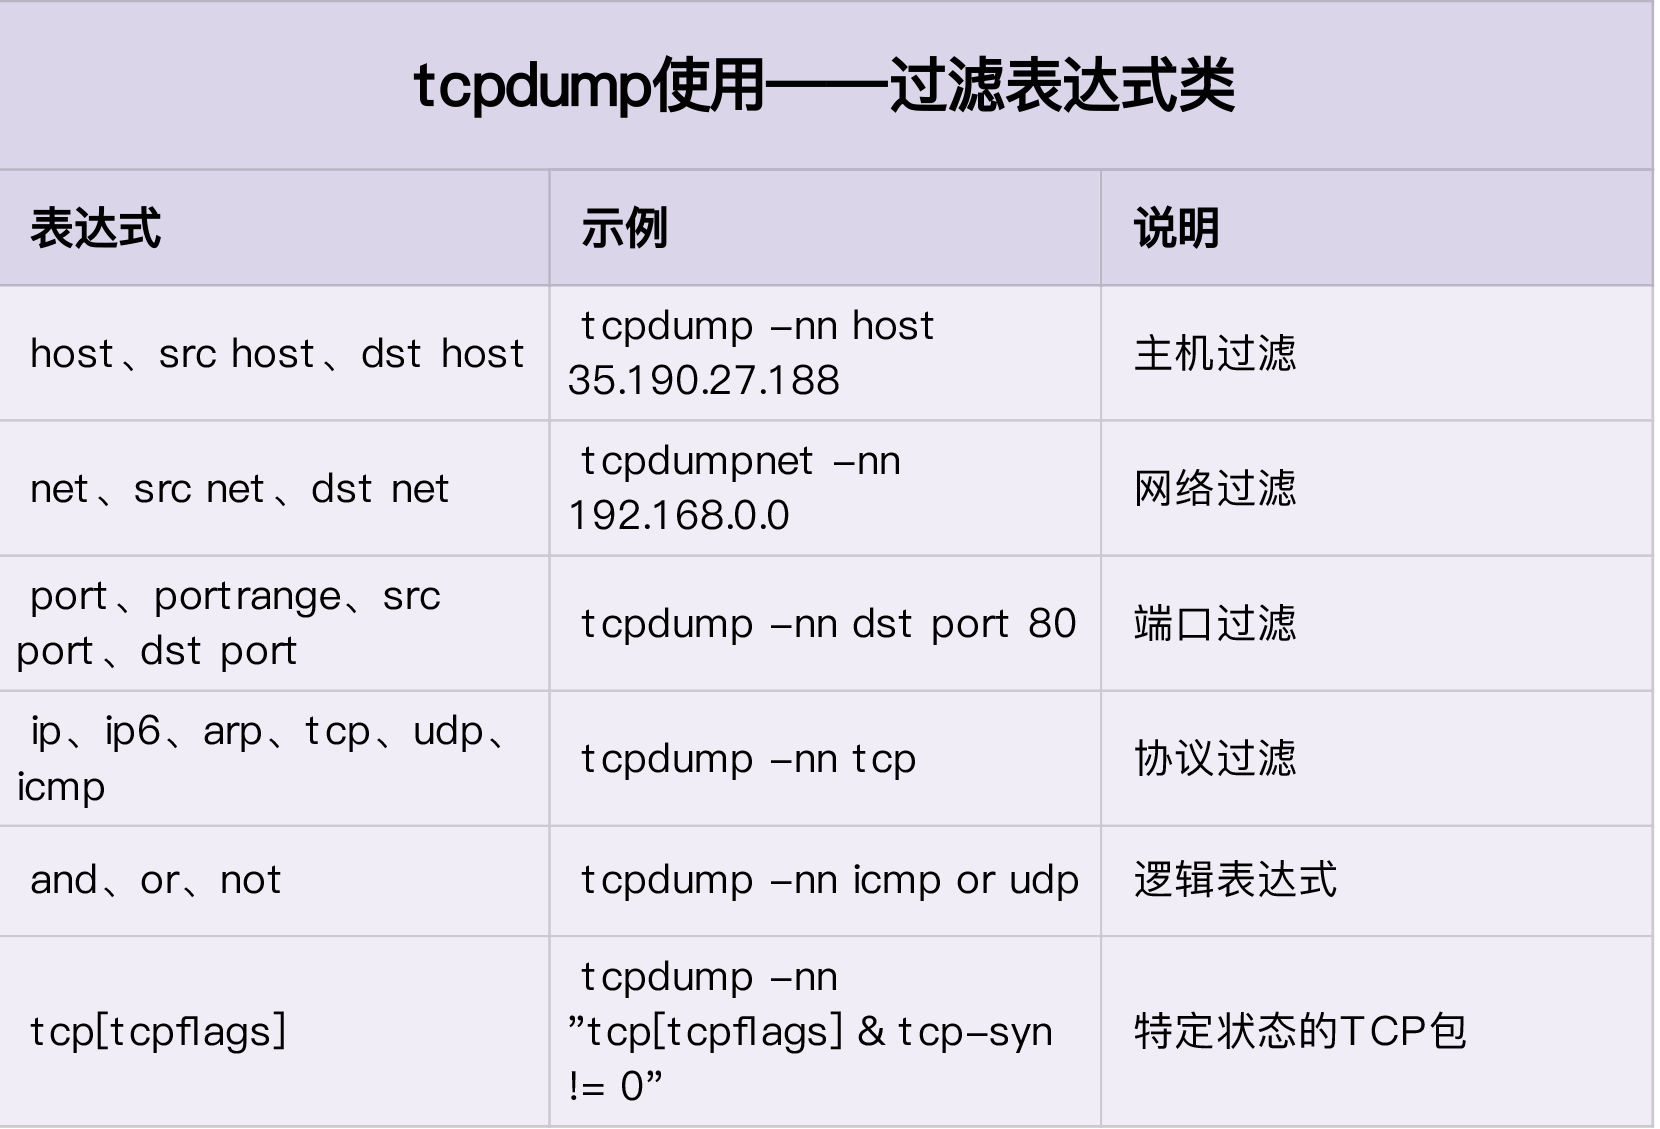
tcpdump usage
Wireshark use
Wireshark is also the most popular network analysis tool. Its biggest advantage is that it provides a cross platform graphical interface. Similar to tcpdump, Wireshark also provides powerful filter rule expressions and a series of built-in summary analysis tools.
The more you know, the more you don't know.