1. Process
1.1 ps command
There are many options for this command, so let's pick some common combinations to record.
1.1.1 ps aux
List processes executing in the system
[root@localhost sbin]# ps aux
USER        PID %CPU %MEM    VSZ   RSS TTY      STAT START   TIME COMMAND
root          2  0.0  0.0      0     0 ?        S    01:09   0:00 [kthreadd]
root          4  0.0  0.0      0     0 ?        S<   01:09   0:00 [kworker/0:0H]
root          6  0.0  0.0      0     0 ?        S    01:09   0:00 [ksoftirqd/0]
root          7  0.0  0.0      0     0 ?        S    01:09   0:00 [migration/0]
root          8  0.0  0.0      0     0 ?        S    01:09   0:00 [rcu_bh]
root          9  0.0  0.0      0     0 ?        R    01:09   0:00 [rcu_sched]
root         10  0.0  0.0      0     0 ?        S<   01:09   0:00 [lru-add-drain]
root         11  0.0  0.0      0     0 ?        S    01:09   0:00 [watchdog/0]
root         13  0.0  0.0      0     0 ?        S    01:09   0:00 [kdevtmpfs]
root         14  0.0  0.0      0     0 ?        S<   01:09   0:00 [netns]
root         15  0.0  0.0      0     0 ?        S    01:09   0:00 [khungtaskd]
root         16  0.0  0.0      0     0 ?        S<   01:09   0:00 [writeback]
root         17  0.0  0.0      0     0 ?        S<   01:09   0:00 [kintegrityd]
root         18  0.0  0.0      0     0 ?        S<   01:09   0:00 [bioset]
							...
The results are as shown above: explained as follows
	USER: User to whom the process belongs
	PID: Process Number
	%CPU: Process Occupancy CPU Percentage of resources
	%MEM: Percentage of process memory resources
	VSZ: The amount of virtual memory the process occupies
	RSS: The amount of physical memory the process occupies
	TTY: The terminal on which the process runs. Greetings indicate the system process
	STAT: Status of the current process
	START: Start time of process
	TIME: Process Occupancy CPU Operating time
	COMMAND: Process name
1.1.2 ps -le
Almost as above
1.1.3 ps -ef
1.2 top command
Dynamic display of system current information
1.2.1 Command Details
top - 08:50:04 up  7:40,  1 user,  load average: 0.00, 0.01, 0.05
Tasks: 167 total,   2 running, 165 sleeping,   0 stopped,   0 zombie
%Cpu(s):  0.3 us,  0.3 sy,  0.0 ni, 99.3 id,  0.0 wa,  0.0 hi,  0.0 si,  0.0 st
KiB Mem :   995664 total,    74344 free,   489700 used,   431620 buff/cache
KiB Swap:  2097148 total,  2095860 free,     1288 used.   332548 avail Mem
For the above output, make a simple introduction to avoid forgetting
| Owning Module | value | Explain | ||||
|---|---|---|---|---|---|---|
|
first line
Task Queue | 08:50:04 | Current System Time | ||||
| up 7:40 | The time the system has been turned on, 7 hours 40 minutes here | |||||
| 1 user | Indicates that a user is currently logged in | |||||
| load average: 0.00, 0.01, 0.05 |
The average load of the system is 1 minute, 5 minutes, and 15 minutes.
If the CPU is single core, then this number exceeds 1, which is a high load. If the CPU is quad-core, then this number exceeds 4, which is a high load. (The average load is entirely personal experience. It is generally agreed that the number of cores on the server CPU should not be exceeded.) | |||||
|
Second line
Process information | tasks: 167 total | The total number of processes in the system is 167 | ||||
| 2 running | Two running processes | |||||
| 165 sleeping | 165 processes are dormant | |||||
| 0 stopped | 0 processes stopping | |||||
| 0 zombie | Number of zombie processes, if not 0, need to be checked manually | |||||
|
Third line
CPU Info | 0.3 us | Percentage of CPU occupied by users | ||||
| 0.3 sy | Percentage of CPU occupied by the system | |||||
| 0.0 ni | Percentage of CPU occupied by user processes that have changed priority | |||||
| *99.3 id | *Ratio of idle CPU s | |||||
| 0.0 wa | Percentage of processes waiting for input\output | |||||
| 0.0 hi | Percentage of CPU occupied by hard interrupt request service | |||||
| 0.0 si | Percentage of CPU occupied by soft interrupt request service | |||||
| 0.0 st | Percentage of virtual time, which is the percentage of time a virtual CPU waits for an opportunity CPU when a virtual machine is available | |||||
|
Line 4
Physical memory information | 995664 total | Total amount of physical memory (kb) | ||||
| 489700 used | Used physical memory (kb) | |||||
| 74344 free | Remaining physical memory (kb) | |||||
| 431620 buff/cache | Memory size as cache | |||||
|
Line 5
Exchange partition information | 2097148 total | Total swap partition size (kb) | ||||
| 2095860 free | Remaining swap memory size (kb) | |||||
| 1288 used | Swap memory size used (kb) | |||||
| 332548 avail Mem | --- | |||||
1.2.2 Interactive Commands
- M: Sort by memory usage size
- P: Sort by CPU
- q: launch top
1.2.3 Command Options
- Top-p process ID > just look at a process's information
- -b: Show all processes
- -n: Specify how many times to refresh
- Top-b-n 1 >>/tmp/test All processes and are displayed and only refresh the saved file once
1.3 pstree command
View process dependencies
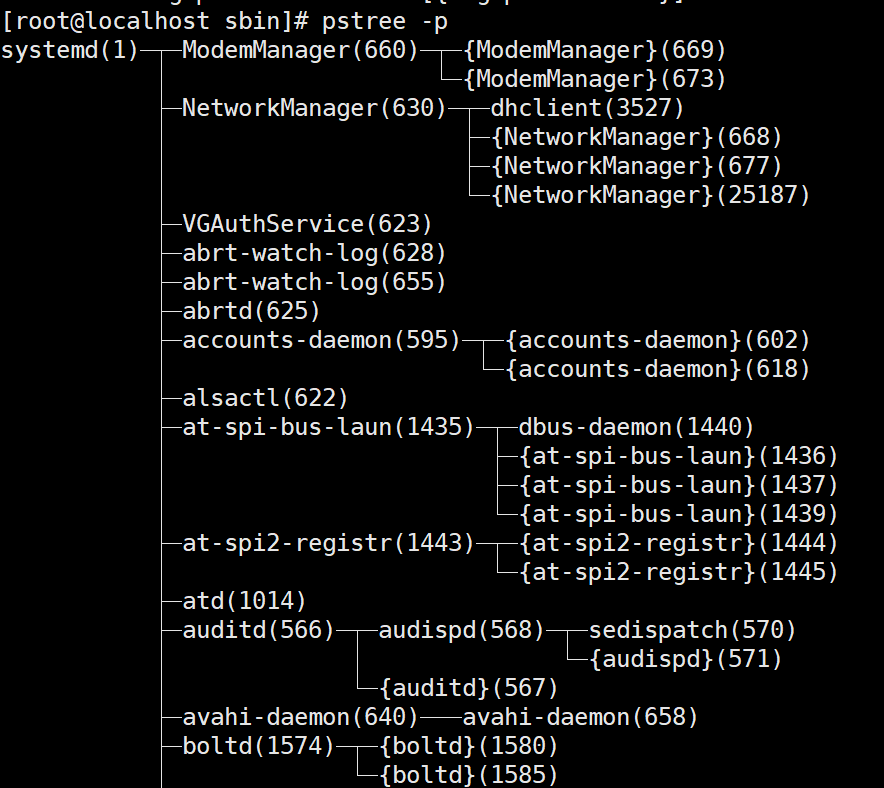
-p: Show port number opposite
1.4 Process Management
1.4.1 kill Command
- Kill-1 process number: Reread profile launcher
- Kill-9 process number: Force process termination
1.4.2 killall command
- Killall-9 process name: Force killing process
-i: kill interactively
1.4.3 pkill command
- Same usage as killall
- Pkill-9-t pts/0: exclude user pts/0