1. Use gcc compiler to compile and run C + + multiple files
First, we need to understand the compilation process of gcc.
1.1 gcc compilation process
The gcc compilation process is divided into four steps: preprocessing, compilation, assembly and linking
Let's take a simple output file test CPP to demonstrate the four-step compilation process of gcc.
test.cpp code is as follows:
#include <iostream>
using namespace std;
int main()
{
        cout << "This my first cpp programer in Linux" << endl;
        return 0;
}
1. Pre processing
Preprocessing generates a i file is actually expanding the header file of include.
# -The E option instructs the compiler to preprocess the input file
g++ -E test.cpp -o test.i
The final results of the preprocessing file are as follows:
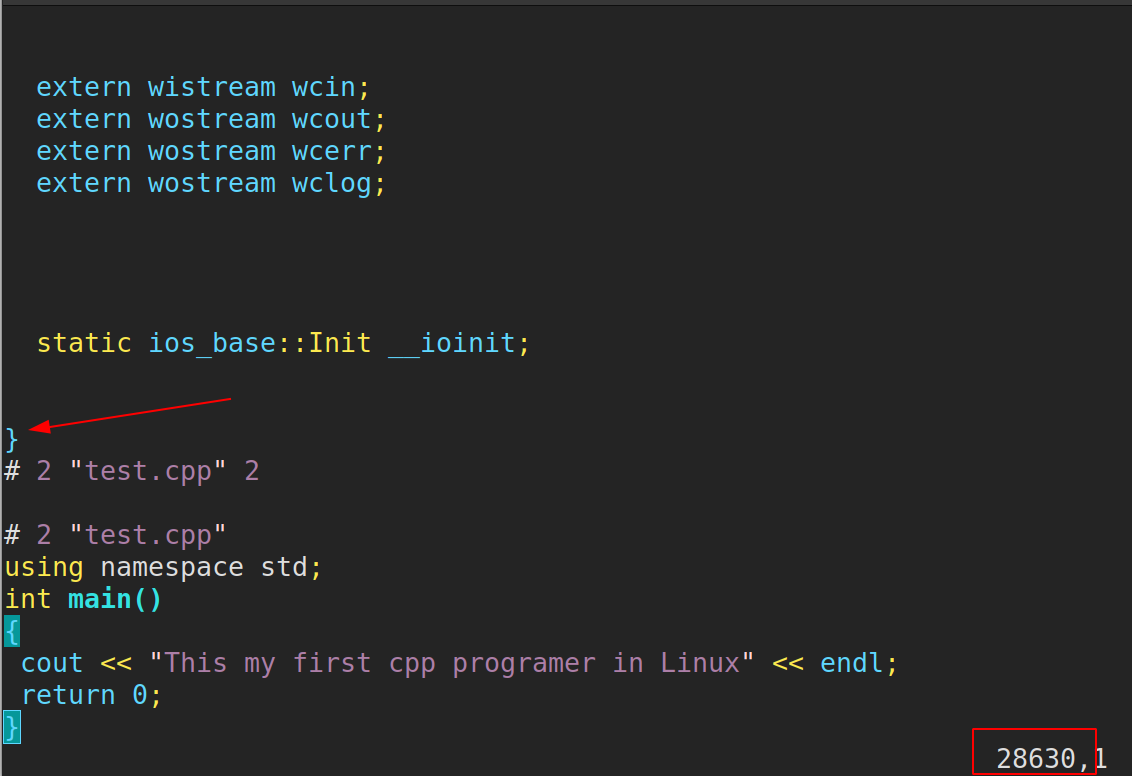
We can see that the file is much larger than the original. The preprocessing expands the header file iostream, and the other parts are basically unchanged.
2. Compiling
Compile and generate s file, the compilation process is to convert C code into assembly language.
# -The S compilation option tells g + + to stop compiling after generating assembly language for C + + code
# The default extension of assembly language files generated by g + + is s
g++ -S test.i -o test.s
Produced Some results of s file are as follows:
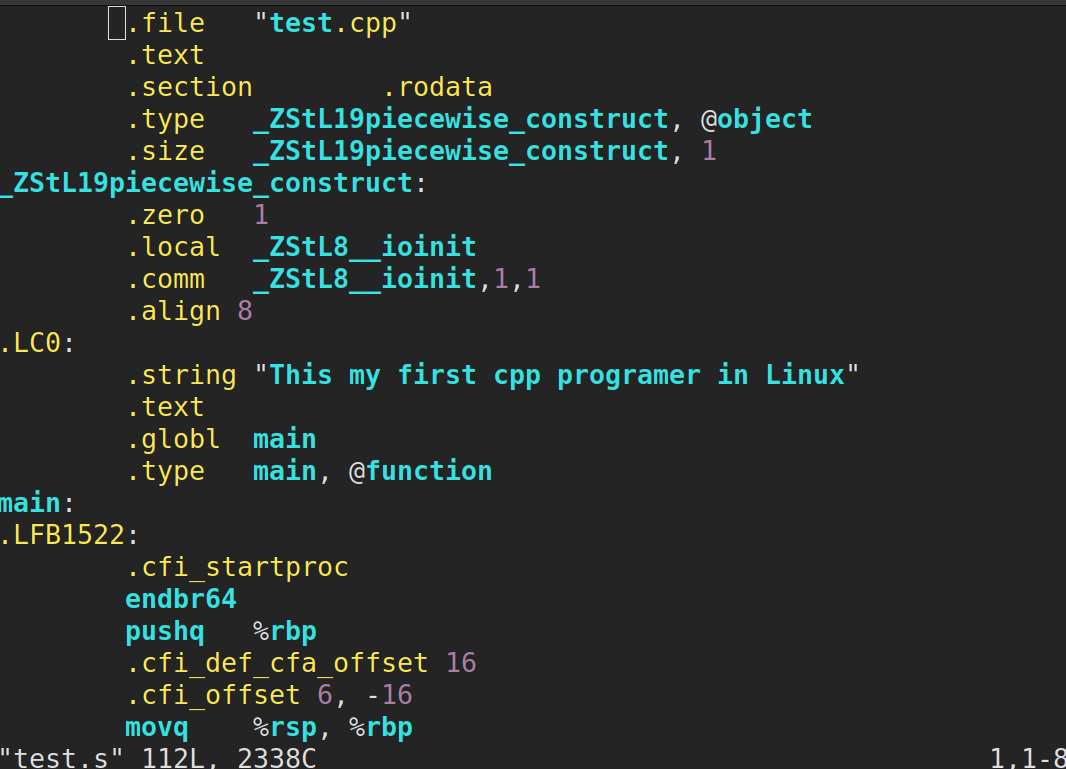
You can see many assembly instructions.
3. Assembly
Assembly is generated by compiling s file is converted into binary language to generate a o documentation.
# -The C compile option tells g + + to stop compiling for C + + code into machine language
# By default, the object code created by g + + has one o extension
g++ -c test.s -o test.o
test.o the results of some documents are as follows:
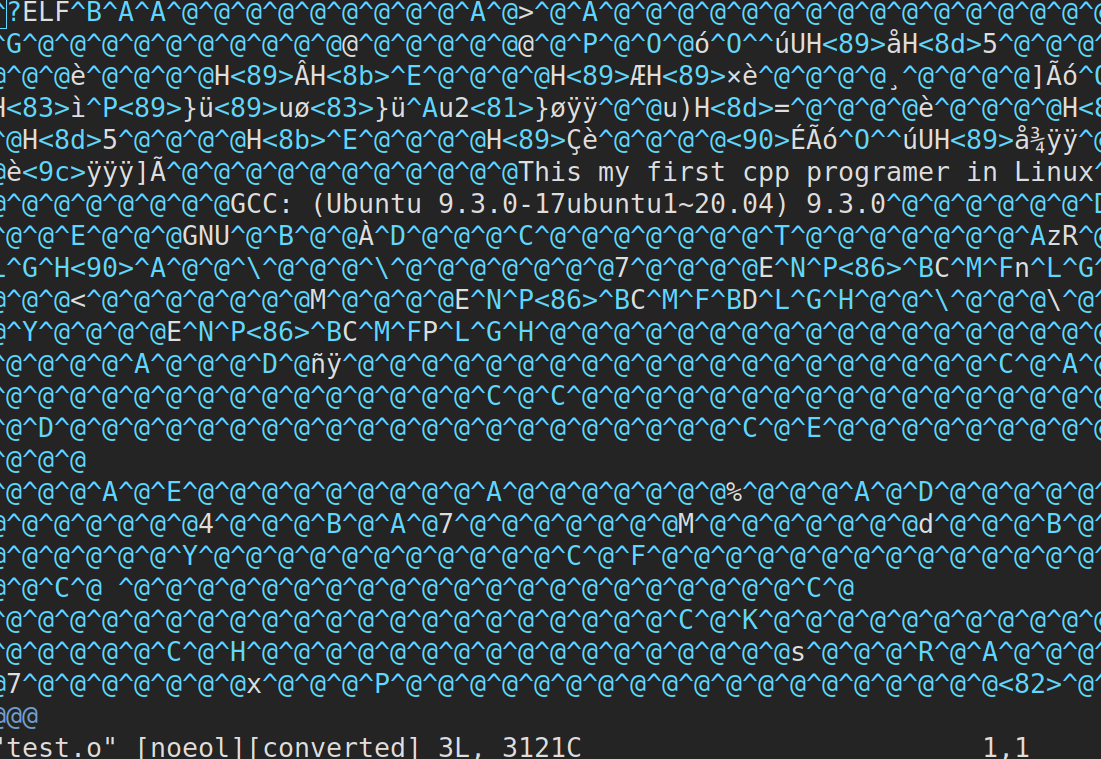
It can be seen that the code is garbled because vim does not recognize the machine language.
4. Linking
Generate an executable file after linking other files required.
# -o compile option to use the specified file name for the executable to be generated
g++ test.o -o test
Run the executable, using/ test, and the results are as follows:

1.2 g + + important compilation parameters
1.-g compile the executable with debugging information
# -The g option tells GCC to generate debugging information that can be used by the GNU debugger to debug the program.

# Generate executable file test with debugging information
g++ -g test.cpp -o test
2.-O[n] optimize source code
## The so-called optimization, such as omitting unused variables in the code, directly replacing constant expressions with result values, etc. these operations will see the amount of code contained and improve the operation efficiency of the finally generated executable file

# -The O option tells g + + to make basic optimization of the source code. In most cases, these optimizations will make the program execute faster- The O option tells g + + to produce code as small and as fast as possible.

# -O simultaneously reduces the length and execution time of the code, and the effect is equivalent to - O1
# -O0 means no optimization
# -O1 is the default optimization
# -After O2 completes the optimization of - O1, carry out some additional adjustment work, such as instruction adjustment
# -O3 includes loop unrolling and other optimization work related to processing characteristics
# Option will make compilation slower than - O, but usually the resulting code executes faster.

# Use - O2 to optimize the source code and output the executable file
g++ -O2 test.cpp -o test_with_O2
3.-l and - L specify library file | specify library file path
# -The l parameter (lower case) is used to specify the library to which the program is to link, and the - l parameter is followed by the library name
# Libraries in / lib and / usr/lib / and usr/local/lib can be linked directly with the - l parameter

# Link glog Library
g++ -lglog test.cpp

# If the library file is not placed in the above three directories, you need to use the - L parameter (uppercase) to specify the directory where the library file is located
# -The L parameter is followed by the directory name where the library file is located

# Link the mytest library, libmytest So in / home/bing/mytestlibfolder directory
g++ -L/home/bing/mytestlibfolder -l libmytest test.cpp
4.-I specifies the header file search directory
# -I
# /Generally, the usr/include directory does not need to be specified. gcc knows where to find it. However, if the header file is not in / usr/include, we need to specify it with the - I parameter. For example, if the header file is in the / myinclude directory, the - I/myinclude parameter will be added to the compilation command line. If it is not added, an error of "xxxx.h: No such file or directory" will be obtained, and - I can also be specified with a relative path.

g++ -I/myinclude test.cpp
- -Wall print warning message
- -w turn off warning message
- -std=c++11 set compilation standard
- -o specifying the output file name will output a.out file by default
- -D define macros
# Define macros when compiling with gcc/g + +

# Common scenarios
# -DDEBUG defines the DEBUG macro. There may be information about the DEBUG macro in the file. Use a DDEBUG to select whether to turn on or off DEBUG
Examples are as follows:
// -Dname defines the macro name. The default definition content is the string "1"

# include <stdio.h>
{
	using std::cout;
	#ifdef DEBUG
		printf("DEBUG LOG\n");
	#endif
		printf("in\n");
}
1.3 compiling with g + + command line
Use g + + compiler to compile multi file programs with the following directory structure.
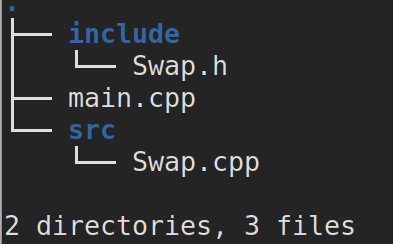
The contents of the three documents are as follows:
// include file and definition of prototype
#include <iostream>
void Swap(int &a, int &b);
// definition of function
#include "Swap.h"
void Swap(int &a, int &b)
{
        int temp;
        temp = a;
        a = b;
        b = temp;
}
// main function
#include "Swap.h"

int main()
{
        using namespace std;
        int a = 10;
        int b = 20;
        cout << "a = " << a << endl;
        cout << "b = " << b << endl;
        Swap(a,b);
        cout << "After Swap(a,b)" << endl;
        cout << "a = " << a << endl;
        cout << "b = " << b << endl;
        return 0;
}
1.3.1 direct compilation
Input the following command at the terminal,
g++ main.cpp ./src/Swap.cpp -Iinclude
An a.out executable file will be generated, and the execution results are as follows:

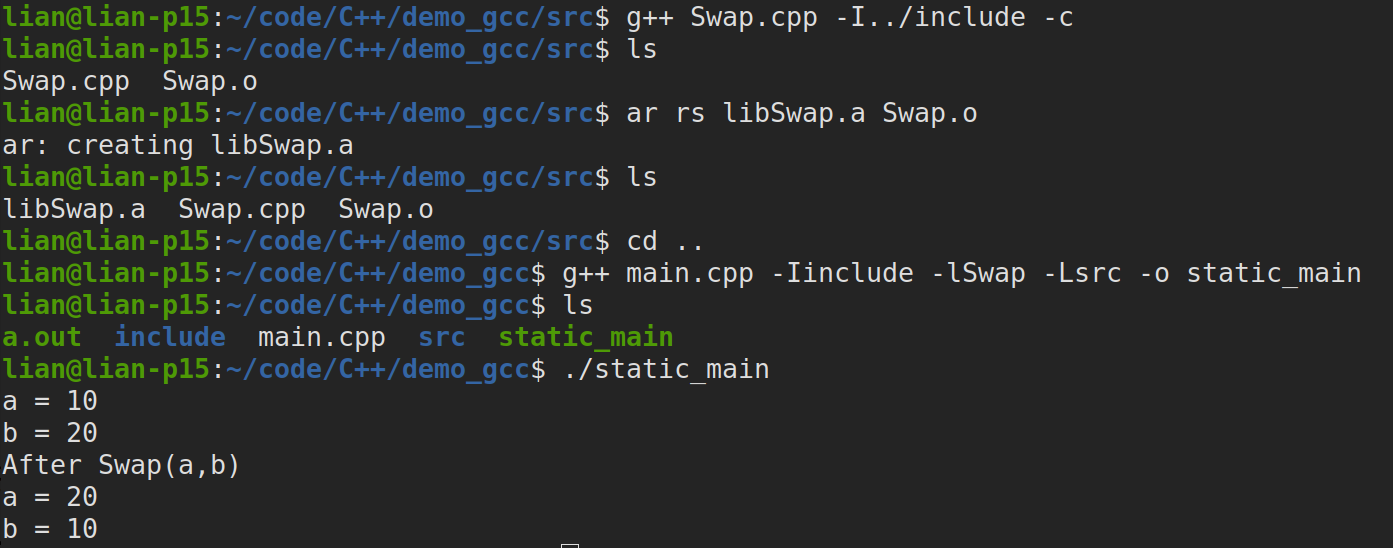
1.3.2 generate library files and compile
- Linked static libraries generate executables:
## Enter the src directory
cd src

# Assemble and generate swap O the order of files - c and - I can be reversed
g++ Swap.cpp -c -I../include
# Generate static library libswap a
ar rs libSwap.a Swap.o

## Go back to the parent directory
cd ..

# Link to generate executable file: staticmain
g++ main.cpp -Iinclude -lSwap -Lsrc -o staticmain
Pass/ staticmain runs the file, and the results are as follows:
- Link dynamic library to generate executable file:
## Enter the src directory
cd src

# Generate dynamic library libswap so
g++ Swap.cpp -I../include -fPIC -shared -o libSwap.so
## The above command is equivalent to the following two commands
# g++ Swap.cpp -I../include -c -fPIC
# gcc -shared -o libSwap.so Swap.o

## Go back to the parent directory
cd ..

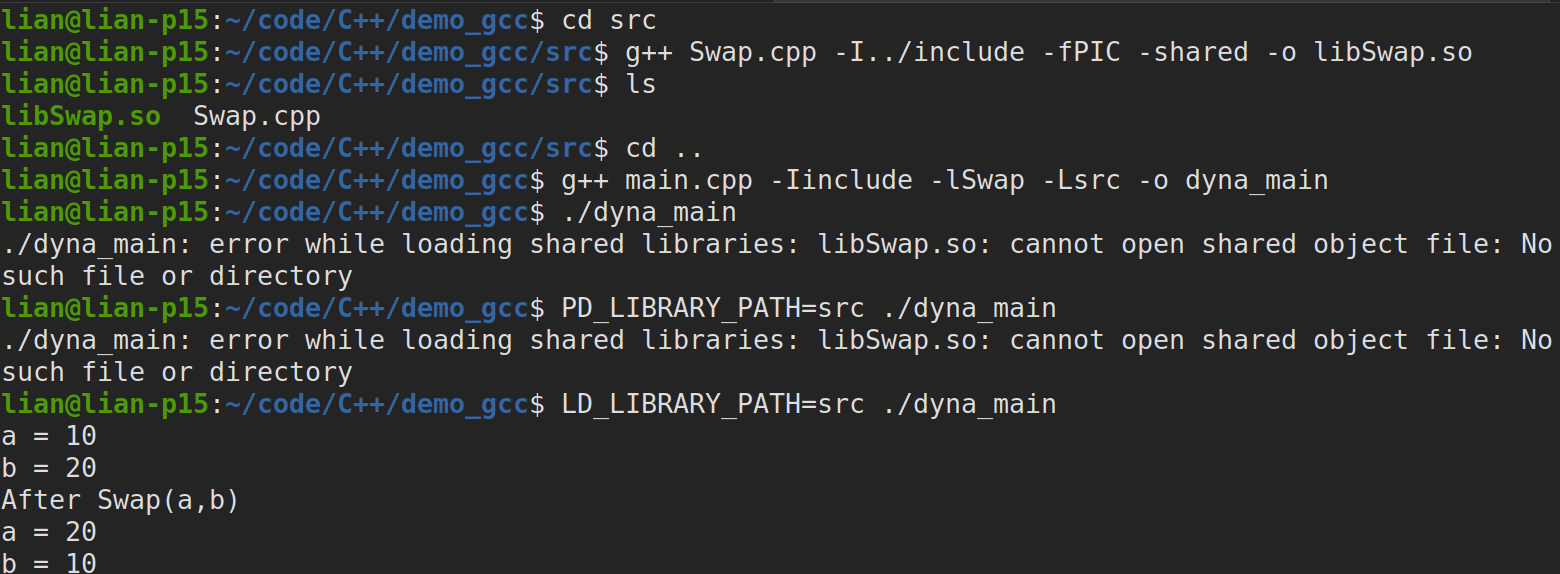
# Link, generate executable: dyna_main
g++ main.cpp -Iinclude -lSwap -Lsrc -o dyna_main
Input/ dyna_main to run the file, and a running error will be prompted:
./dyna_main: error while loading shared libraries: libSwap.so: cannot open shared object file: No such file or directory
The reason for this error is the need to add libswap The path of so, run with the following command:
LD_LIBRARY_PATH=src ./dyna_main
The operation results are as follows:
2. Use gdb debugger to debug the code
GDB introduction:
- GDB(GNU Debugger) is a powerful debugger for debugging C/C + + programs. It is the most commonly used debugger for developing C/C + + in Linux system.
- Programmers can use GDB to track errors in programs, thus reducing the workload of programmers.
- Vscade realizes C/C + + debugging through GDB debugging.
Main functions of GDB:
- Set breakpoints (breakpoints can be conditional expressions)
- Pause the execution of the program on the specified code for easy observation
- Single step program execution, easy to debug
- View the change of variable value in the program
- Dynamically change the execution environment of the program
- Analyze the core file generated by the crash program
4.1 common debugging command parameters
Debug execution: execute gdb [execilename] to enter the gdb debugger, where execilename is the executable file name to debug
## The following commands are simplified in parentheses, such as rur(r). Entering r represents run

(gdb)help(h) 	# View the command help and enter the help + command in gdb

(gdb)run(r)	# Restart running the file (run text: load text file, run Bin: load binary file)

(gdb)start	# Single step execution, run the program, stop at the first line and execute the statement

(gdb)list(l)	# View the source code (list-n, view the code from line n. list + function name: view the specific function)

(gdb)set	# Set the value of the variable

(gdb)next(n)	# Single step debugging (process by process, direct function execution)

(gdb)step(s)	# Single step debugging (statement by statement: jump into the custom function for execution)

(gdb)backtrace(bt) # View the stack frame and hierarchy of function calls

(gdb)frame(f)	# Switch stack frame of function

(gdb)info(i)	#View the value of a function's internal variable

(gdb)finish	# Ends the current function and returns to the function call point

(gdb)continue(c) # Continue running

(gdb)print(p)	#Print value and address

(gdb)quit(q)	# Exit gdb
(gdb)break+num(b)	# Set breakpoint on num line

(gdb)info breakpoints	# View all currently set breakpoints

(gdb)delete breakpoints num(d)	#Delete num breakpoint

(gdb)display	# Track and view specific variable values

(gdb)undisplay	# Cancel tracking observation variables

(gdb)watch	# When the variable of the observation point is modified, it will be printed and displayed

(gdb)i watch	# Show observation points

(gdb)enable breakpoints	# Enable breakpoints

(gdb)disable breakpoints	# Disable breakpoints

(gdb)x	# View the memory x/20xw, display 20 units, hexadecimal, 4 bytes, no unit

(gdb)run argv[1] argv[2]	# Command line parameters during debugging

(gdb)set follow-fork-mode child	# Makefile project management: select to track parent-child processes (fork())
Tips:
1. Add - g when compiling the program, and then use GDB - g main c -o main
2. Enter: repeat the previous command