
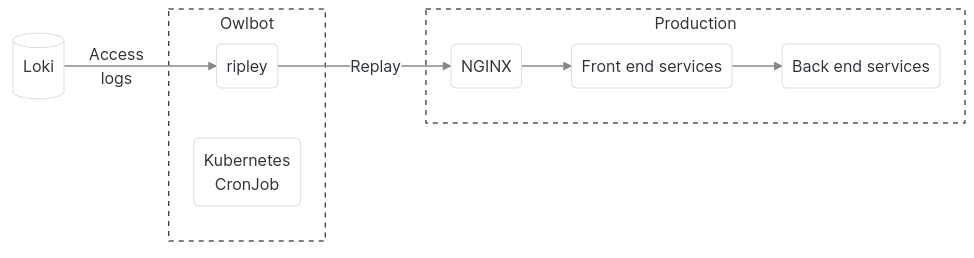
The period from December 26 to early February is one of the periods of increased holiday trading activities in the UK, which is the peak in loveholidays. During peak periods, loveholidays The throughput of COM is more than 10 times higher than the average level. In order to ensure that our services can withstand the load, we continuously test the traffic of the production environment access logs by relocating them to our staging and production environment in multiple of the original throughput. The load test will run against the production environment at night because there is less traffic in the UK and Ireland. The system we test against the production environment at night is built around Grafana Loki, Kubernetes CronJob and our open source HTTP traffic playback tool called ripley. We call this system Owlbot.
Replayable access log
By using access log replay traffic, you can truly understand the distribution of requests, such as how many users have clicked on the home page and search results page, or the proportion of users who search all destinations to those who only search Mallorca vacation. Since this distribution between different types of requests affects performance, it may be more difficult to replicate real traffic using script synthesis load tests.
We store access logs together with all our service logs in Grafana Loki to improve efficiency. Also, because it is a native project of Prometheus/Grafana ecosystem, which is an integral part of our monitoring stack, we use Loki instead of other customized solutions, which is in line with our principle of focusing on differentiation engineering, As well as the principle of focusing on simplicity, only the minimum configuration is required, and there is no intermediate system, such as GCS, which we have tried on earlier versions of the system.
By storing all our access logs in Loki, we can also capture periods of performance degradation or events leading to interruption, so that we can replay them to prove our subsequent improvement.
We use the access logs from NGINX, which is the entry point of our production cluster. When collecting these logs, we will exclude some sensitive data, such as personal identity information.
Replay access logs using Ripley
Ripley is a Go tool we wrote, inspired by Vegeta HTTP load test tool. Other load test tools usually generate loads at a configured rate, such as 100 requests per second. This constant load can not accurately represent user behavior. By default, Ripley replicates at exactly the same rate as requests in production. It also allows fast (or slow) playback in multiples of the recording rate, which is closer to the behavior of natural traffic. In loveholidays In the case of COM, natural traffic usually does not burst suddenly. This real traffic simulation is very useful for adjusting Kubernetes' Horizontal Pod Autoscaler (HPA). We use it to flexibly expand our services when throughput increases and decreases.
For example, in a discovery example related to HPA adjustment, during operation, we noticed that one of our services was difficult to handle the increased load, and the HPA of the service was based on CPU utilization. During the test, with the increase of load, the CPU utilization will also increase. Several new pods will appear, the CPU utilization will decrease, Kubernetes will close the Pod, and the same process will be repeated, which will lead to the jitter of Pod and the final decline of performance. Therefore, we need to adjust the scaleUp and scaleDown policies of the service, For example, set the stabilizationWindowSeconds stability window parameter to ensure smooth handling of traffic fluctuations.
Choreograph load tests using Kubernetes CronJob
The load test is conducted periodically for the production operation without human intervention, unless there is a performance problem, in which case our monitoring system will notify us. We use Kubernetes CronJob for choreography:
- Get access logs from Loki using LogCLI
- The access logs are piped to a tool that converts them to Ripley's JSON Lines input format
- Ripley replays the access logs for our production cluster
The corresponding resource list example file is as follows:
---
apiVersion: batch/v1beta1
kind: CronJob
metadata:
  name: owlbot
  namespace: perf-test
  labels:
    team: platform-infrastructure
spec:
  suspend: false
  schedule: "48 02 * * *"
  startingDeadlineSeconds: 1800
  jobTemplate:
    spec:
      # Make sure we only try once at a time
      backoffLimit: 0
      template:
        metadata:
          labels:
            team: platform-infrastructure
        spec:
          serviceAccountName: owlbot
          volumes:
            - name: requests
              emptyDir: {}
          initContainers:
            - name: loki-fetch
              image: # `logcli ` image
              command:
                - /bin/sh
                - -c
                - |
                  /logcli-linux-amd64 query \
                  --quiet \
                  --forward \
                  --limit=24000000 \
                  --batch=1000 \
                  --timezone=UTC \
                  --from="2021-11-14T11:00:00Z" \
                  --to="2021-11-14T16:30:00Z" \
                  --output=raw \
                  # Filter out any requests that do not need to be replayed here
                  '{job="frontend/nginx"} |= "\"request\":\""' > /load/nginx.jsonl && \
                  du -sh /load/*
              resources: { }
              volumeMounts:
                - mountPath: /load
                  name: requests
          tolerations:
            - key: workload
              operator: Equal
              value: perf-test
              effect: NoSchedule
          containers:
            - name: owlbot
              image: ... # image with `ripley` and tools to convert logs to `ripley`'s input model
              resources: {}
              command:
                - /bin/sh
                - -c
                - |
                  # /opt/your/ripley/convert/script /load/requests.jsonl > /load/requests.ripley.jsonl
                  seq 9999 | xargs -I {} cat /load/requests.ripley.jsonl | /opt/ripley/bin/ripley -pace "1m@1 5m@2 5m@3 5m@4 5m@5 5m@6 5m@7 5m@8 5m@9 5m@10"
              volumeMounts:
                - mountPath: /load
                  name: requests
          restartPolicy: Never
These results are recorded by Prometheus and can be accessed directly in it or in Grafana, as well as our normal application indicators, including OpenTelemetry tracking in Tempo.
Concluding remarks
Load testing is very valuable for understanding the ability of our system to handle different levels of traffic. Repeated testing in an isolated stagng environment can make the test results easier to understand and will not bring the risk of interrupting real-time applications. Testing for production systems is the most direct choice because it eliminates the need for cross environment adjustment. In the future, we will also explore how we can have enough confidence to run load test for production at any time, and introduce chaos engineering into our process.
Original link: https://medium.com/loveholidays-tech/load-testing-in-production-with-grafana-loki-kubernetes-and-golang-1699554d2aa3