1. Background
Log collection adopts ELK framework, i.e. elasticsearch, logstash, kibana, and filebeat component. Filebeat is used to scan log files and send logs to logstash service, while logstash service completes log segmentation and sends logs to elasticsearch service.
2. Deployment steps of filebeat (log - > logstash)
- Download the installation package and extract it.
- establish xxx.filebeat.yml File, pay attention to the content format, otherwise you will find half a day's error may not find the reason.
- Start service
[root@hadoop1 opt] tar -xf  filebeat-5.2.2-linux-x86_64.tar.gz  ./

# This is written according to the actual business needs filebeat.yml file
[root@hadoop1 filebeat-5.2.2-linux-x86_64] vim  swordfish.filebeat.yml
# The specific contents of the document are as follows:
filebeat.prospectors:
- input_type: log
multiline.timeout: 1s
paths:
- /opt/swordfish/target/swordfish-all-1.0-SNAPSHOT/logs/exec-server*.log
multiline:
pattern: '^\['
negate: true
match: after
# exclude_lines: ["^\\[DEBUG\\]"]
output.logstash:
hosts: ["192.168.14.148:9999"]Start command - background start
[root@hadoop1 filebeat-5.2.2-linux-x86_64]$ nohup ./filebeat -e -c udp-filebeat.yml -d publish &3. Deployment of logstash (logstash - > elastic search)
- Download the installation package and extract it.
- Create swordfish-pipeline.conf File, pay attention to the content format, otherwise you will find half a day's error may not find the reason.
- Start service
# decompression
[root@hadoop1 opt]# tar -xf logstash-5.2.2.tar.gz ./
[root@hadoop1 opt]# vim swordfish-pipeline.conf
# Pay attention to content format
input {
beats {
port => "9999"
}
}
filter {
grok {
match => { "message" => ["%{LOGLEVEL:logLevel}\]\[%{NUMBER:nanoTime:integer}\](?<V1>.*)\[jobId=(?<jobId>[\w\d\-_]+)\](?<V2>.*)", "%{LOGLEVEL:logLevel}\]\[%{NUMBER:nanoTime:integer}\](?<V1>.)(?<V2>.*)"] }
add_field => { "nest_msg" => "[%{logLevel}]%{V1}%{V2}" }
remove_field => [ "message", "V1", "V2" ]
}
if ![jobId] {
drop {}
}
mutate {
convert => { "nanoTime" => "integer" }
}
}
output {
stdout {
codec => json
}
elasticsearch {
hosts => ["192.168.14.148:9200"]
codec => json
index => "swordfish-logstash-%{+YYYY.MM.dd}"
}
}Start command - background start
[root@hadoop1 logstash-5.2.2]# nohup bin/logstash -f udp-pipeline.conf &We have introduced the deployment of 4es before. Let's go to the es head page to see if the logs are stored in es.
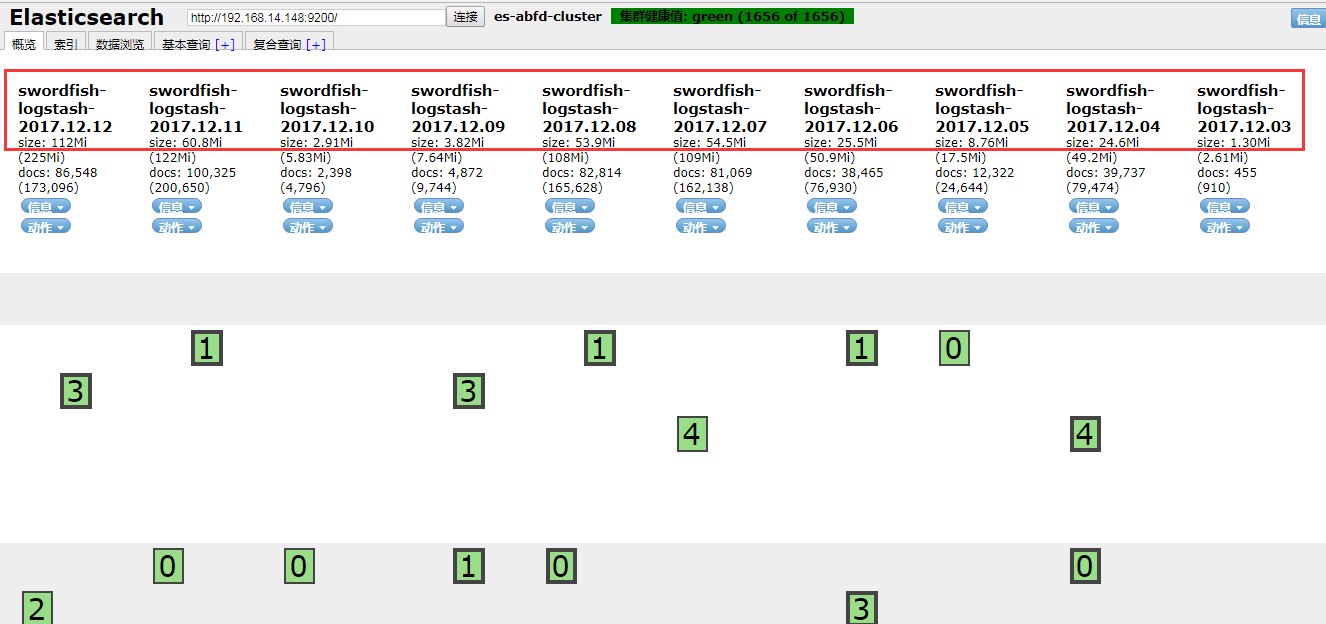
In the picture above, we found that logs can be collected.