Extracting data through the API is not one of the most common use cases for ELK Stack users, but this situation is very useful for some cases. For example, developers who use rest APIs to wrap their database services might be interested in analyzing this data for business intelligence purposes. In today's article, let's talk about how to use the ELK Stack to analyze a Service API.
For whatever reason, ELK Stack provides some simple ways to integrate with the API. One of these methods is Logstash HTTP poller Enter the plug-in. In the following example, I'll use this plug-in to get some weather data exposed through the public API.
To perform these steps and build your own pipeline for HTTP API analysis in ELK, you need to set up the following:
- Elastic: a guide for Rookies : install your Elasticsearch and Kibana
- How to install Logstash in Elastic stack : install your own Logstash
- In https://openweathermap.org/api Link to register an account. You can be there. https://openweathermap.org/guide Find the way to register at https://home.openweathermap.org/api_keys Find your own API keys.
Preparation data
As mentioned above, we use the OpenWeatherMap API to collect current weather data. The dataset includes statistics from 40000 weather stations on existing weather conditions around the world.
The data itself can be provided in JSON, XML or HTML format, but the default format is JSON, which is very suitable for our use case, because we are using elastic search to index data. There are many ways to call data - you can do so by providing the city name (the method we'll use here), City ID, geographic coordinates, or zip code. You can also call multiple cities in specific coordinates.
The following example invokes the weather statistics in a bounding box with longitude and latitude coordinates:
http://api.openweathermap.org/data/2.5/box/city?bbox=12,32,15,37,10&appid=YourAppKey
On top, bbox Defined as [lon left, lat bottom, lon right, lat top, zoom], that is, it represents a rectangular area. In the above appid, we must fill in our own App Key to work.
The data returned by API provides us with all the statistical information needed to measure the current weather conditions, including temperature, humidity, atmospheric pressure, wind speed and wind direction.
Here is an example:
{"cod":200,"calctime":0.00256473,"cnt":15,"list":[{"id":2563191,"dt":1581912559,"name":"Birkirkara","coord":{"Lon":14.46,"Lat":35.9},"main":{"temp":8,"feels_like":6.94,"temp_min":8,"temp_max":8,"pressure":1028,"humidity":93},"visibility":10000,"wind":{"speed":0.5},"rain":null,"snow":null,"clouds":{"today":1},"weather":[{"id":800,"main":"Clear","description":"clear sky","icon":"01n"}]},{"id":2210247,"dt":1581912558,"name":"Tripoli","coord":{"Lon":13.19,"Lat":32.88},"main":{"temp":14.62,"feels_like":12.78,"temp_min":14.62,"temp_max":14.62,"pressure":1027,"sea_level":1027,"grnd_level":1027,"humidity":59},"wind":{"speed":1.53,"deg":42},"rain":null,"snow":null,"clouds":{"today":12},"weather":[{"id":801,"main":"Clouds","description":"few clouds","icon":"02n"}]},{"id":2216885,"dt":1581912558,"name":"Zawiya","coord":{"Lon":12.73,"Lat":32.75},"main":{"temp":10.33,"feels_like":8.14,"temp_min":10.33,"temp_max":10.33,"pressure":1027,"sea_level":1027,"grnd_level":1015,"humidity":77},"wind":{"speed":1.96,"deg":87},"rain":null,"snow":null,"clouds":{"today":0},"weather":[{"id":800,"main":"Clear","description":"clear sky","icon":"01n"}]},{"id":2212771,"dt":1581912558,"name":"Sabratah","coord":{"Lon":12.49,"Lat":32.79},"main":{"temp":14.59,"feels_like":12.27,"temp_min":14.59,"temp_max":14.59,"pressure":1027,"sea_level":1027,"grnd_level":1027,"humidity":57},"wind":{"speed":2.05,"deg":57},"rain":null,"snow":null,"clouds":{"today":0},"weather":[{"id":800,"main":"Clear","description":"clear sky","icon":"01n"}]},{"id":2215163,"dt":1581912558,"name":"Masallatah","coord":{"Lon":14,"Lat":32.62},"main":{"temp":8.75,"feels_like":6.93,"temp_min":8.75,"temp_max":8.75,"pressure":1027,"sea_level":1027,"grnd_level":995,"humidity":77},"wind":{"speed":0.98,"deg":309},"rain":null,"snow":null,"clouds":{"today":0},"weather":[{"id":800,"main":"Clear","description":"clear sky","icon":"01n"}]},{"id":2219905,"dt":1581912558,"name":"Al Khums","coord":{"Lon":14.26,"Lat":32.65},"main":{"temp":12.93,"feels_like":11.96,"temp_min":12.93,"temp_max":12.93,"pressure":1027,"sea_level":1027,"grnd_level":1023,"humidity":71},"wind":{"speed":0.65,"deg":51},"rain":{"3h":0.19},"snow":null,"clouds":{"today":27},"weather":[{"id":500,"main":"Rain","description":"light rain","icon":"10n"}]},{"id":2208425,"dt":1581912558,"name":"Zuwarah","coord":{"Lon":12.08,"Lat":32.93},"main":{"temp":12.65,"feels_like":10.83,"temp_min":12.65,"temp_max":12.65,"pressure":1027,"sea_level":1027,"grnd_level":1027,"humidity":64},"wind":{"speed":1.3,"deg":63},"rain":null,"snow":null,"clouds":{"today":0},"weather":[{"id":800,"main":"Clear","description":"clear sky","icon":"01n"}]},{"id":2210221,"dt":1581912558,"name":"Tarhuna","coord":{"Lon":13.63,"Lat":32.44},"main":{"temp":7.58,"feels_like":6.11,"temp_min":7.58,"temp_max":7.58,"pressure":1027,"sea_level":1027,"grnd_level":992,"humidity":85},"wind":{"speed":0.56,"deg":142},"rain":null,"snow":null,"clouds":{"today":0},"weather":[{"id":800,"main":"Clear","description":"clear sky","icon":"01n"}]},{"id":2208485,"dt":1581912558,"name":"Zlitan","coord":{"Lon":14.57,"Lat":32.47},"main":{"temp":12.93,"feels_like":11.96,"temp_min":12.93,"temp_max":12.93,"pressure":1027,"sea_level":1027,"grnd_level":1023,"humidity":71},"wind":{"speed":0.65,"deg":51},"rain":{"3h":0.19},"snow":null,"clouds":{"today":27},"weather":[{"id":500,"main":"Rain","description":"light rain","icon":"10n"}]},{"id":2217362,"dt":1581912558,"name":"Gharyan","coord":{"Lon":13.02,"Lat":32.17},"main":{"temp":5.59,"feels_like":4.01,"temp_min":5.59,"temp_max":5.59,"pressure":1027,"sea_level":1027,"grnd_level":940,"humidity":90},"wind":{"speed":0.4,"deg":209},"rain":null,"snow":null,"clouds":{"today":0},"weather":[{"id":800,"main":"Clear","description":"clear sky","icon":"01n"}]},{"id":2523693,"dt":1581912495,"name":"Pozzallo","coord":{"Lon":14.85,"Lat":36.73},"main":{"temp":5.56,"feels_like":2.34,"temp_min":3.89,"temp_max":7.78,"pressure":1028,"humidity":87},"visibility":10000,"wind":{"speed":2.6,"deg":60},"rain":null,"snow":null,"clouds":{"today":0},"weather":[{"id":800,"main":"Clear","description":"clear sky","icon":"01n"}]},{"id":2524119,"dt":1581912495,"name":"Modica","coord":{"Lon":14.77,"Lat":36.85},"main":{"temp":5.73,"feels_like":2.54,"temp_min":3.89,"temp_max":7.78,"pressure":1028,"humidity":87},"visibility":10000,"wind":{"speed":2.6,"deg":60},"rain":null,"snow":null,"clouds":{"today":0},"weather":[{"id":800,"main":"Clear","description":"clear sky","icon":"01n"}]},{"id":2208791,"dt":1581912558,"name":"Yafran","coord":{"Lon":12.53,"Lat":32.06},"main":{"temp":7.01,"feels_like":5.31,"temp_min":7.01,"temp_max":7.01,"pressure":1027,"sea_level":1027,"grnd_level":959,"humidity":84},"wind":{"speed":0.68,"deg":209},"rain":null,"snow":null,"clouds":{"today":0},"weather":[{"id":800,"main":"Clear","description":"clear sky","icon":"01n"}]},{"id":2523581,"dt":1581912494,"name":"Rosolini","coord":{"Lon":14.95,"Lat":36.82},"main":{"temp":5.32,"feels_like":2.06,"temp_min":3.89,"temp_max":7.78,"pressure":1028,"humidity":87},"visibility":10000,"wind":{"speed":2.6,"deg":60},"rain":null,"snow":null,"clouds":{"today":0},"weather":[{"id":800,"main":"Clear","description":"clear sky","icon":"01n"}]},{"id":2523650,"dt":1581912495,"name":"Ragusa","coord":{"Lon":14.72,"Lat":36.93},"main":{"temp":5.52,"feels_like":2.29,"temp_min":3.89,"temp_max":7.78,"pressure":1028,"humidity":87},"visibility":10000,"wind":{"speed":2.6,"deg":60},"rain":null,"snow":null,"clouds":{"today":22},"weather":[{"id":801,"main":"Clouds","description":"few clouds","icon":"02n"}]}]}
Configure Logstash
The way to import the data returned through the API into the ELK stack is to use the Logstash http poller Input plug-in, which can aggregate, decode, and ship data from defined endpoint URL s. Let's first create a configuration file called logstash ou openweathermap.conf.
Logstash input
The input part defines the HTTP poller input plug-in - polling URL endpoint, request timeout, CRON based schedule (every 5 minutes) and codec to be used (JSON). The metadata? Target setting is optional and adds some fields to the response about poller performance.
input {
  http_poller {
    urls => {
      url => "http://api.openweathermap.org/data/2.5/weather?q=London,uk&APPID=7dbe7341764f682c2242e744c4f167b0&units=metric"
    }
    request_timeout => 60
    schedule => { every => "5m"}
    codec => "json"
    metadata_target => "http_poller_metadata"
  }
}
The API we want to insert here contains the following query parameters after calling the URL:
- q =London, uk - weather data to be returned to London
- APPID = – OpenWeatherMap API key
- units = metrics – convert unit format to Celsius
The url above shows microservices Interface . It returns:
{
  "coord": {
    "lon": -0.13,
    "lat": 51.51
  },
  "weather": [
    {
      "id": 802,
      "main": "Clouds",
      "description": "scattered clouds",
      "icon": "03n"
    }
  ],
  "base": "stations",
  "main": {
    "temp": 6.7,
    "feels_like": 0.46,
    "temp_min": 5,
    "temp_max": 8.33,
    "pressure": 1006,
    "humidity": 65
  },
  "visibility": 10000,
  "wind": {
    "speed": 6.2,
    "deg": 230
  },
  "clouds": {
    "all": 40
  },
  "dt": 1581916140,
  "sys": {
    "type": 1,
    "id": 1414,
    "country": "GB",
    "sunrise": 1581923520,
    "sunset": 1581959845
  },
  "timezone": 0,
  "id": 2643743,
  "name": "London",
  "cod": 200
}
You can use https://jsonformatter.org/json-viewer To format the results returned by the API.
Logstash filter
Because API responses use JSON, Logstash requires little processing or parsing. Therefore, we can now leave the filter section empty.
filter {}Logstash output
The following part is very direct:
output {
   	elasticsearch {
     	index => "openweather"
     	document_type => "_doc"
     	hosts => "localhost:9200"
	}
 }
Above, we import the data into the elastic search of localhost:9200, and the index name is openweather.
Based on the above configuration, our final longstash_openweather.conf is as follows:
input {
  http_poller {
    urls => {
      url => "http://api.openweathermap.org/data/2.5/weather?q=London,uk&APPID=7dbe7341764f682c2242e744c4f167b0&units=metric"
    }
    request_timeout => 60
    schedule => { every => "1m"}
    codec => "json"
    metadata_target => "http_poller_metadata"
  }
}

filter {}

output {
  stdout {
    codec => rubydebug
    }

  elasticsearch {
     	index => "openweather"
     	document_type => "_doc"
     	hosts => "localhost:9200"
  }
}
Start logstash. We run logstash in the installation directory of logstash:
./bin/logstash -f ~/data/logstash_openweather.conf
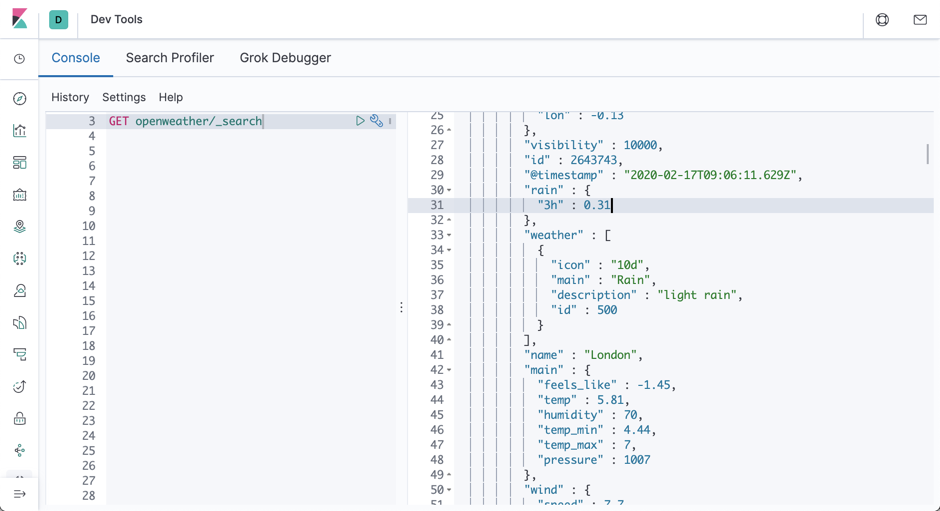
You will see a new Elasticsearch index created with weather data. Define a new index pattern in Kibana to start the analysis:

Analysis data
We can create an index pattern called openweather. You can then view it through Discover:

With openweather index pattern, we can create our dashboard:


