I remember in the previous article“ Logstash: API analysis using ELK stack ”Use Logstash to analyze the API of some indicators. In today's exercise, I will show how to use Logstash to analyze the service APIs of some log classes. We know that in many cases, we can quickly use some scripts to analyze the data of some service APIs. This is helpful for us to quickly analyze some data. In data import, we can use the rich filter provided by Logstash to clean, enrich and transform data.
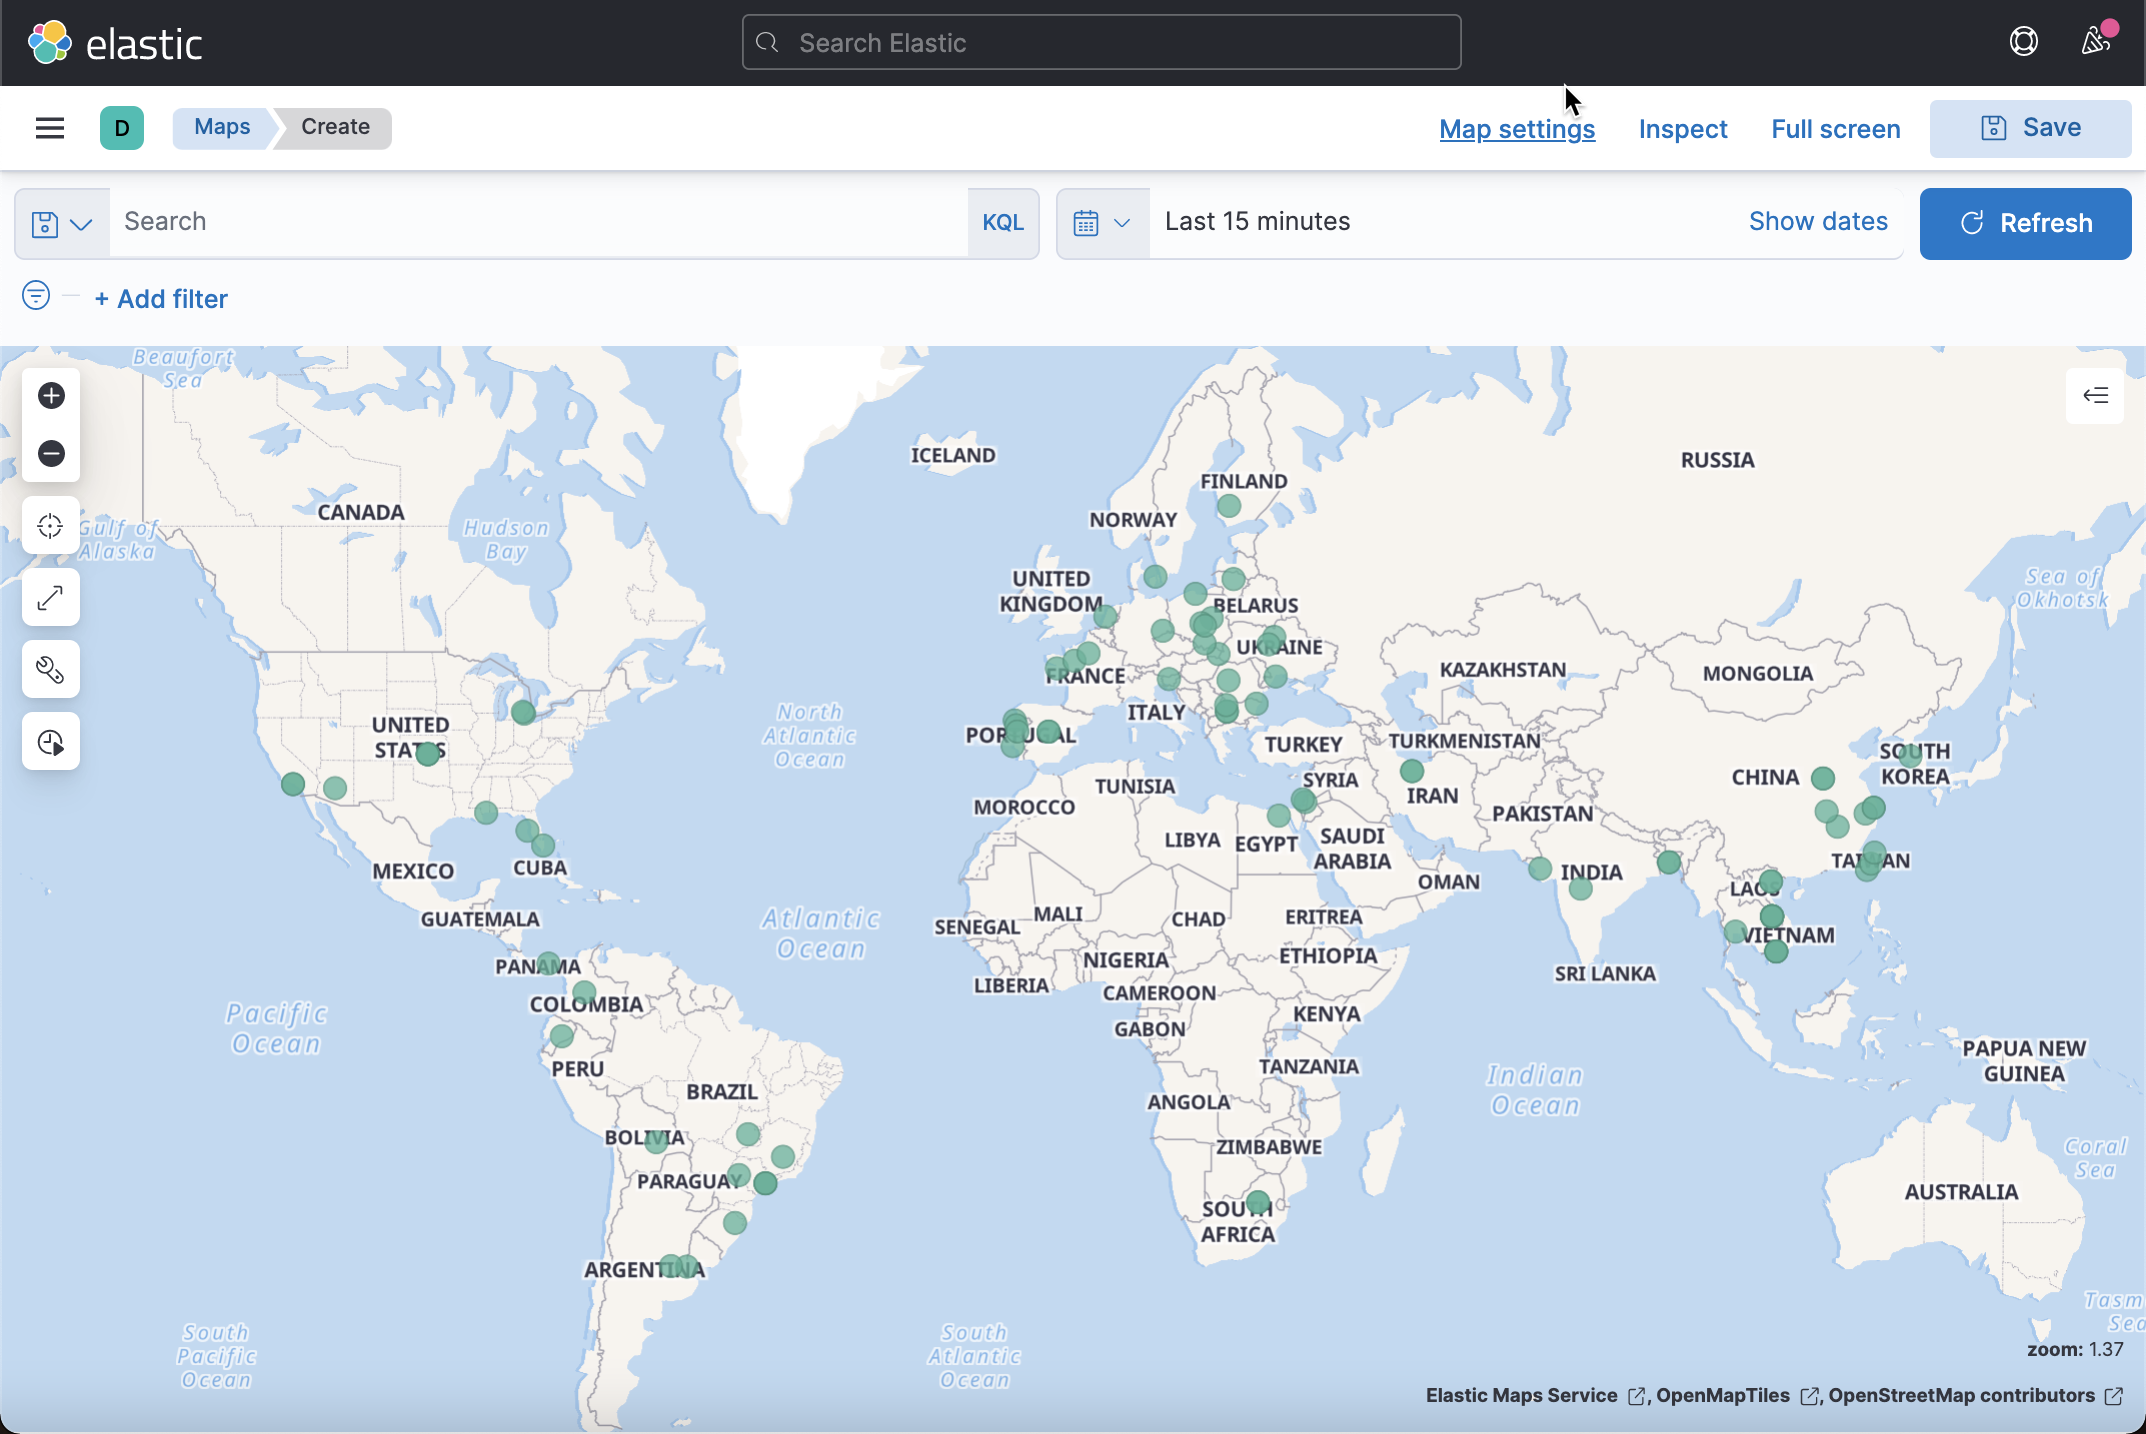
In today's exercise, I will use shodan.io Take the website as an example:
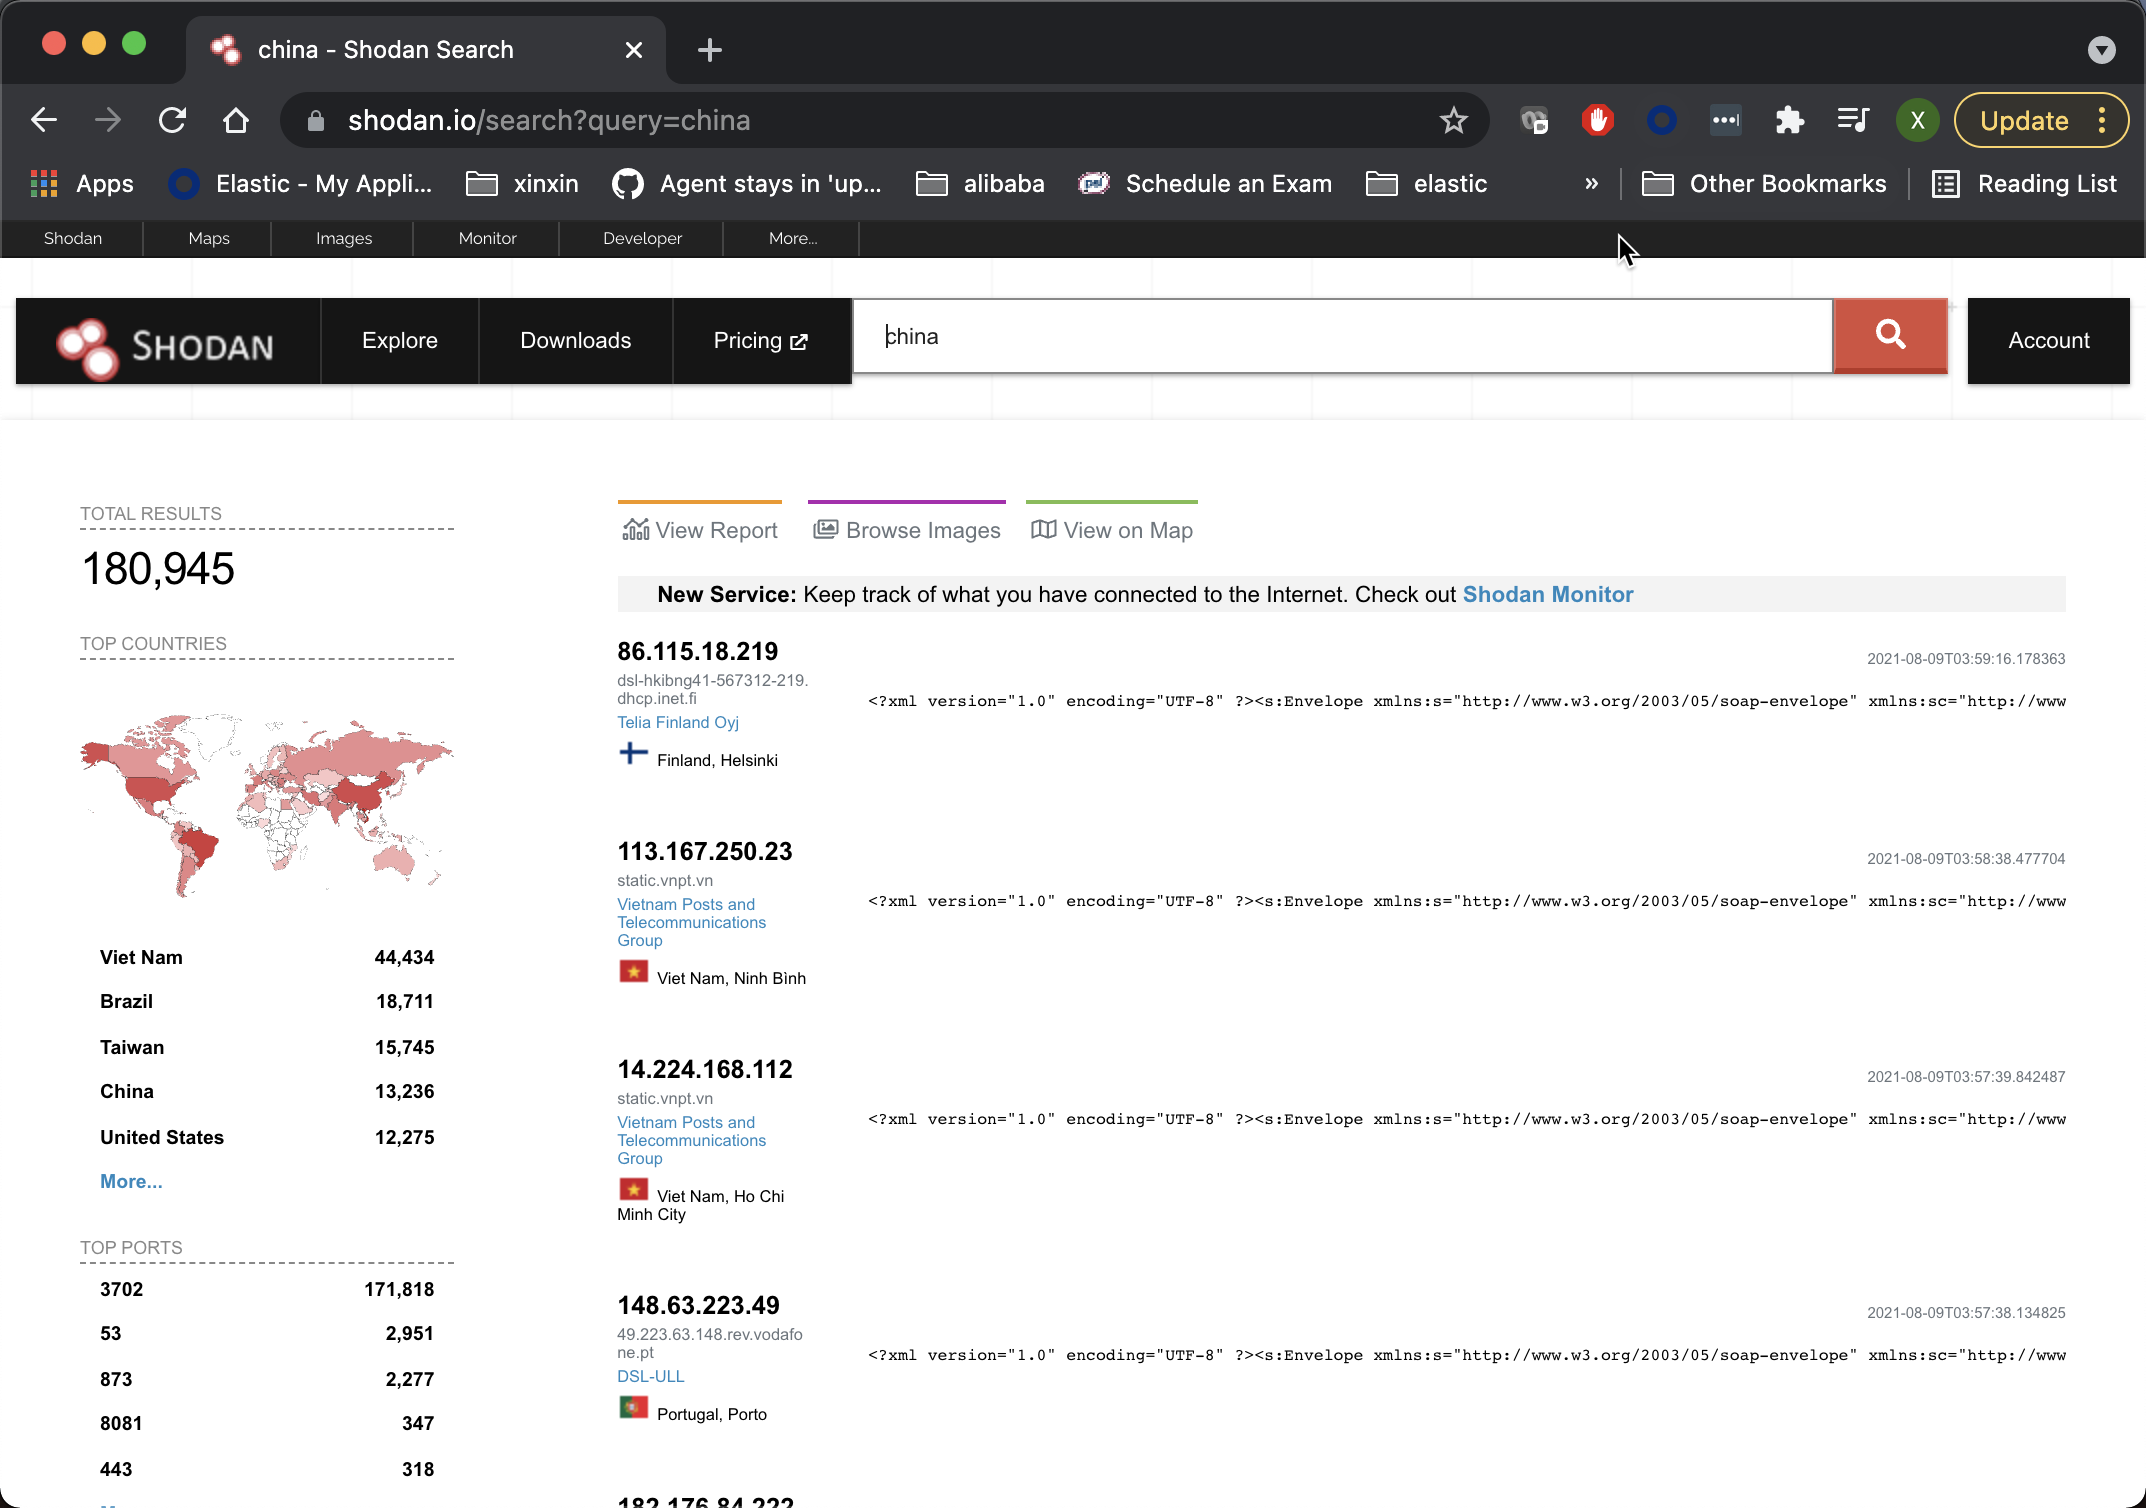
Shodan is an interconnected search engine. In the above, when we search for the word china, it will display those hosts with the word. I won't introduce more about Shodan here. Shodan actually provides a Service API interface for our clients to call. We can address To apply for a developer account and get the developer secret key.
Below, I use a Python application to obtain the query results:
shodan_scanner.py
import os
from shodan import Shodan
import time
import requests
import pprint
import sys
import logging

logging.basicConfig(level=logging.INFO,
                    filename='shodan.log',
                    format='{%(message)s}')

# api_key = os.environ[SHODAN_API_KEY]
api_key = "YOUR DEVELOPER KEY"
api = Shodan(api_key)

search = sys.argv[1]

# Search Shodan
results = api.search(search)

# print(f"Total count: {len(results['matches'])}")

# Show the results
for result in results['matches']:
    ip_address = result['ip_str']
    domains = result['domains']
    logging.info('"ip_addr":"{}","domains":"{}"'.format(ip_address, domains))
    time.sleep(1)
In order to run the above application, we must install shodan:
pip3 install shodan
We can run it in the following ways:
python3 shodan_scanner.py "china" > shodan.log
Above, we search for the word "china" and save the search results to Shodan Log in. After we finish running, we can go to Shodan The following logs can be found in the log file:
shodan.log
{"ip_addr":"46.171.98.231","domains":"['tpnet.pl']"}
{"ip_addr":"50.212.192.99","domains":"[]"}
{"ip_addr":"189.68.169.82","domains":"['telesp.net.br']"}
{"ip_addr":"157.25.97.179","domains":"[]"}
{"ip_addr":"116.106.51.100","domains":"['viettel.vn']"}
{"ip_addr":"147.161.68.134","domains":"['adamo.es']"}
{"ip_addr":"37.252.122.48","domains":"['tilaa.com']"}
{"ip_addr":"134.73.16.32","domains":"['smbccojp14.com']"}
{"ip_addr":"177.182.214.4","domains":"['virtua.com.br']"}
{"ip_addr":"115.72.1.76","domains":"['viettel.vn']"}
{"ip_addr":"118.70.44.0","domains":"[]"}
{"ip_addr":"113.165.201.60","domains":"['vnpt.vn']"}
{"ip_addr":"45.201.208.251","domains":"[]"}
{"ip_addr":"42.119.67.22","domains":"[]"}
{"ip_addr":"14.166.150.83","domains":"['vnpt.vn']"}
{"ip_addr":"181.46.231.207","domains":"['telecentro-reversos.com.ar']"}
{"ip_addr":"109.50.128.189","domains":"['netcabo.pt']"}
{"ip_addr":"81.193.147.140","domains":"['telepac.pt']"}
{"ip_addr":"41.38.136.142","domains":"['tedata.net']"}
{"ip_addr":"85.187.243.54","domains":"['villagenet-bg.com']"}
{"ip_addr":"103.217.236.75","domains":"[]"}
{"ip_addr":"115.79.68.162","domains":"['viettel.vn']"}
From above, we can see that it has an IP address_ An IP address such as addr. We can use the information provided by Logstash geoip Filter to enrich this data.
logstash.conf
input {
  file {
    path => [ "/Users/liuxg/python/shodan/shodan.log" ]
    start_position => "beginning"
    sincedb_path => "/dev/null"
    codec   => "json"
  }
}

filter {
    geoip {
        source => "ip_addr"
        target => "geo"
    }

    if [geo][latitude] and [geo][logitude] {
        mutate {
            add_field => {
                "location" => ["%{[geo][latitude]},%{[geo][logitude]}"]
            }
        }
        mutate {
            convert => {
                "location" => "float"
            }
        }
    }
}


output {
  stdout {
    codec => rubydebug
  }

  elasticsearch {
      hosts => ["http://localhost:9200"]
      index => "shodan"
  }
}
Above, we import the data through file input. When using, you need to use your own file path instead of the above path. In the above, I used the geoip filter to enrich the data.
Before running the above Logstash pipeline, we enter the following command in Kibana:
PUT shodan
{
  "mappings": {
    "properties": {
      "geo": {
        "properties": {
          "location": {
            "type": "geo_point"
          }
        }
      }
    }
  }
}
The above command defines Geo Data type of location. It's a Geo_ Data type of point.
We can run Logstash with the following command:
sudo ./bin/logstash -f logstash.conf
We can see the following output in the terminal of Logstash:
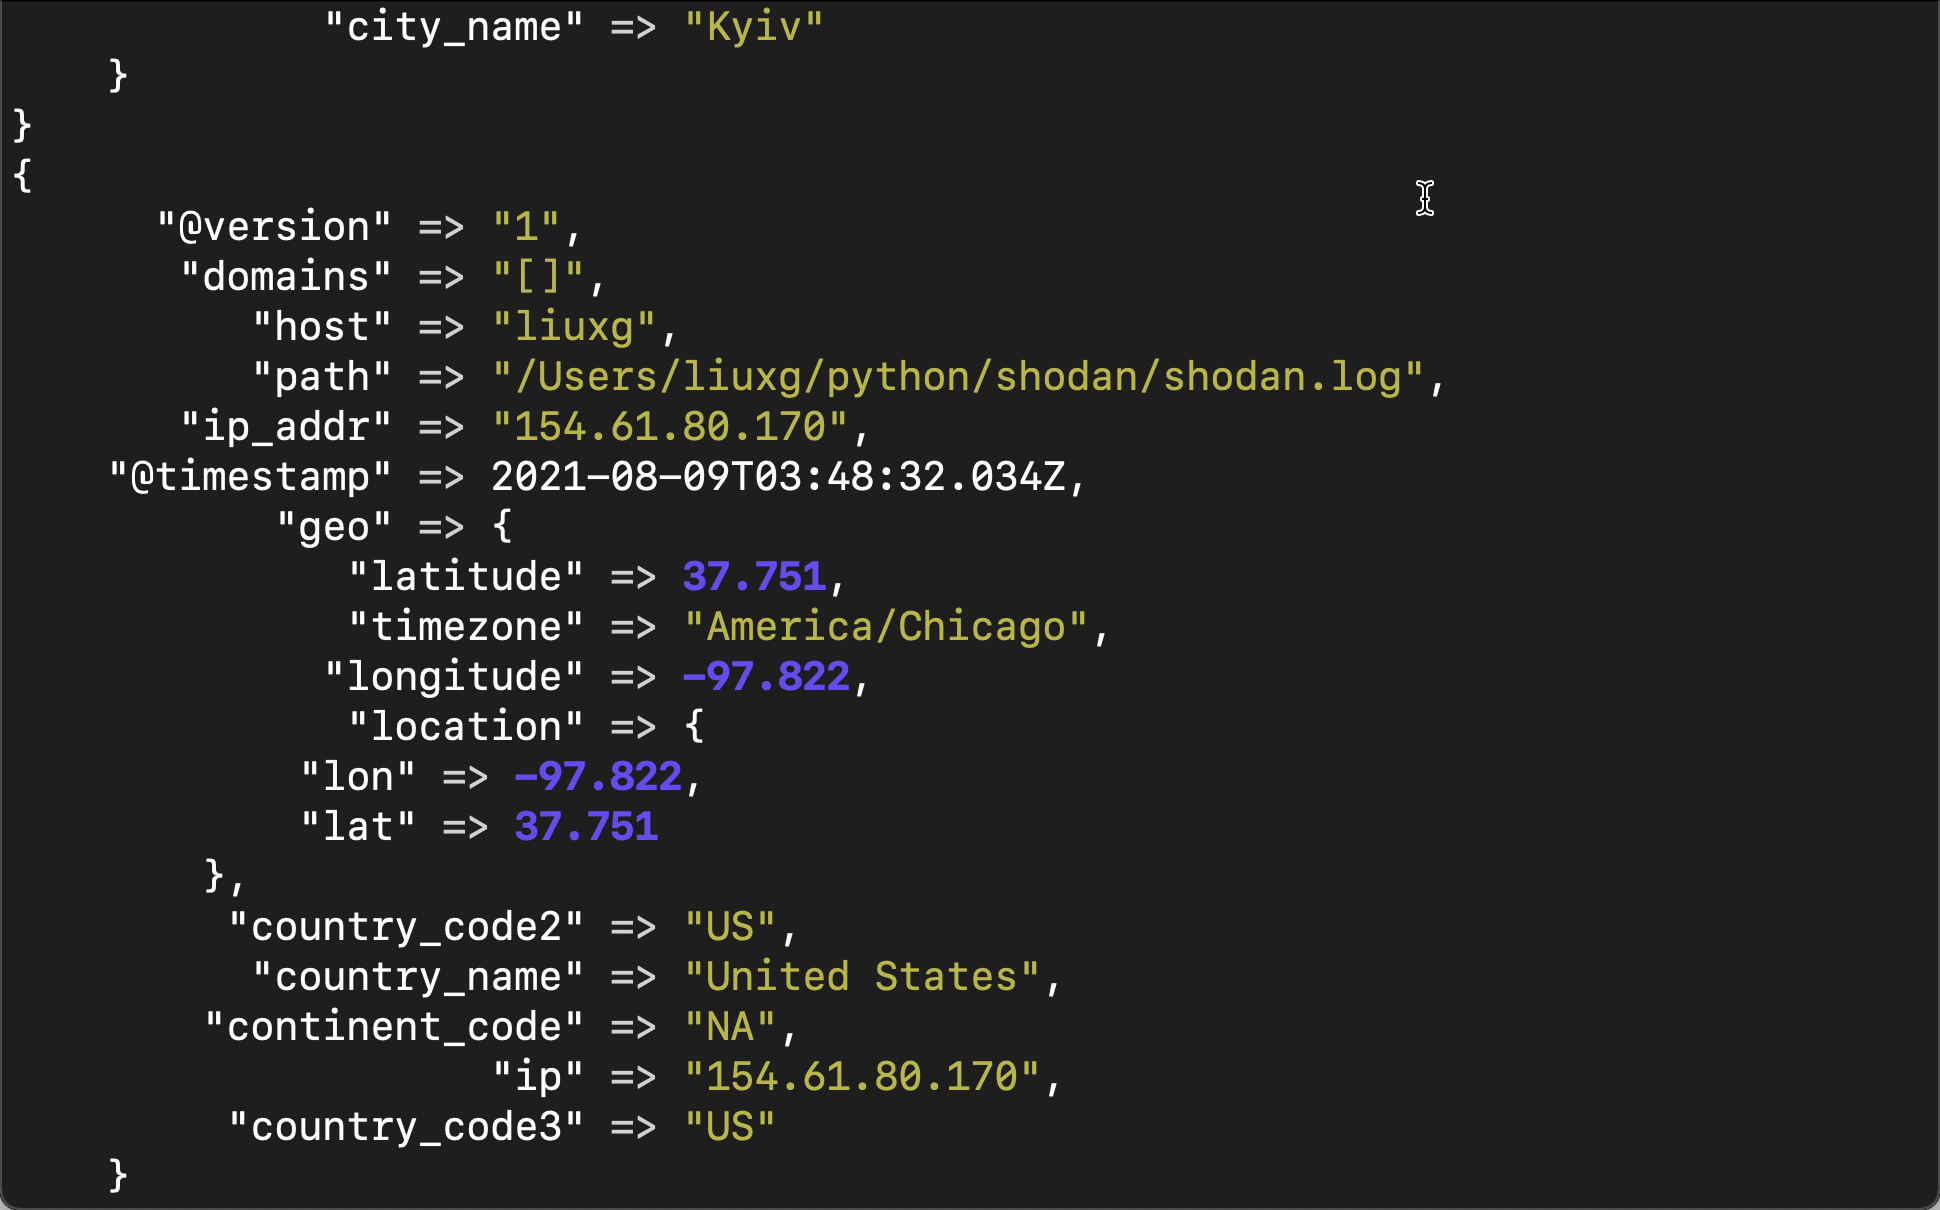
From the above, we can see that through the use of geoip, we get more fields about location.
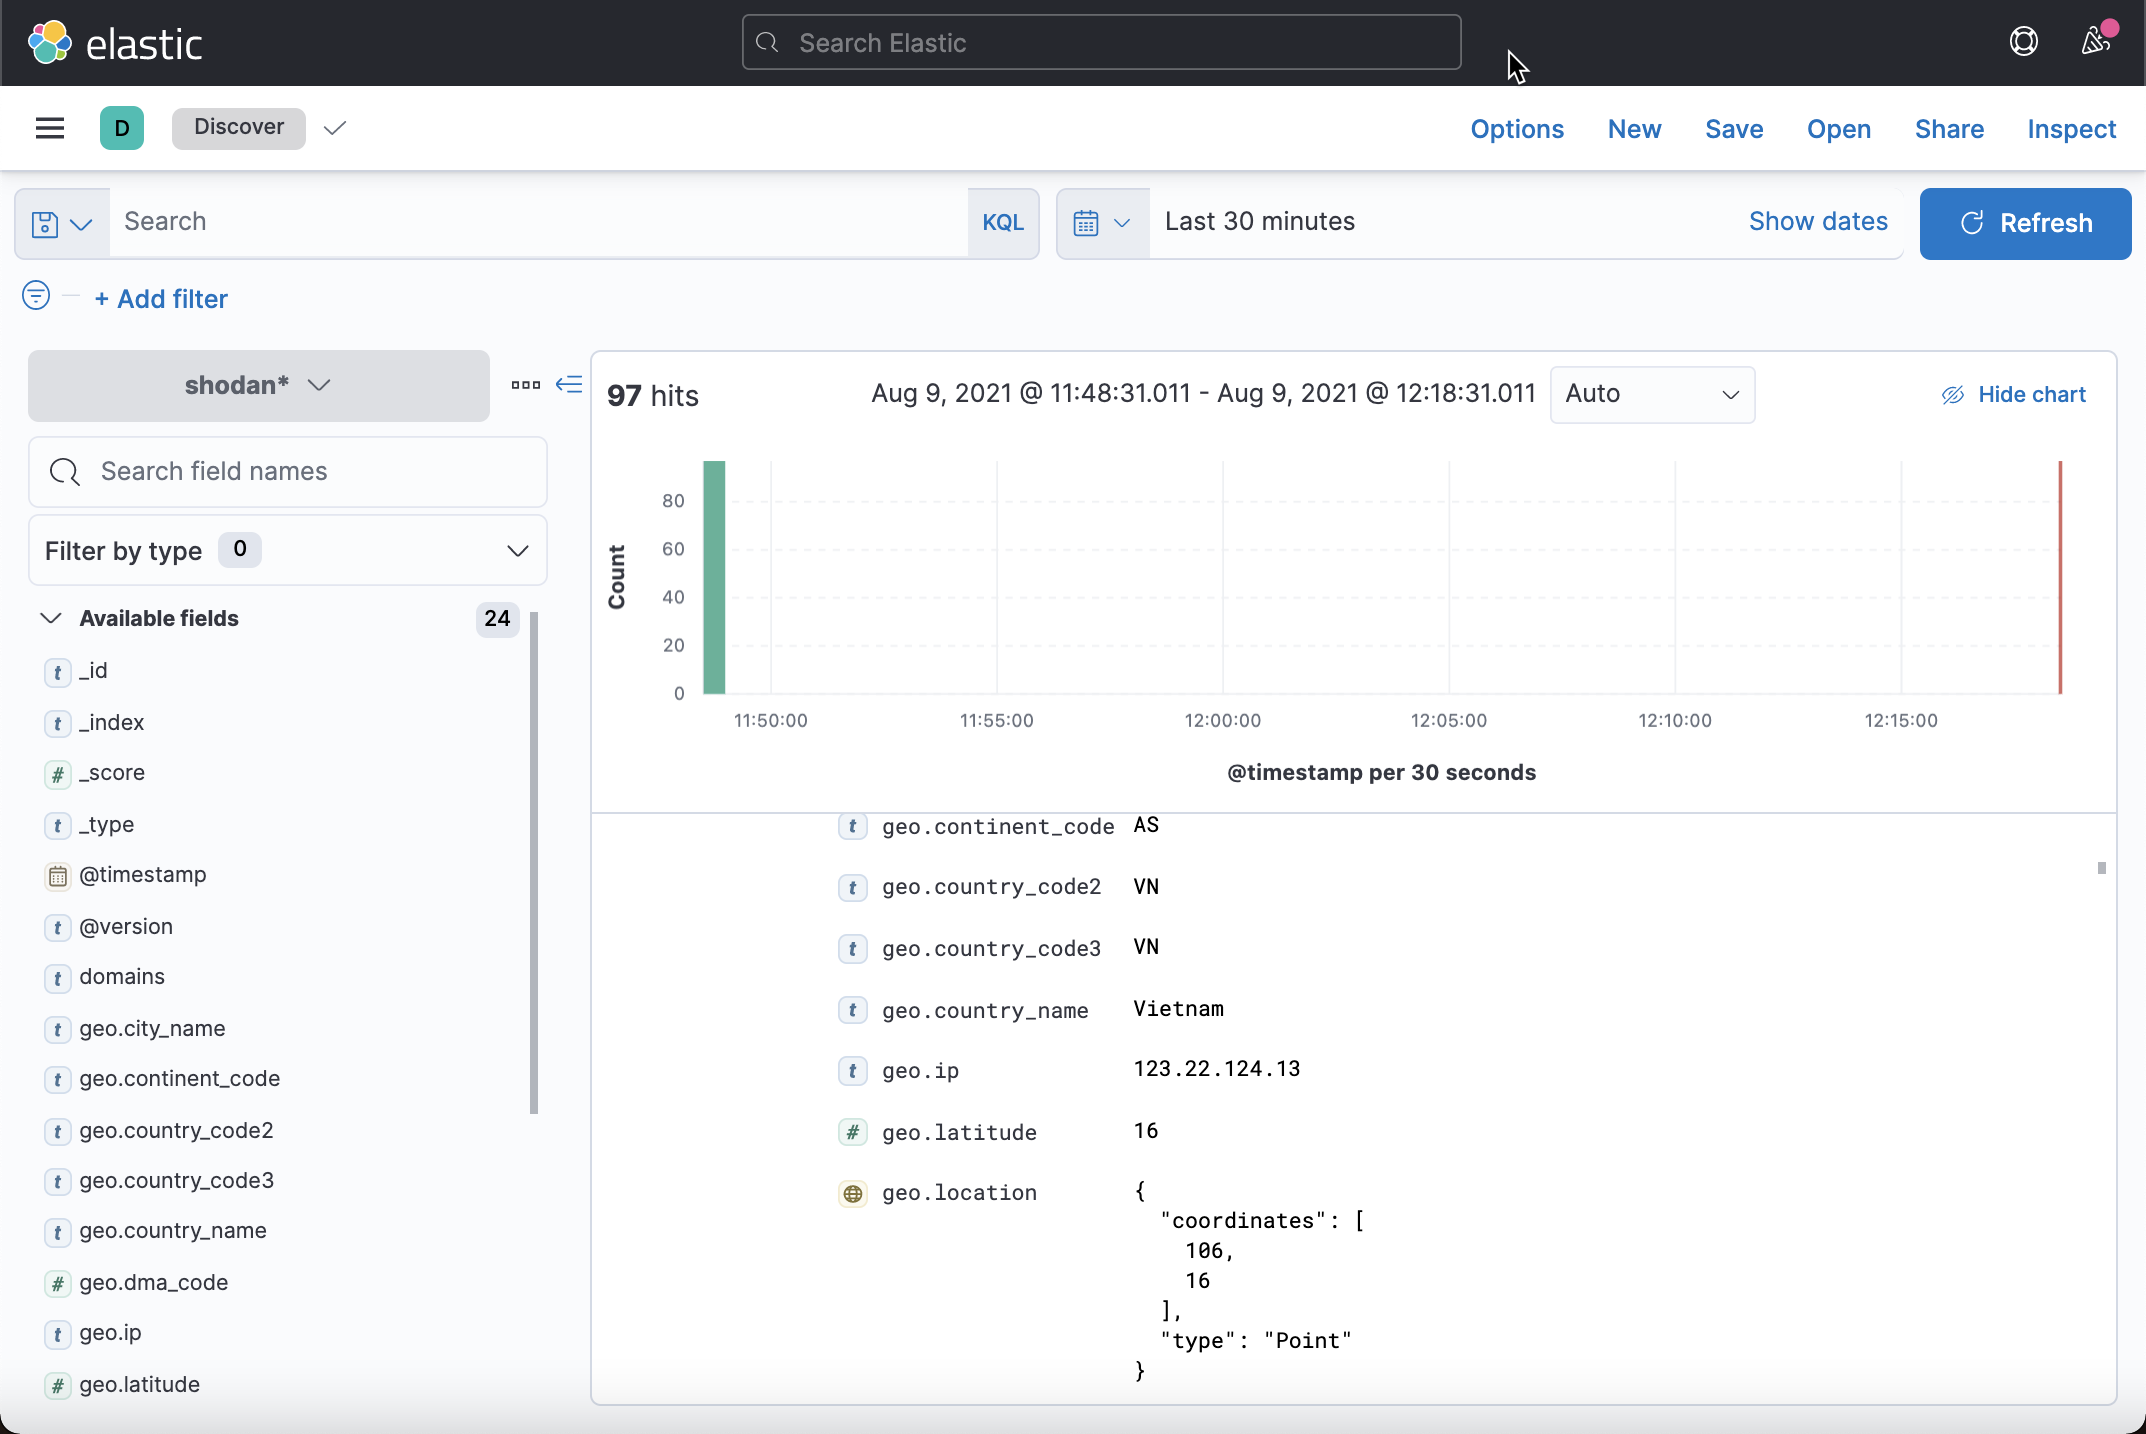
We need to create an index schema for the shaodan index. We can find these data in Discover:
Because it also has a location field, we can also use the Maps application to display the location of the document: