preface
As a load balancer, haproxy can effectively share the access load of applications and help applications avoid single point risk to a certain extent. Sometimes, there is a need to analyze data from haproxy logs.
In a current environment, haproxy is used as the load balancer of the back-end query interface to capture the key information in the http request in the haproxy log. Combined with Loki for log collection, it provides a way of visual analysis.
text
haproxy format log
By default, the logging of haproxy is very simple. It only records where requests are sent, like the following:
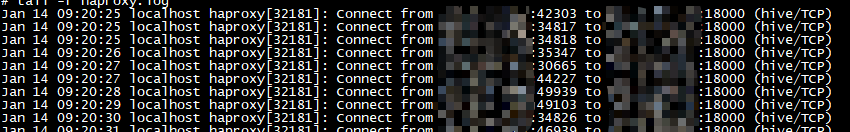
It can be said that such a log is useless, so it needs to be modified a little (•) ̀ω•́ ) ✧
# Add the following configuration items to the corresponding listen
        log global
        option http-buffer-request
        declare capture request len 40000
        http-request capture req.body id 0
        capture request header Host len 6400
        capture request header User-Agent len 5120
        capture request header X-Forwarded-For len 1000
        capture request header Referer len 2000
        capture response header Server len 400
        capture response header Server-ID len 400
        # The log format part is the actual formatted log output part
        log-format "frontend:%f client:%ci:%cp method:%HM code:%ST url:%HP body:%[capture.req.hdr(0)] destination:%si:%sp"
As for how to open the log record of haproxy, there are a lot of methods on Baidu. If it doesn't work, just google. I won't repeat it here;
After configuration, restart haproxy. Of course, if it is above version 1.7, the official says it supports hot update configuration, and the log printing format will be similar to this:
Jan 13 14:03:47 10.10.10.10 haproxy[40946]: frontend:druid-pools client:10.10.10.12:12345 method:POST code:200 url:/api/v1/query body:{"queryType":"sql","query":"SELECT * FROM TABELNAME","resultFormat":"array","header":true} destination:10.10.10.11:1234
Loki configuring log collection
For the above log format, we need to configure Loki to collect it. Because the log volume is not very large, we do not need to deploy Loki in the form of micro service. Integrated deployment is OK. At the same time, we also need to deploy prommail collector to collect logs. The official documents indicate that many collectors are supported, and prommail is supporting, In addition, it is also possible to use logstash. For details, please refer to the official documents.
loki can be configured using the following:
auth_enabled: false

server:
  http_listen_port: 3100
  grpc_listen_port: 9096

common:
  # Path to data directory
  path_prefix: /data2/loki
  storage:
    filesystem:
      # Generally, ${path_prefix} / chunks is used directly in this part
      chunks_directory: /data2/loki/chuncks
      # Generally, ${path_prefix}/rules is used directly in this part
      rules_directory: /data2/loki/rules
  # Set the number of copies to 1 when testing or when the log itself does not have high data security requirements
  replication_factor: 1
  ring:
    instance_addr: 127.0.0.1
    kvstore:
      store: inmemory
schema_config:
  # Just keep the default configuration
  configs:
    - from: 2022-01-01
      store: boltdb-shipper
      object_store: filesystem
      schema: v11
      index:
        prefix: index_
        period: 24h
limits_config:
  # This part of the configuration is to increase the limit of log collection. The default limit is very small and it is easy to trigger an error
  # It should be noted that the error report itself will only lose the log and will not lead to the downtime of the collector or loki
  enforce_metric_name: false
  reject_old_samples: true
  reject_old_samples_max_age: 168h
  ingestion_rate_mb: 40
  ingestion_burst_size_mb: 20
ruler:
  alertmanager_url: http://localhost:9093
Next is the prommail component, which is used to listen to haproxy Log:
server:
  http_listen_port: 9080
  grpc_listen_port: 0
positions:
  # This file is the file that prommail records log offset. It will be updated every time it is collected
  # Even if the service is down, the next restart will start from the log offset recorded in this file
  filename: /tmp/positions.yaml
clients: # Note that the log is sent to Loki here
  - url: http://localhost:3100/loki/api/v1/push
scrape_configs:
# The following configuration section is very similar to Prometheus
  - job_name: system
    static_configs:
    - targets:
        - XXXXXX
      labels:
        # Static tags represent that all logs under this job contain at least these two tags
        job: haproxy
        # Level. Because the haproxy log itself does not contain the log level, loki cannot be parsed
        # If the normal log contains the mark of standard log registration, this label does not need to be set
        level: info
        __path__: /var/log/haproxy/*.log
    pipeline_stages:
    - match:
        # This part deals with the logs, and the selector is used to filter the log streams that meet the conditions
        selector: '{job="haproxy"}'
        stages:
        - regex:
            # Regular expression in RE2 format,? P < XXX > means to set the matching part as a variable
            expression: '(?P<time>[^ ]* +[^ ]* +[^ ]*) (?P<syslog_host>[\w-\.]+) (?P<ps>\w+)\[(?P<pid>\d+)\]:(?P<output>.*)'
        # In this step, I want to filter out the time records of my own log and other things I don't want, and output them with the output variable
        - output:
            source: output
    - match:
        # Although I still use the same condition selector here, the log flow has been processed once
        # So the unwanted information no longer exists
        selector: '{job="haproxy"}'
        stages:
        - regex:
            expression: 'frontend:(?P<frontend>\S+) haproxy:(?P<haproxy>\S+) client:(?P<client>\S+) method:(?P<method>\S+) code:(?P<code>\S+) url:(?P<url>\S+) destination:(?P<destination>\S+)}?$'
        - labels:
            # Dynamic label generation
            frontend:
            method:
            code:
            destination:
Then we can start prommail and loki successively. Note that the first startup will scan all matching complete logs because there is no recorded log offset. The impact is that a large number of 429 errors will be found. server returned HTTP status 429 Too Many Requests (429). My processing method is after the first collection is completed, Wait for prommail to scan until no error is reported, then stop the loki service, empty the loki data, and restart the service. The purpose of this is to enable prommail to obtain the latest log offset, and loki can also reset the recording time.
If a big man can have a better way, please leave a message to me
Now that the log has been collected, we can wait a while, configure it in Grafana and query it through explore:
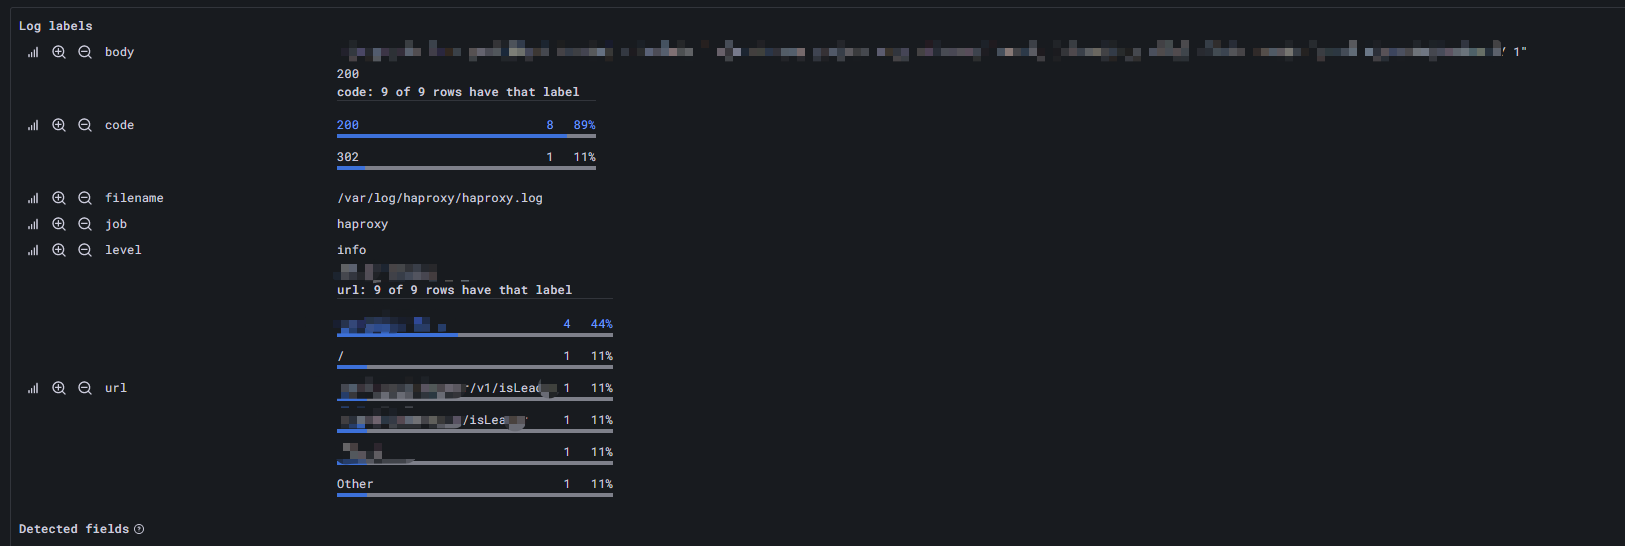
The goal is achieved. As for what kind of data value you want to explore, it depends on the user (o ▽ o ☆ [BINGO!]
epilogue
As a new log collection tool, Loki may not be able to completely replace ELK, but it is very friendly from the use experience, and I don't like too heavy systems. ELK is a typical heavy-duty system, and its learning cost and deployment cost are not low, so I look forward to Loki's future development.