clustering algorithm
A typical unsupervised learning algorithm, which is mainly used to automatically classify similar samples into one category.
In the clustering algorithm, samples are divided into different categories according to the similarity between samples. Different clustering results will be obtained for different similarity calculation methods.
The biggest difference between clustering algorithm and classification algorithm is that clustering algorithm is unsupervised learning algorithm, while classification algorithm belongs to supervised learning algorithm.
k-means actually contains two layers:
- K: number of initial center points (number of planned clusters)
- means: average the distance from the center point to other data points
- k-means clustering steps
1. Randomly set K points in the feature space as the initial clustering center
2. For each other point, calculate the distance to K centers. For unknown points, select the nearest cluster center as the marker category
3. Then, after facing the marked cluster center, recalculate the new center point (average value) of each cluster
4. If the calculated new center point is the same as the original center point (the center of mass no longer moves), then it is over, otherwise repeat the second step of the process
kmean algorithm in sklearn
Import package
from sklearn.cluster import KMeans,
import pandas as pd
import numpy as np
import matplotlib.pyplot as plt
Load data
data = pd.read_csv("kmeans.txt", delimiter=" ",header=None)
data
0 1 2 3
0 1.658985 4.285136 NaN NaN
1 -3.453687 3.424321 NaN NaN
2 4.838138 -1.151539 NaN NaN
... ... ... ... ...
79 -4.905566 -2.911070 NaN NaN
80 rows × 4 columns
The data is in txt format. The third and fourth columns have nan values. Because they are spaces, make a conversion to delete the last two columns
data = data.iloc[:,:2]
data
	0				1
0	1.658985	4.285136
1	-3.453687	3.424321
		..	...	...
79	-4.905566	-2.911070
80 rows × 2 columns
# Set k value
k = 4
estimator = KMeans(n_clusters=k)
# estimator = MiniBatchKMeans(n_clusters=k)
estimator.fit(data)
centers = estimator.cluster_centers_
centers
array([[ 2.6265299 , 3.10868015],
[-3.38237045, -2.9473363 ],
[-2.46154315, 2.78737555],
[ 2.80293085, -2.7315146 ]])
4 categories center point of each category
result = estimator.predict(data)
result
Prediction results
array([0, 2, 3, 1, 0, 2, 3, 1, 0, 2, 3, 1, 0, 2, 3, 1, 0, 2, 3, 1, 0, 2,
3, 1, 0, 2, 3, 1, 0, 2, 3, 1, 0, 2, 3, 1, 0, 2, 3, 1, 0, 2, 3, 1,
0, 2, 3, 1, 0, 2, 3, 1, 0, 2, 3, 1, 0, 2, 3, 1, 0, 2, 3, 1, 0, 2,
3, 1, 0, 2, 3, 1, 0, 2, 3, 1, 0, 2, 3, 1])
estimator.labels_
array([0, 2, 3, 1, 0, 2, 3, 1, 0, 2, 3, 1, 0, 2, 3, 1, 0, 2, 3, 1, 0, 2,
3, 1, 0, 2, 3, 1, 0, 2, 3, 1, 0, 2, 3, 1, 0, 2, 3, 1, 0, 2, 3, 1,
0, 2, 3, 1, 0, 2, 3, 1, 0, 2, 3, 1, 0, 2, 3, 1, 0, 2, 3, 1, 0, 2,
3, 1, 0, 2, 3, 1, 0, 2, 3, 1, 0, 2, 3, 1])
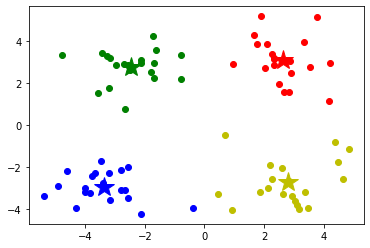
#Draw each data point and use different colors to represent the classification
mark = ['or', 'ob', 'og', 'oy']
for i in range(len(data)):
    plt.plot(data.iloc[i,0],data.iloc[i,1], mark[result[i]])

# # Draw the center point of each category
mark = ['*r', '*b', '*g', '*y']
for i,center in enumerate(centers):
    plt.plot(center[0],center[1], mark[i], markersize=20)
plt.show()
# Gets the range of data values
x_min, x_max = data.iloc[:, 0].min() - 1, data.iloc[:, 0].max() + 1
y_min, y_max = data.iloc[:, 1].min() - 1, data.iloc[:, 1].max() + 1

# Generate grid matrix
xx, yy = np.meshgrid(np.arange(x_min, x_max, 0.02),
                     np.arange(y_min, y_max, 0.02))

z = estimator.predict(np.c_[xx.ravel(), yy.ravel()])# Travel is similar to flatten in that multidimensional data is converted to one dimension. Flatten will not change the original data, and travel will change the original data
z = z.reshape(xx.shape)
# Contour map
cs = plt.contourf(xx, yy, z)
# Display results
# Draw each data point and use different colors to represent the classification
mark = ['or', 'ob', 'og', 'oy']
for i in range(len(data)):
    plt.plot(data.iloc[i,0],data.iloc[i,1], mark[result[i]])

# Draw the center point of each category
mark = ['*r', '*b', '*g', '*y']
for i,center in enumerate(centers):
    plt.plot(center[0],center[1], mark[i], markersize=20)

plt.show()

When the amount of data becomes large, we can use the minibatch kmeans (n_clusters = k) algorithm.
Mini Batch K-Means algorithm is a variant of K-Means algorithm, which uses a small batch of data subsets to reduce the calculation time. The so-called small batch here refers to the data subsets randomly selected during each training algorithm. Using these randomly generated subsets to train the algorithm greatly reduces the calculation time, and the result is generally only slightly worse than the standard algorithm.
The iterative algorithm has two steps:
1: Randomly select some data from the data set to form a small batch, and assign them to the nearest centroid
2: Update centroid
Compared with the K-means algorithm, the data is updated on each small sample set.
Mini Batch K-Means has faster convergence speed than K-Means, but at the same time
It also reduces the effect of clustering, but it is not obvious in the actual project.
Summary of clustering algorithm
k-means algorithm is relatively simple, but it also has several major shortcomings
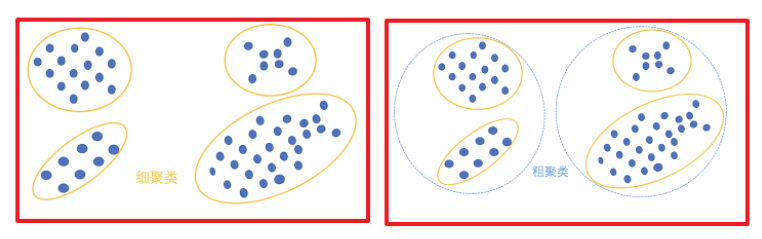
(1) The selection of K value is specified by the user. Different K results will be quite different, as shown in the figure below. On the left is the result of k=3, which is too sparse. In fact, the blue cluster can be divided into two clusters. The figure on the right shows the result of k=5. It can be seen that the two clusters of red diamond and blue diamond can be combined into one cluster:
(2) It is sensitive to the selection of k initial centroids and is easy to fall into local minimum. For example, when the above algorithm is running, we may get different results, such as the following two cases. K-means also converges, but converges to the local minimum:
(3) There are limitations, such as the following non spherical data distribution:
(4) When the database is large, the convergence will be slow.