What is numpy
A basic library for scientific calculation in Python, which focuses on numerical calculation. It is also the basic library of most Python scientific calculation libraries. It is mostly used to perform numerical operations on large and multi-dimensional arrays
Axis
In numpy, it can be understood as direction, which is expressed by 0,1,2... Numbers. For a one-dimensional array, there is only one 0 axis, for a two-dimensional array (shape(2,2)), there are 0 axis and 1 axis, and for a three-dimensional array (shape (2,2,3)), there are 0,1,2 axes
With the concept of axis, our calculation will be more convenient. For example, to calculate the average value of a two-dimensional group, we must specify which direction to calculate the average value of the numbers above
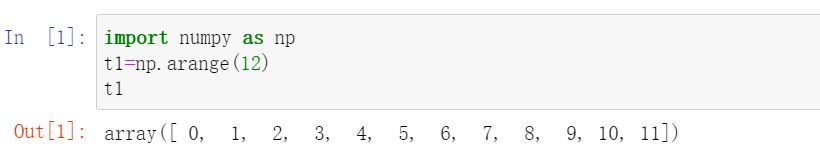
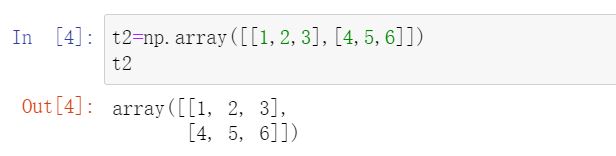
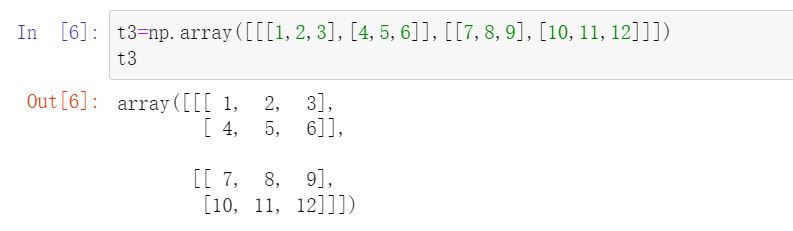
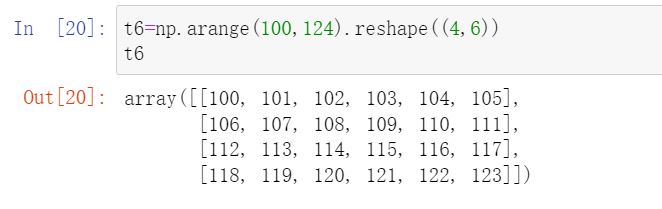
Create array:
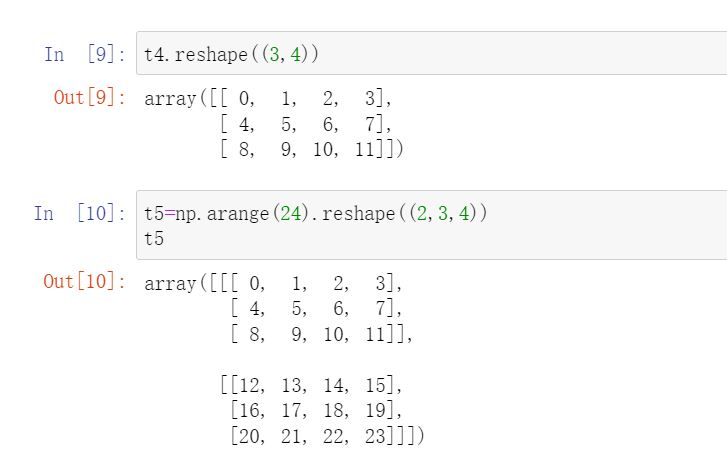
Modify the shape of the array
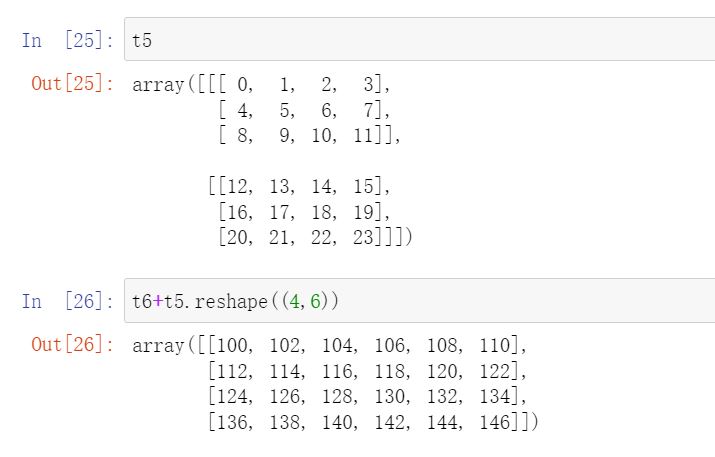
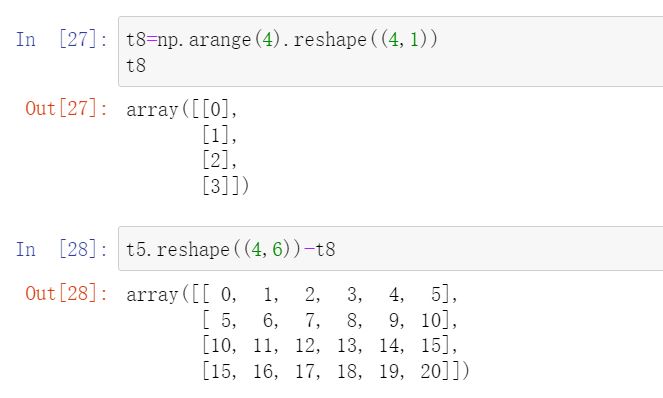
Inter array operation
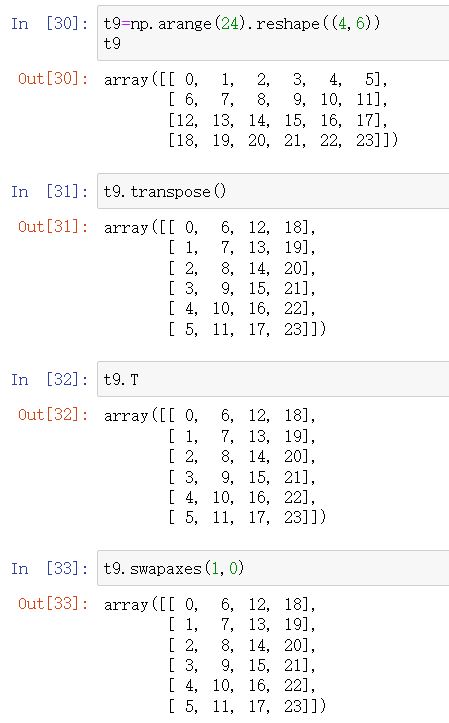
Transpose matrix
numpy read data
CSV: comma separated value, comma separated value file
Displaying: table status
Source file: formatted text with newline and comma separated rows and columns. The data of each line represents a record
Because csv is easy to display, read and write, many places also use csv format to store and transmit small and medium-sized data. In order to facilitate teaching, we will often operate csv format files, but it is also easy to operate the data in the database
numpy read data
numpy reads and stores data
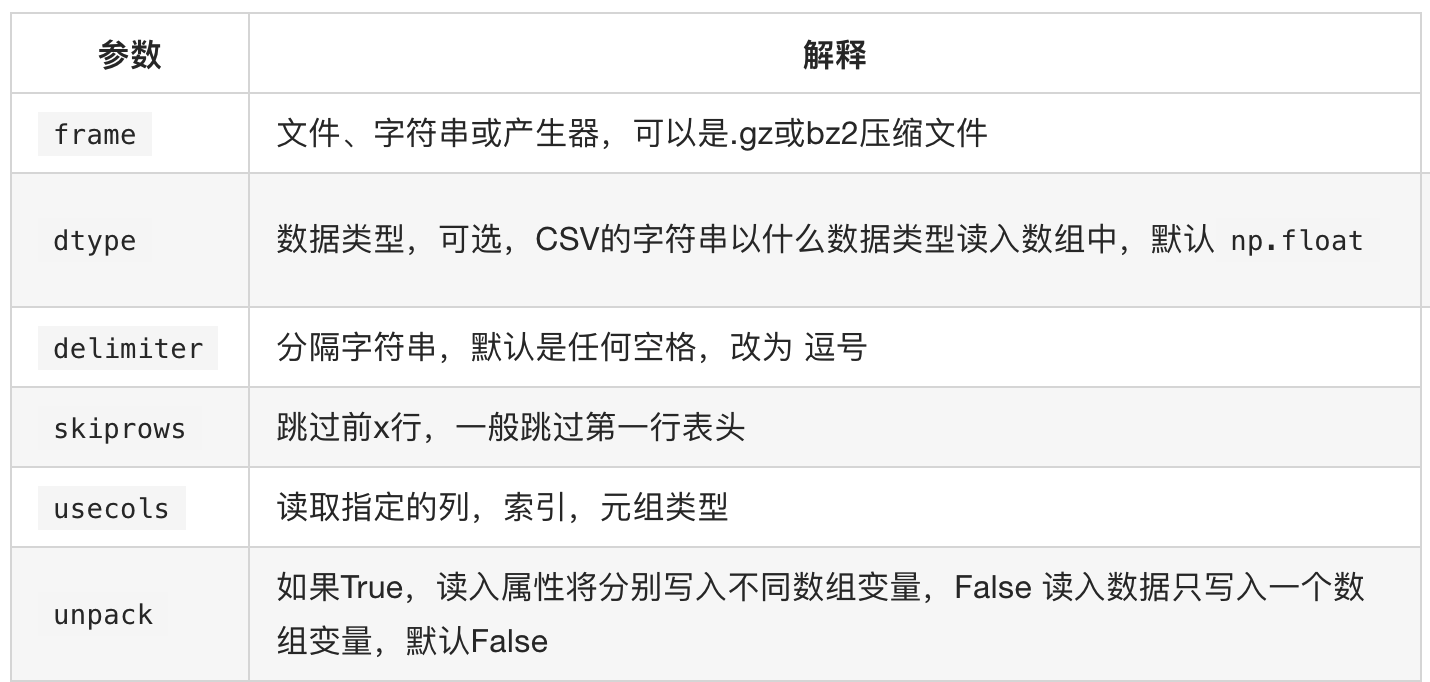
# coding=utf-8
import numpy as np
us_file_path = "./youtube_video_data/US_video_data_numbers.csv"
uk_file_path = "./youtube_video_data/GB_video_data_numbers.csv"
# t1 = np.loadtxt(us_file_path,delimiter=",",dtype="int",unpack=True)
t2 = np.loadtxt(us_file_path,delimiter=",",dtype="int")
# print(t1)
print(t2)
print("*"*100)

b = t2[2:5,1:4]
# print(b)
#Take multiple non adjacent points
#The selected result is (0, 0) (2, 1) (2, 3)
c = t2[[0,2,2],[0,1,3]]
print(c)
Operation results:
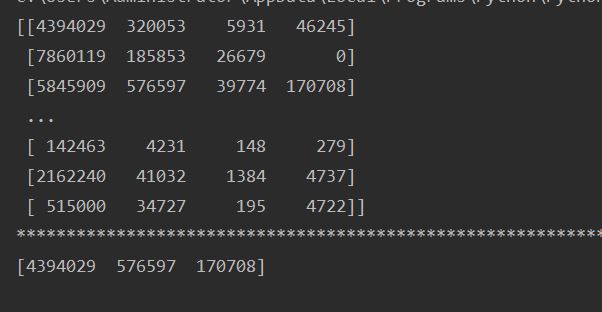
Boolean index in numpy
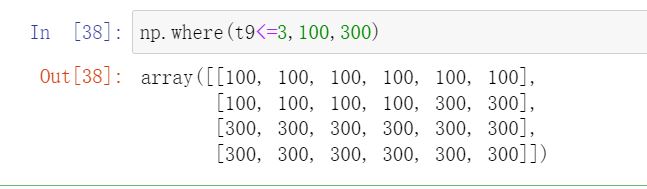
Ternary operators in numpy
nan and inf in numpy
nan(NAN,Nan):not a number means not a number
When we read the local file as float, nan will appear if it is missing
As an inappropriate calculation (such as infinity minus infinity)
inf(-inf,inf):infinity,inf means positive infinity, - inf means negative infinity
When will inf appear, including (- inf, + INF)
For example, if a number is divided by 0, (an error will be reported directly in python, and an inf or - inf in numpy)
Notes on nan in numpy
1. Two nan are not equal
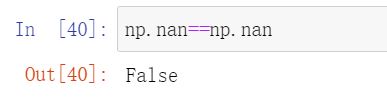
2.np.nan!=np.nan
3. Use the above characteristics to judge the number of nan in the array
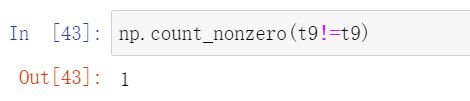
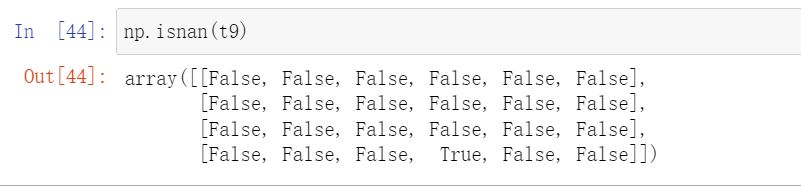
4. Judge whether a number is nan through NP IsNaN (a)
5.nan and any value calculation are nan
###Common statistical functions in numpy
Summation: t.sum(axis=None)
Mean: t.mean(a,axis=None) is greatly affected by outliers
Median: NP median(t,axis=None)
Maximum value: t.max(axis=None)
Minimum value: t.min(axis=None)
Extreme value: NP PTP (T, axis = none) is the difference between the maximum value and the minimum value
Standard deviation: t.std(axis=None)
Fill nan in numpy
# coding=utf-8
import numpy as np
# print(t1)
def fill_ndarray(t1):
for i in range(t1.shape[1]): #Traverse each column
temp_col = t1[:,i] #Current column
nan_num = np.count_nonzero(temp_col!=temp_col)
if nan_num !=0: #If it is not 0, it indicates that nan exists in the current column
temp_not_nan_col = temp_col[temp_col==temp_col] #The current array column is not nan
# Select the position that is currently nan and assign the value to the mean value that is not nan
temp_col[np.isnan(temp_col)] = temp_not_nan_col.mean()
return t1
if __name__ == '__main__':
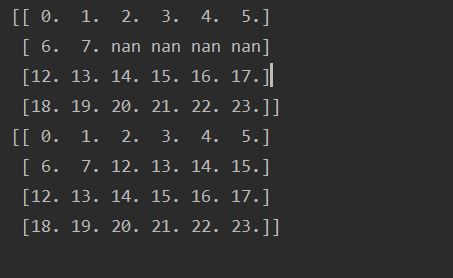
t1 = np.arange(24).reshape((4, 6)).astype("float")
t1[1, 2:] = np.nan
print(t1)
t1 = fill_ndarray(t1)
print(t1)
Operation results:
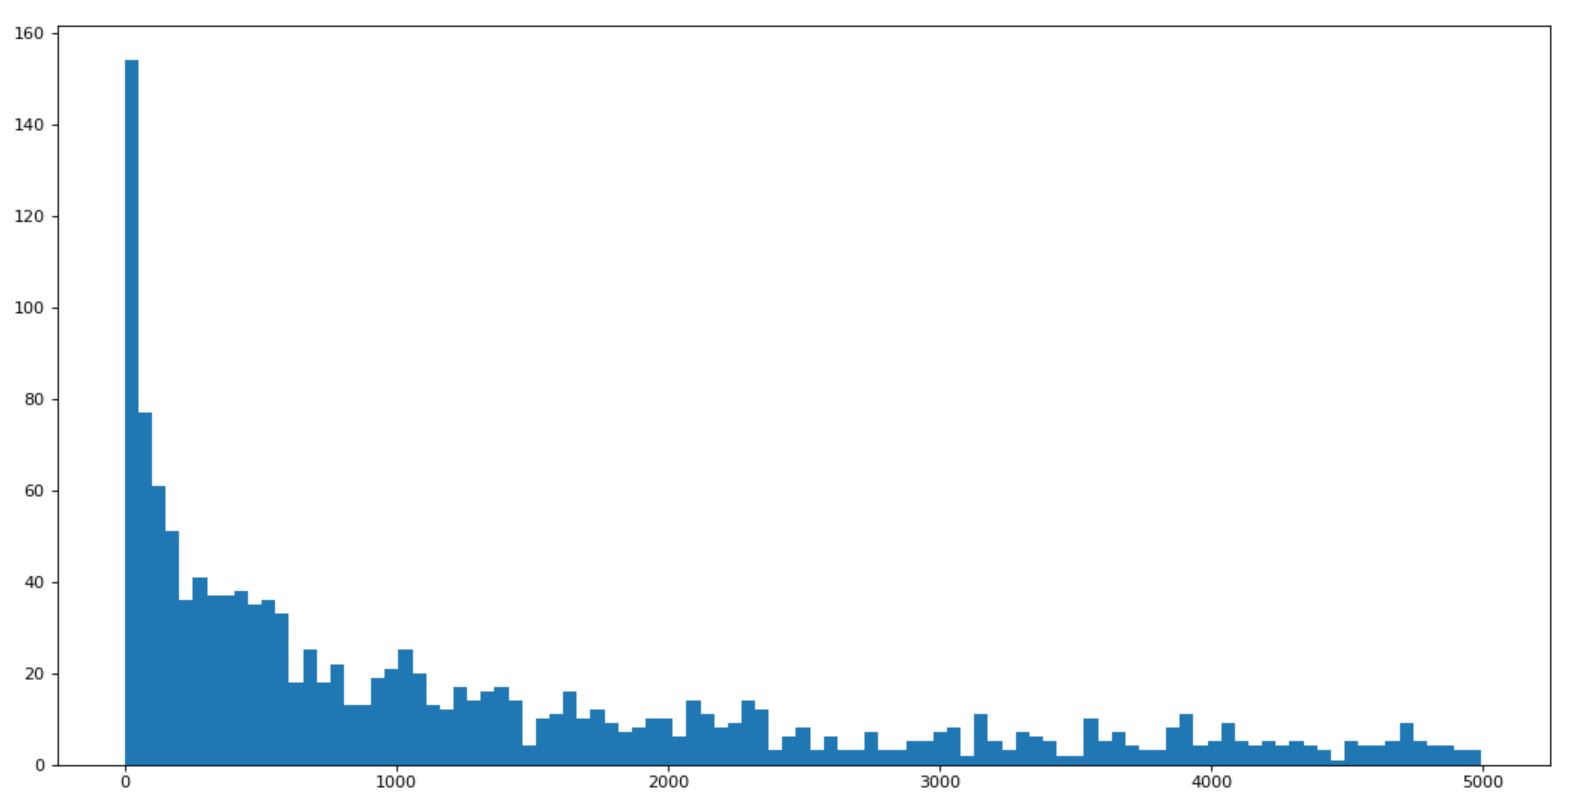
[hands on] the data of youtube1000 in Britain and the United States are combined with the previous matplotlib to draw the histogram of the number of comments
import numpy as np
from matplotlib import  pyplot as plt
us_file_path = "./youtube_video_data/US_video_data_numbers.csv"
uk_file_path = "./youtube_video_data/GB_video_data_numbers.csv"
# t1 = np.loadtxt(us_file_path,delimiter=",",dtype="int",unpack=True)
t_us = np.loadtxt(us_file_path,delimiter=",",dtype="int")
#Get the data of comments
t_us_comments = t_us[:,-1]
#Select data smaller than 5000
t_us_comments = t_us_comments[t_us_comments<=5000]
print(t_us_comments.max(),t_us_comments.min())
d = 50
bin_nums = (t_us_comments.max()-t_us_comments.min())//d
#mapping
plt.figure(figsize=(20,8),dpi=80)
plt.hist(t_us_comments,bin_nums)
plt.show()
Operation results:
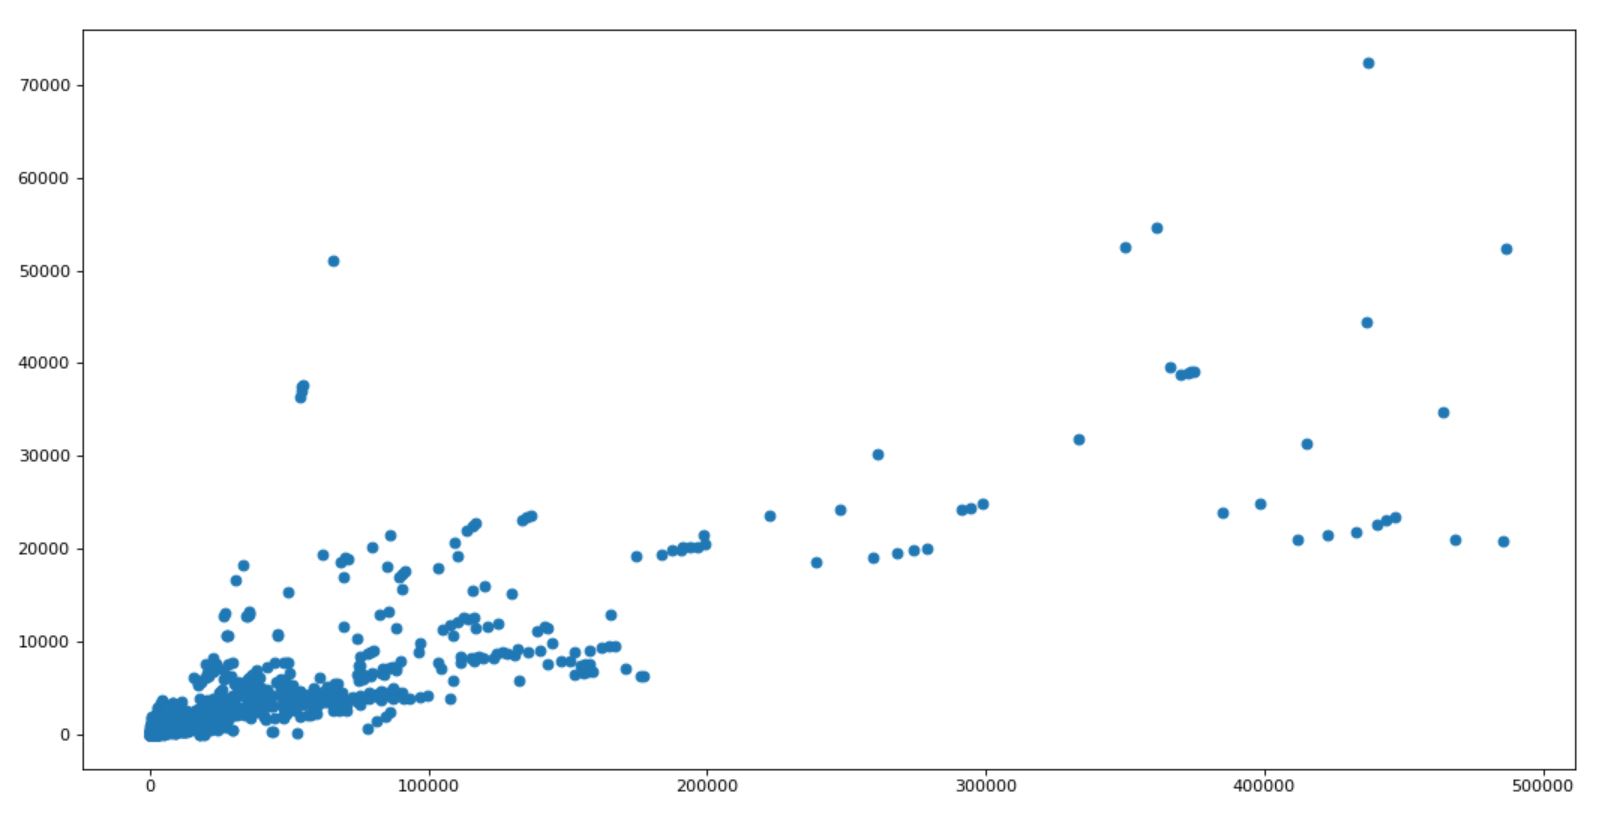
[hands on] I want to know the relationship between the number of comments and the number of likes on youtube in the UK, and how to draw and change the map
import numpy as np
from matplotlib import  pyplot as plt
us_file_path = "./youtube_video_data/US_video_data_numbers.csv"
uk_file_path = "./youtube_video_data/GB_video_data_numbers.csv"
t_uk = np.loadtxt(uk_file_path,delimiter=",",dtype="int")
#Choose data that likes books smaller than 500000
t_uk = t_uk[t_uk[:,1]<=500000]
t_uk_comment = t_uk[:,-1]
t_uk_like = t_uk[:,1]
plt.figure(figsize=(20,8),dpi=80)
plt.scatter(t_uk_like,t_uk_comment)
plt.show()
Operation results:
Row column exchange of array
The horizontal or vertical splicing of arrays is very simple, but what should we pay attention to before splicing?
Vertical splicing: each column represents the same meaning!!! Otherwise, the bull's head is not the horse's mouth
If the meaning of each column is different, the columns of a certain group of numbers should be exchanged at this time to make them the same as other types
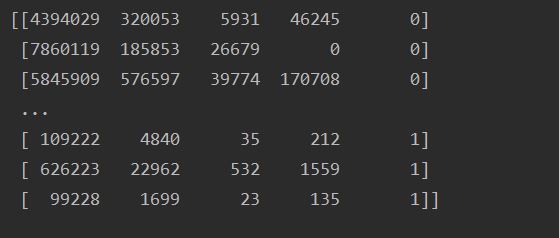
[hands on] what should we do now if we want to study and analyze the data methods of the two countries in the previous case together and retain the country information (the country source of each data)
import numpy as np
us_data = "./youtube_video_data/US_video_data_numbers.csv"
uk_data = "./youtube_video_data/GB_video_data_numbers.csv"
#Load country data
us_data = np.loadtxt(us_data,delimiter=",",dtype=int)
uk_data = np.loadtxt(uk_data,delimiter=",",dtype=int)
# Add country information
#Construct data with all 0
zeros_data = np.zeros((us_data.shape[0],1)).astype(int)
ones_data = np.ones((uk_data.shape[0],1)).astype(int)
#Add an array with all 0 and 1 columns respectively
us_data = np.hstack((us_data,zeros_data))
uk_data = np.hstack((uk_data,ones_data))
# Splice two sets of data
final_data = np.vstack((us_data,uk_data))
print(final_data)
Operation results:
numpy more easy to use methods
1. Get the position of the maximum and minimum values
np.argmax(t,axis=0)
np.argmin(t,axis=1)
2. Create an array of all zeros: NP zeros((3,4))
3. Create an array of all 1: NP ones((3,4))
4. Create a square array (square array) with diagonal 1: NP eye(3)