Overview of k-nearest neighbor algorithm
In short, the k-nearest neighbor algorithm uses the method of measuring the distance between different eigenvalues for classification
Working principle of k-nearest neighbor algorithm: there is a sample data set, also known as training sample set, and each data in the sample set has a label, that is, we know the corresponding relationship between each data in the sample set and its classification. After entering the new data without labels, each feature of the new data is compared with the corresponding feature of the data in the sample set, and then the algorithm extracts the classification label of the data with the most similar feature in the sample set. Generally speaking, only the first k most similar data are taken, and usually K is an integer not greater than 20.
Advantages, disadvantages and application scope of k-nearest neighbor algorithm
Advantages: high precision, insensitive to outliers and no data input assumption
Disadvantages: high computational complexity and space complexity
Applicable data range: numerical type and nominal type
General flow of k-nearest neighbor algorithm
- Collect data: any method can be used.
- Prepare data: the value required for distance calculation, preferably in a structured data format.
- Analyze data: any method can be used.
- Training algorithm: this step is not applicable to k-nearest neighbor algorithm.
- Test algorithm: calculate the error rate.
- Using the algorithm: first, input the sample data and structured output results, then run the k-nearest neighbor algorithm to determine which classification the input data belongs to, and finally perform subsequent processing on the calculated classification.
Preparation: importing data using python
from numpy import *
import operator

def createDataSet():
    group=array([[1.0,1.1],[1.0,1.0],[0,0],[0,0.1]])
    labels=['A','A','B','B']
    return group,labels
Each row of the group matrix contains a different data. We can think of it as different measurement points or entries in a log file.
Vector labels contains the label information of each data point. The number of elements contained in labels is equal to the number of rows of the group matrix.
Implementation of kNN classification algorithm
def classify(inX,dataSet,labels,k):
    dataSetSize=dataSet.shape[0]
    diffMat=tile(inX,(dataSetSize,1))-dataSet
    sqDiffMat=diffMat**2
    sqDistances=sqDistances**0.5
    sortedDistIndicies=distances.argsort()
    classCount={}
    for i in range(k):
        voteIlabel=labels[sortedDistIndicies[i]]
        classCount[voteIlabel]=classCount.get(voteIlabel,0)+1
    sortedClassCount=sorted(classCount.iteritems(),key=operator.itemgetter(1),reverse=True)
    return sortedClassCount[0][0]
The function has four input parameters: the input vector inX for classification, the input training sample set is dataSet, and the label vector is labels. The last parameter k represents the number of nearest neighbors for selection, in which the number of elements of the label vector is the same as the number of rows of the matrix dataSet.
- Distance calculation
- Select the k points with the smallest distance
- sort
Resolver for converting text records to NumPy
def file2matrix(filename):
    fr=open(filename)
    arrayOLines=fr.readlines()
    numberOfLines=len(arrayOLines)
    returnMat=zeros((numberOfLines,3))
    classLabelVector=[]
    index=0
    for line in arrayOLines:
        line=line.strip()
        listFromLine=line.split('\t')
        returnMat[index,:]=listFromLine[0:3]
        classLabelVector.append(int(listFromLine[-1]))
        index+=1
    return returnMat,classLabelVector
- Get the number of file lines
- Create returned NumPy matrix
- Parse file data to list
When using the function file2matrix to read file data, we must ensure that the file datingTestSet2.txt is stored in our working directory. In addition, before executing this function, we reload the kNN.py module to ensure that the updated content can take effect, otherwise Python will continue to use the last loaded module.
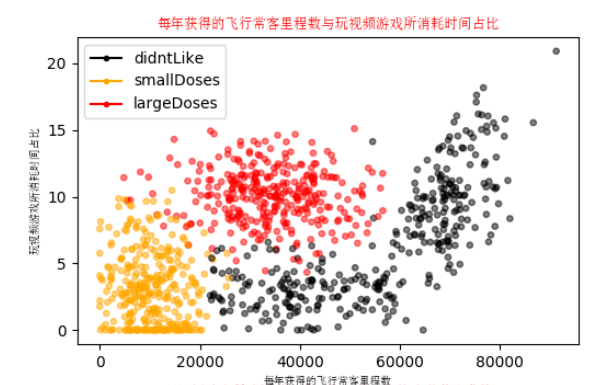
Analyzing data: creating scatter charts using Matplotlib
Use Matplotlib to make a scatter diagram of the original data. Generally speaking, it is necessary to use color or other marks to mark different sample classifications in order to better understand the data information.
Preparation data: normalized data
When dealing with eigenvalues in different value ranges, we usually use the method of normalizing the values. The following formula can convert eigenvalues in any range into values in the range of 0 to 1.
newValue(oldValue-min)/(max-min)
Where min and max are the minimum eigenvalue and the maximum eigenvalue in the data set respectively. The following autoNorm() function can automatically convert the digital eigenvalue into an interval from 0 to 1.
def autoNorm(dataSet):
    #Get the minimum value of the data
    minVals = dataSet.min(0)
    maxVals = dataSet.max(0)
    #Range of maximum and minimum values
    ranges = maxVals - minVals
    #shape(dataSet) returns the number of matrix rows and columns of the dataSet
    normDataSet = zeros(shape(dataSet))
    #Returns the number of rows in the dataSet
    m = dataSet.shape[0]
    #Original value minus minimum value
    normDataSet = dataSet - tile(minVals, (m, 1))
    #The normalized data is obtained by dividing the difference between the maximum and minimum values
    normDataSet = normDataSet / tile(ranges, (m, 1))
    #Return normalized data result, data range, minimum value
    return normDataSet, ranges, minVals
In the function aotoNorm(), we put the minimum value of each column in the variable minVals and the maximum value in the variable maxVals. The parameter 0 in dataSet.min(0) enables the function to select the minimum value from the column instead of the minimum value of the current row.
Test algorithm: verification classifier
A very important task of machine learning algorithm is to evaluate the accuracy of the algorithm. Usually, we only provide 90% of the existing data as training samples to train the classifier, and use the remaining 10% data to test the classifier to detect the accuracy of the classifier. It should be noted that 10% of the test data should be randomly selected. Since the data provided by Helen is not sorted according to specific purposes, you can choose 10% of the data at will without affecting its randomness.
def datingClassTest():
    #Open file name
    filename = "datingTestSet.txt"
    #Store the returned feature matrix and classification vector in datingDataMat and datingLabels respectively
    datingDataMat, datingLabels = file2matrix(filename)
    #Take 10% of all data
    hoRatio = 0.10
    #Data normalization, return the normalized matrix, data range and data minimum value
    normMat, ranges, minVals = autoNorm(datingDataMat)
    #Get the number of rows of normMat
    m = normMat.shape[0]
    #Ten percent of the number of test data
    numTestVecs = int(m * hoRatio)
    #Classification error count
    errorCount = 0.0

    for i in range(numTestVecs):
        #The first numTestVecs data is used as the test set, and the last m-numTestVecs data is used as the training set
        classifierResult = classify0(normMat[i,:], normMat[numTestVecs:m,:],
            datingLabels[numTestVecs:m], 4)
        print("Classification results:%d\t Real category:%d" % (classifierResult, datingLabels[i]))
        if classifierResult != datingLabels[i]:
            errorCount += 1.0
    print("the total error rate is: %f" %(errorCount/float(numTestVecs)*100))
Using algorithms: building complete and usable systems
def classifyPerson():
    #Output results
    resultList = ['Detestable','Some like','like it very much']
    #3D feature user input
    precentTats = float(input("Percentage of time spent playing video games:"))
    ffMiles = float(input("Frequent flyer miles per year:"))
    iceCream = float(input("Litres of ice cream consumed per week:"))
    filename = "datingTestSet.txt"
    datingDataMat, datingLabels = file2matrix(filename)
    #Training set normalization
    normMat, ranges, minVals = autoNorm(datingDataMat)
    inArr = np.array([precentTats, ffMiles, iceCream])
    #Test set normalization
    norminArr = (inArr - minVals) / ranges
    classifierResult = classify0(norminArr, normMat, datingLabels, 3)
    print("You may%s this man" % (resultList[classifierResult-1]))
Handwritten numeral recognition using k-nearest neighbor algorithm
- Collect data: provide text files
- Active and standby data: write the function img2vector() to convert the image format into the vector format used by the classifier.
- Analyze the data and check the data at the python command prompt to make sure it meets the requirements.
- Training algorithm: this step is not applicable to k-nearest neighbor algorithm.
- Test algorithm: write the function and use part of the data set provided as the test sample. The difference between the test sample and the non test sample is that the test sample is the data that has been classified. If the predicted classification is different from the actual classification, it will be marked as an error.
def img2vector(filename):
    returnVect=zeros((1,1024))
    fr=open(filename)
    for i in range(32):
        lineStr=fr.readline()
        for j in range(32):
            returnVect[0,32*i+j]=int(lineStr[j])
    return returnVect
Test algorithm:
from os import listdir
from numpy import *
import numpy as np
import operator
import datetime

def KNN(test_data,train_data,train_label,k):
    #The number of rows of a data set (training set) with known classification
    dataSetSize = train_data.shape[0]
    #Find all distances: first, the tile function expands the input points into a matrix with the same dimension as the training set, and calculates the distance between the test sample and each training sample
    all_distances = np.sqrt(np.sum(np.square(tile(test_data,(dataSetSize,1))-train_data),axis=1))
    #print("all distances:", all_distances)
    #Press all_ The elements in distances are sorted in ascending order to get the list of their corresponding indexes
    sort_distance_index = all_distances.argsort()
    #print("file index sort:", sort_distance_index)
    #Select the k points with the smallest distance
    classCount = {}
    for i in range(k):
        #Returns the index (predicted value) of the training set with the minimum distance
        voteIlabel = train_label[sort_distance_index[i]]
        #print('second ', i+1,' second predicted value ', voteIlabel)
        classCount[voteIlabel] = classCount.get(voteIlabel,0)+1
    #Find mode: sort by the second element of the classCount Dictionary (i.e. the number of occurrences of the category) from large to small
    sortedClassCount = sorted(classCount.items(), key = operator.itemgetter(1), reverse = True)
    return sortedClassCount[0][0]

#Text vectorization 32x32 - > 1x1024
def img2vector(filename):
    returnVect = []
    fr = open(filename)
    for i in range(32):
        lineStr = fr.readline()
        for j in range(32):
            returnVect.append(int(lineStr[j]))
    return returnVect

#Resolve classification number from file name
def classnumCut(fileName):
    #The format of reference file name is: 0_3.txt
    fileStr = fileName.split('.')[0]
    classNumStr = int(fileStr.split('_')[0])
    return classNumStr

#Construct the training set data vector and the corresponding classification label vector
def trainingDataSet():
    train_label = []
    trainingFileList = listdir('trainingDigits')
    m = len(trainingFileList)
    train_data = zeros((m,1024))
    #Gets the label of the training set
    for i in range(m):
        # fileNameStr: file names of all training sets
        fileNameStr = trainingFileList[i]
        # Get training set index
        train_label.append(classnumCut(fileNameStr))
        train_data[i,:] = img2vector('trainingDigits/%s' % fileNameStr)
    return train_label,train_data

#Test function
def main():
    t1 = datetime.datetime.now()  # Timing start
    Nearest_Neighbor_number = int(input('Select the nearest K Values, K='))
    train_label,train_data = trainingDataSet()
    testFileList = listdir('testDigits')
    error_sum = 0
    test_number = len(testFileList)
    for i in range(test_number):
        #Test set file name
        fileNameStr = testFileList[i]
        #Get the test set index after slicing
        classNumStr = classnumCut(fileNameStr)
        test_data = img2vector('testDigits/%s' % fileNameStr)
        #Call knn algorithm to test
        classifierResult = KNN(test_data, train_data, train_label, Nearest_Neighbor_number)
        print ("The first",i+1,"Group:","Estimate:",classifierResult,"True value:",classNumStr)
        if (classifierResult != classNumStr):
            error_sum += 1.0
    print ("\n The total number of test sets is:",test_number)
    print ("Total number of test errors:",error_sum)
    print ("\n error rate:",error_sum/float(test_number)*100,'%')
    t2 = datetime.datetime.now()
    print('Time consuming = ', t2 - t1)

if __name__ == "__main__":
    main()
Summary of this chapter
- k-nearest neighbor algorithm must save all data sets. If the training data set is large, it must use a lot of storage space.
- The distance value must be calculated for each data in the dataset, which may be very time-consuming in actual use.
- The basic structure information of any data cannot be given, and the characteristics of average instance samples and typical instance samples cannot be known.