Introduction to logistic regression
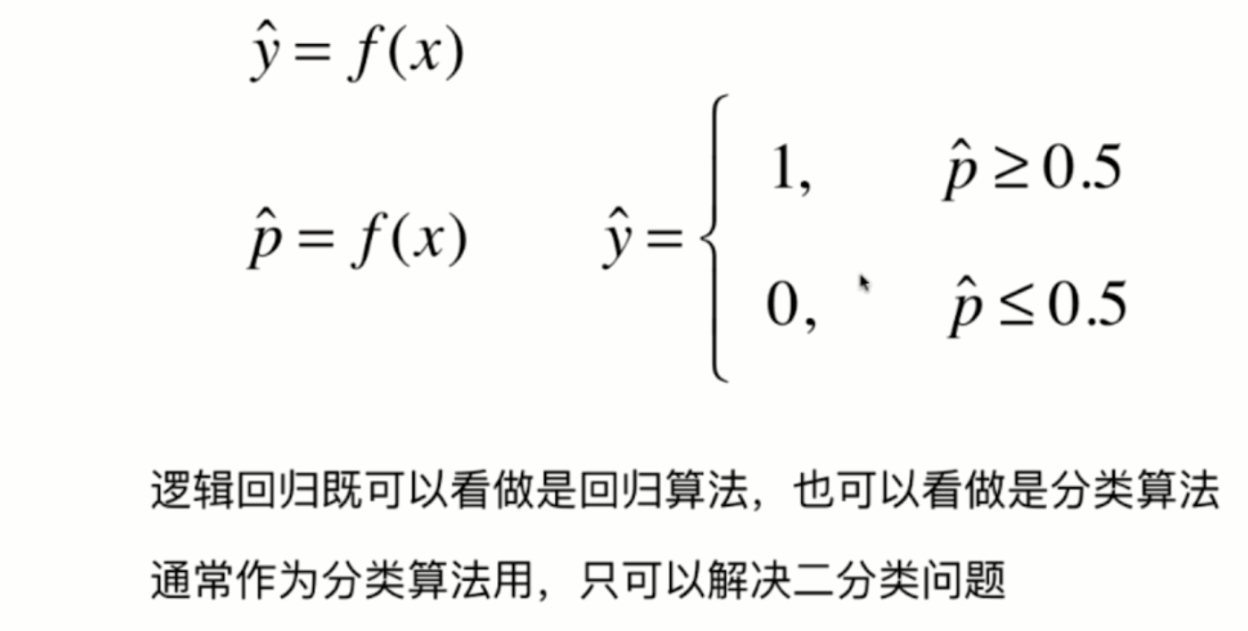
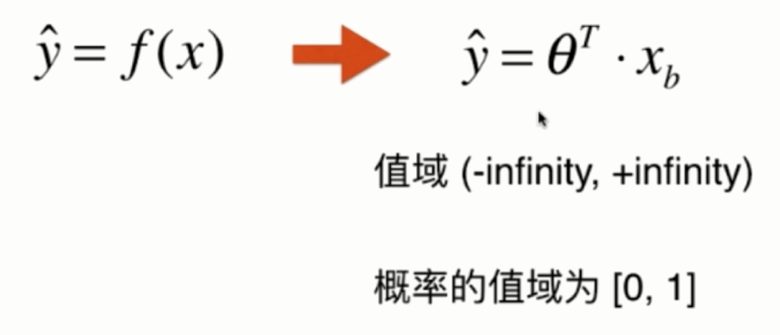
logistic regression is a generalized linear regression analysis model. Taking the condition analysis of gastric cancer as an example, two groups of people are selected, one is gastric cancer group and the other is non gastric cancer group. The two groups must have different signs and lifestyles. Therefore, if the dependent variable is gastric cancer and the value is "yes" or "no", the independent variables can include many, such as age, gender, eating habits, Helicobacter pylori infection, etc.


Draw sigmoid curve
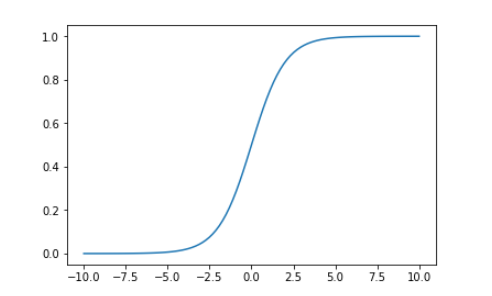
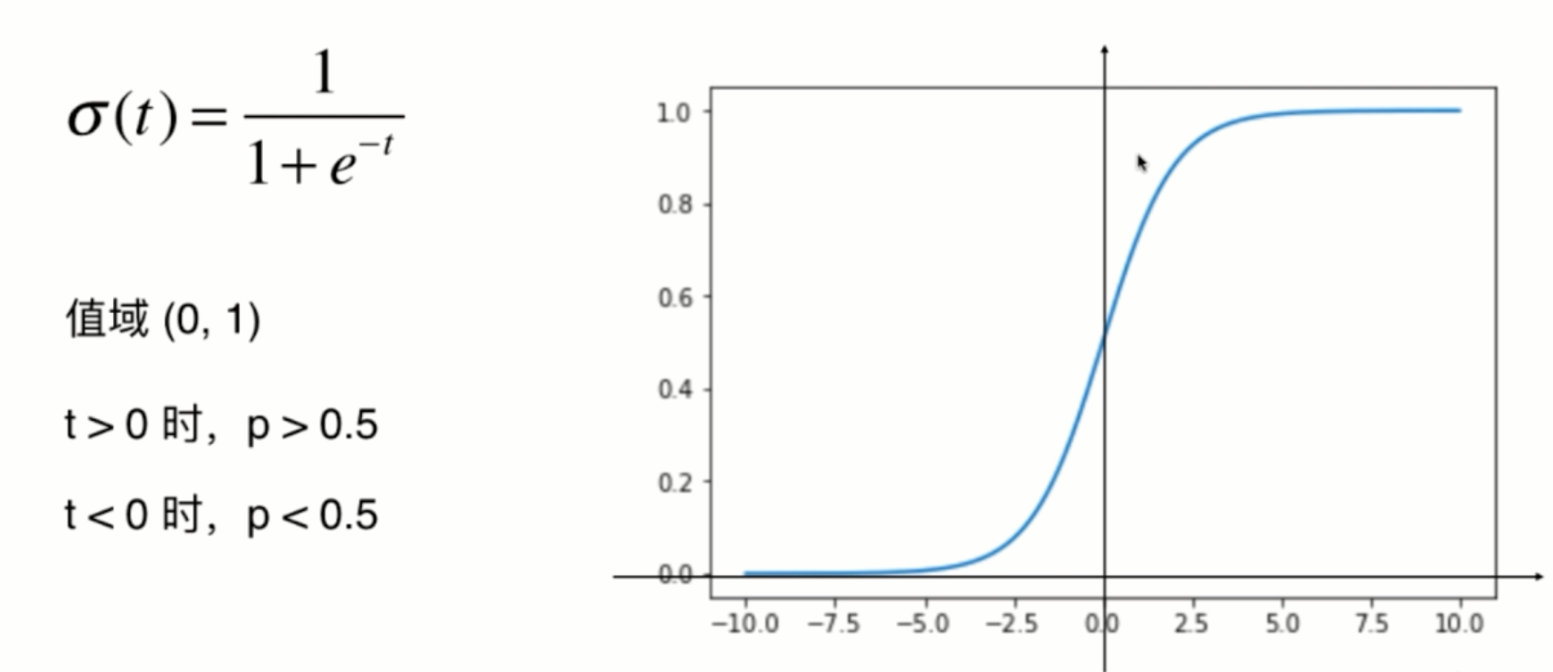
import numpy as np
import matplotlib.pyplot as plt
def sigmoid(t):
    return 1. / (1. + np.exp(-t))
x = np.linspace(-10, 10, 500)

plt.plot(x, sigmoid(x))
plt.show()
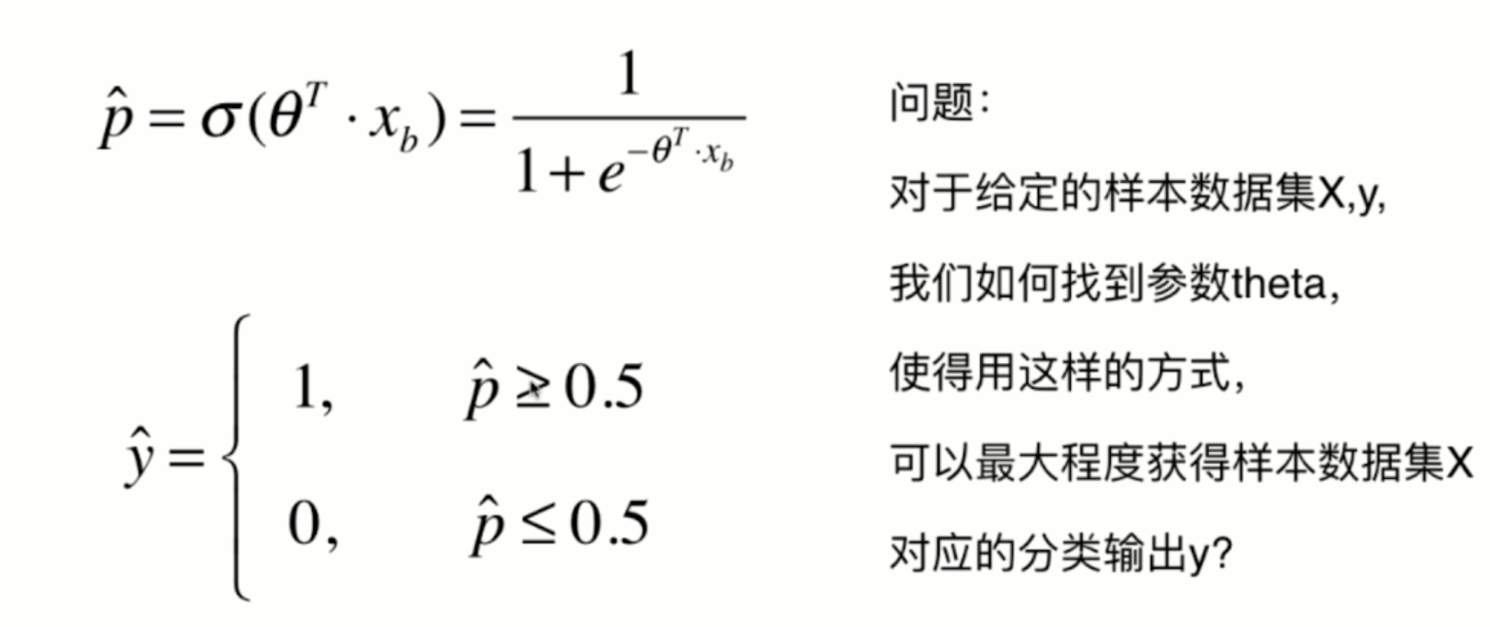
Loss function of logistic regression
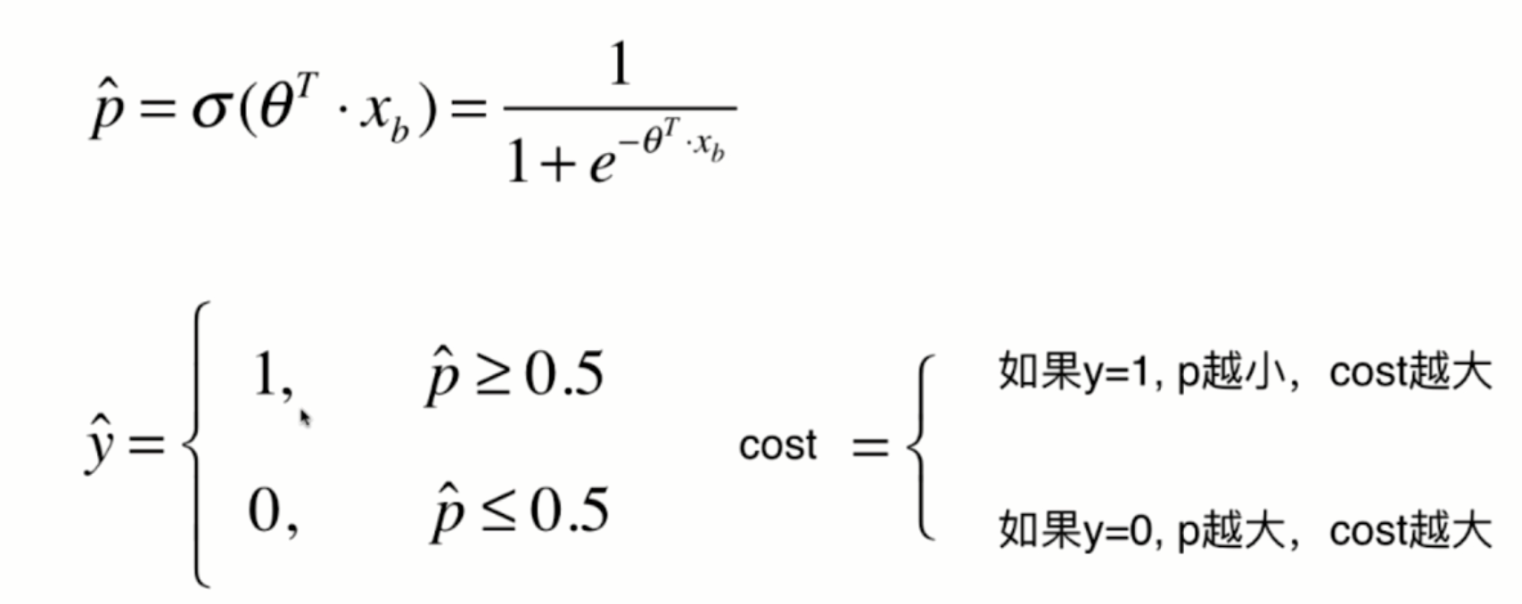
The function image of y=log(x) is shown in the following figure:
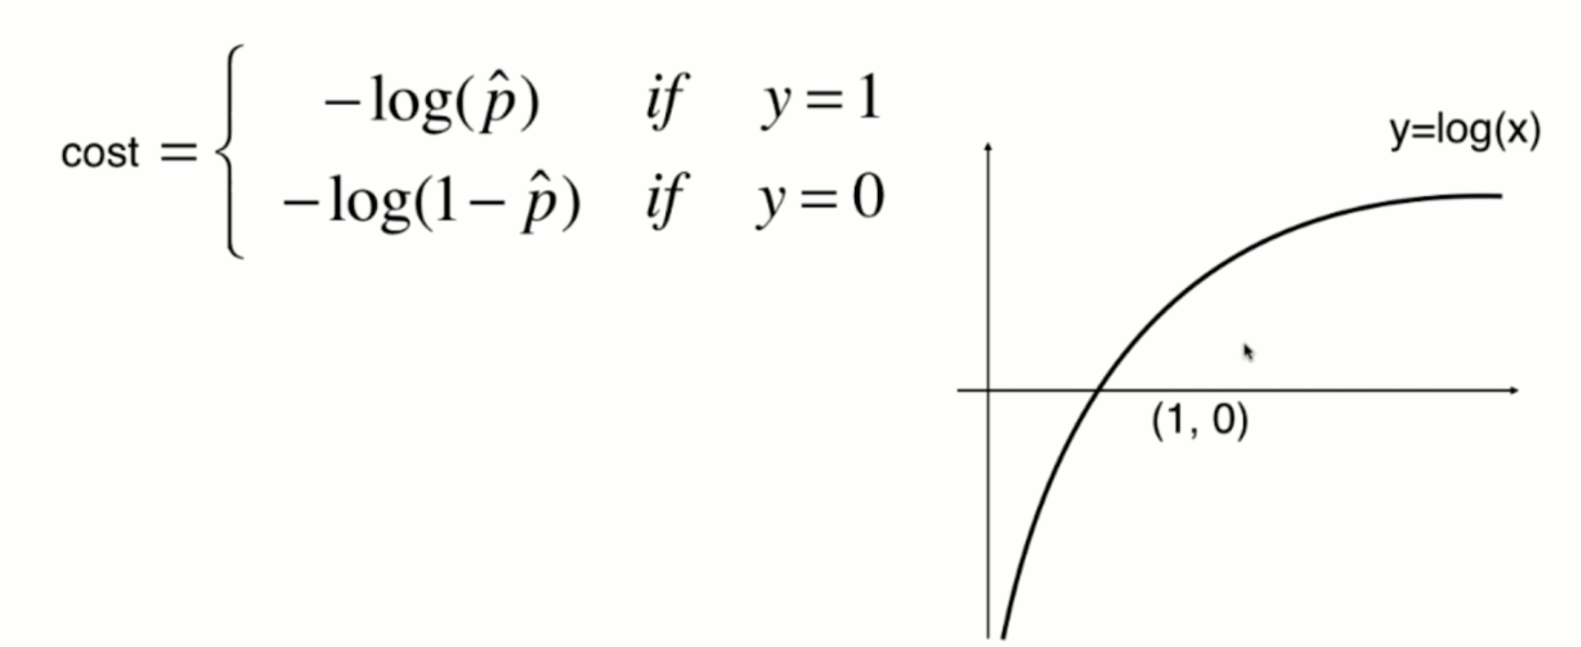
The function image of y=-log(x) is shown in the following figure:
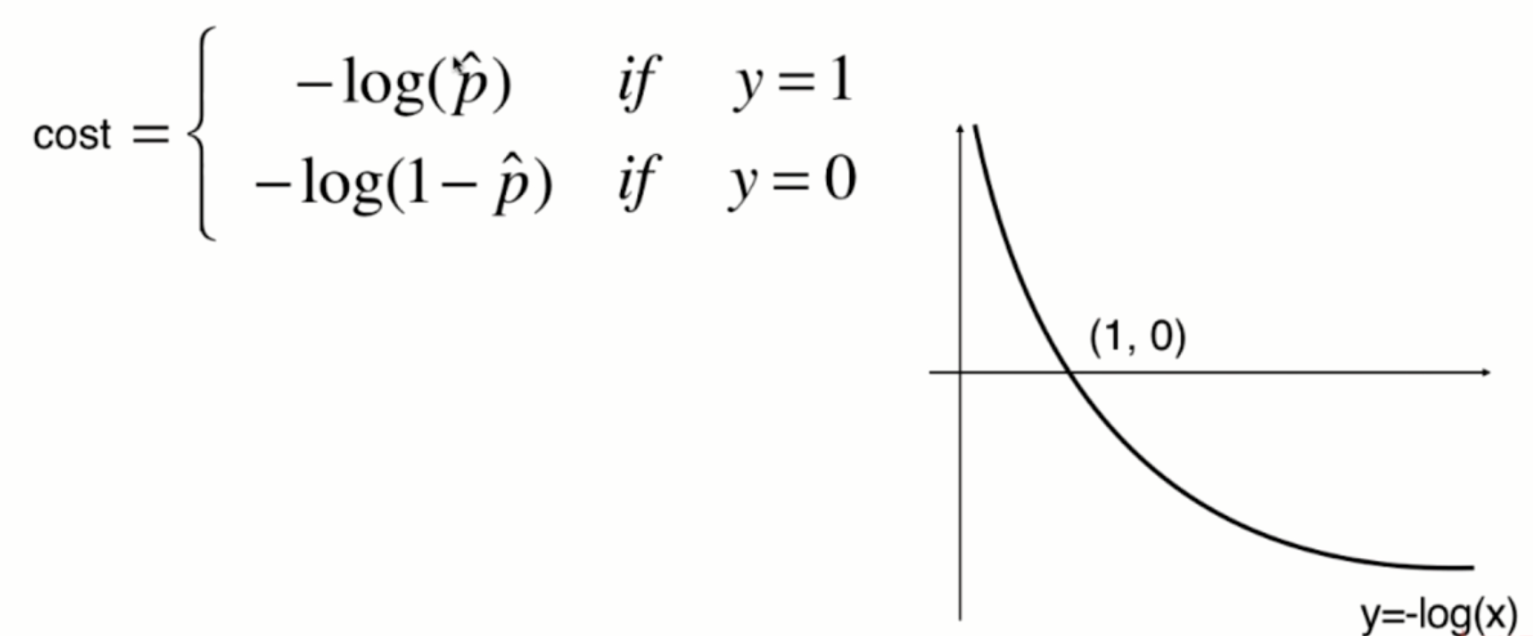
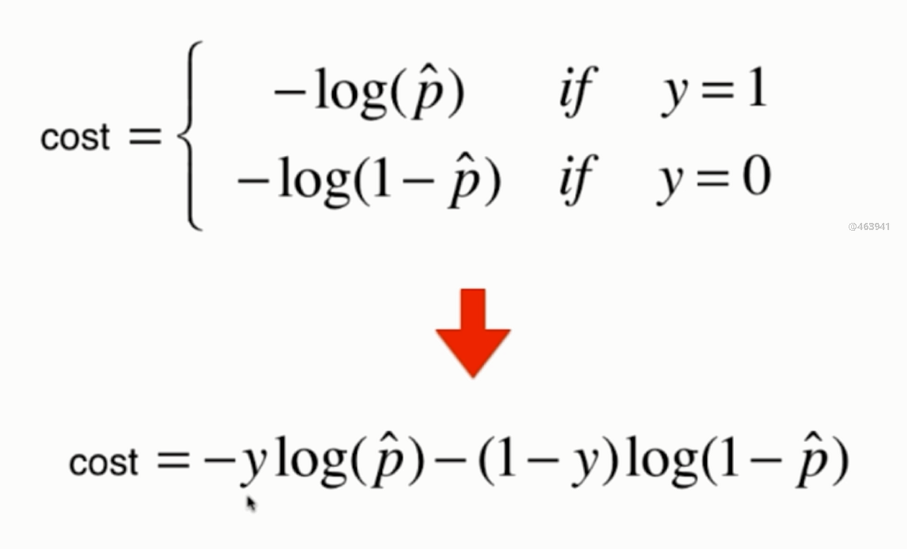
Since the value of p can only be between 0 and 1, therefore:
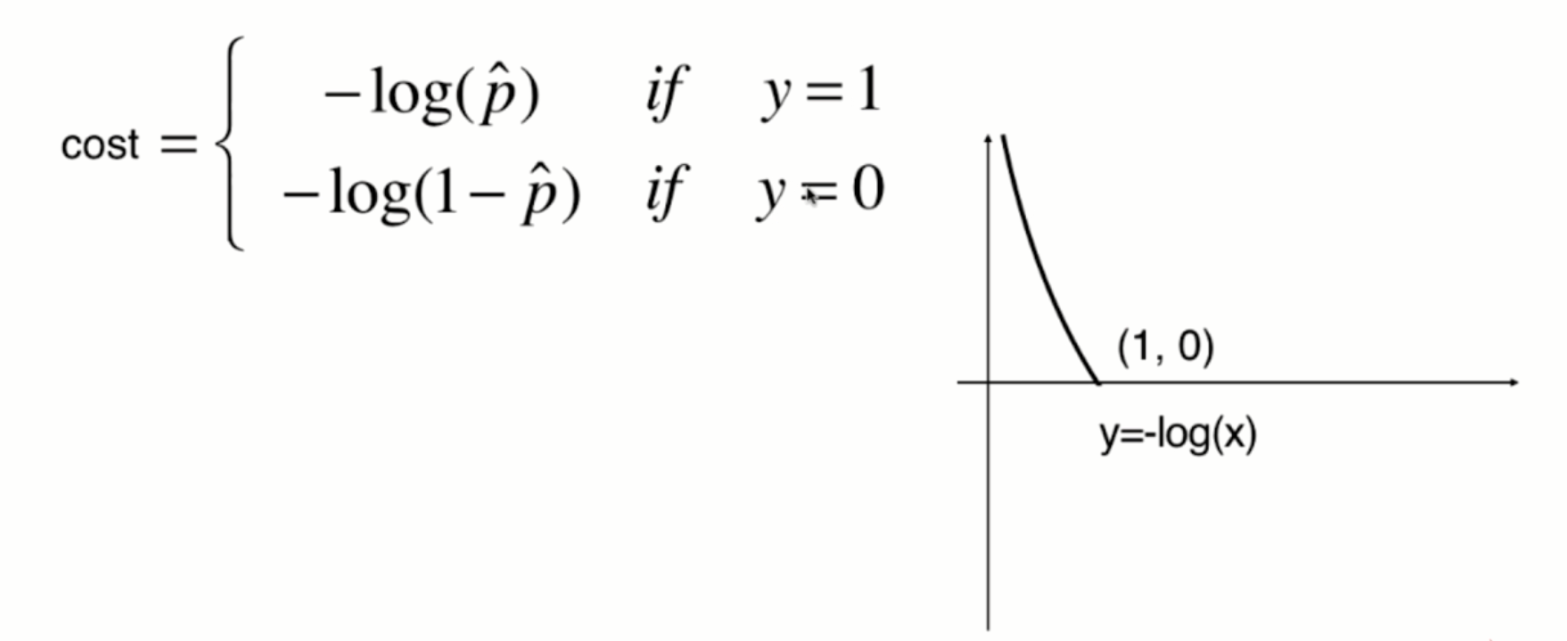
When p is 0, according to the previous sigmoid function definition, the predicted classification y should be 0, but at this time, the real classification y=1, The - log § tends to infinity (large loss function), which well expresses the inaccuracy of prediction; when p is 1, according to the previous sigmoid function definition, the prediction classification y should be 1. At this time, the real classification y is also equal to 1, and the - log § tends to 0 (small loss function), which well expresses the accuracy of prediction.
The same is true in the other case.
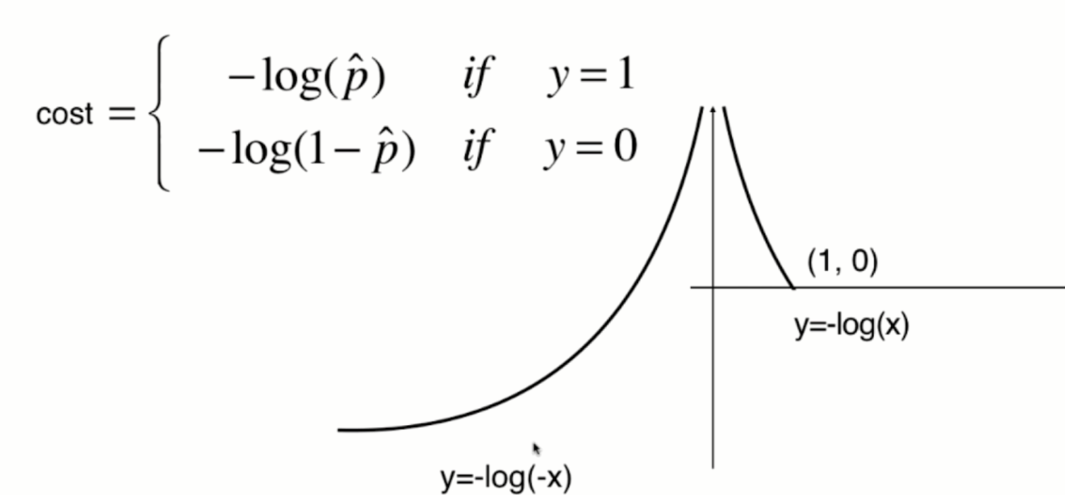
The function image of y=-log(-x) is shown in the following figure (symmetrical with y=-log(x) about the Y axis):
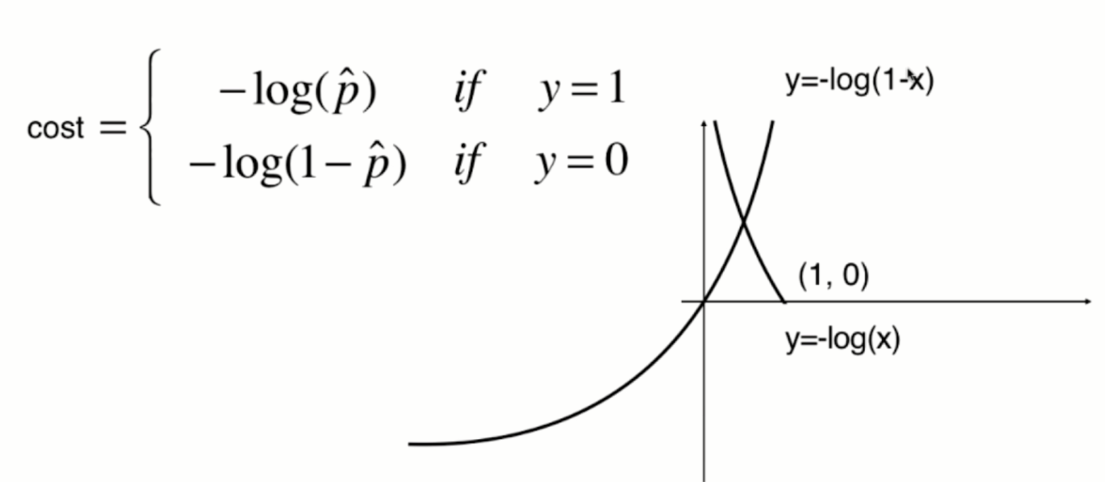
The function image of y=-log(1-x) is shown in the following figure (translate one unit to the right along the X axis):
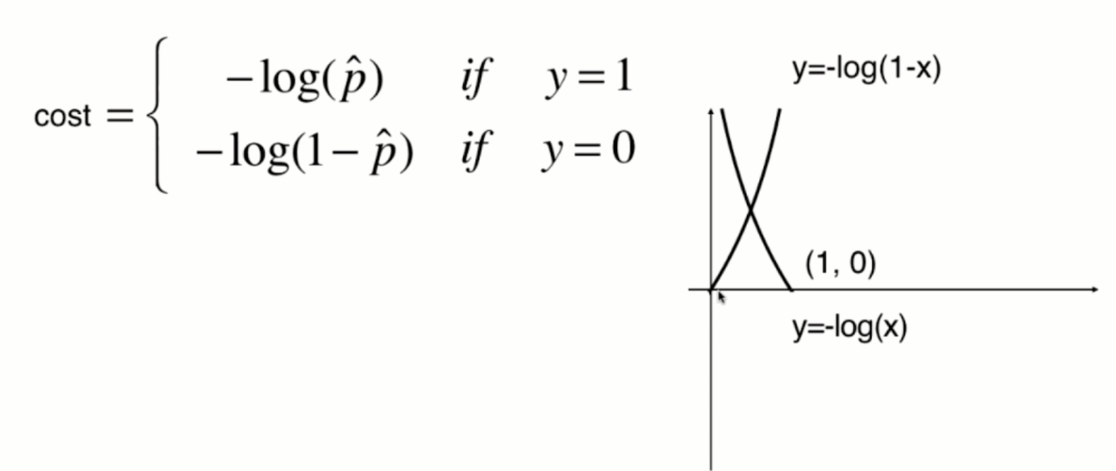
Synthesize a formula:
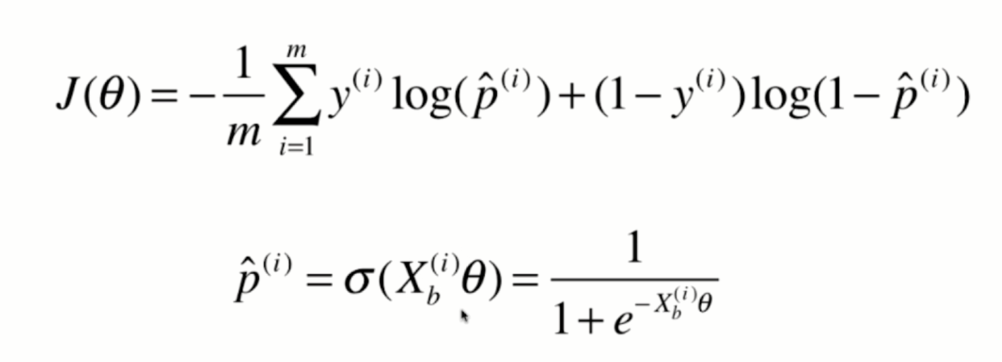
Consider multiple samples:

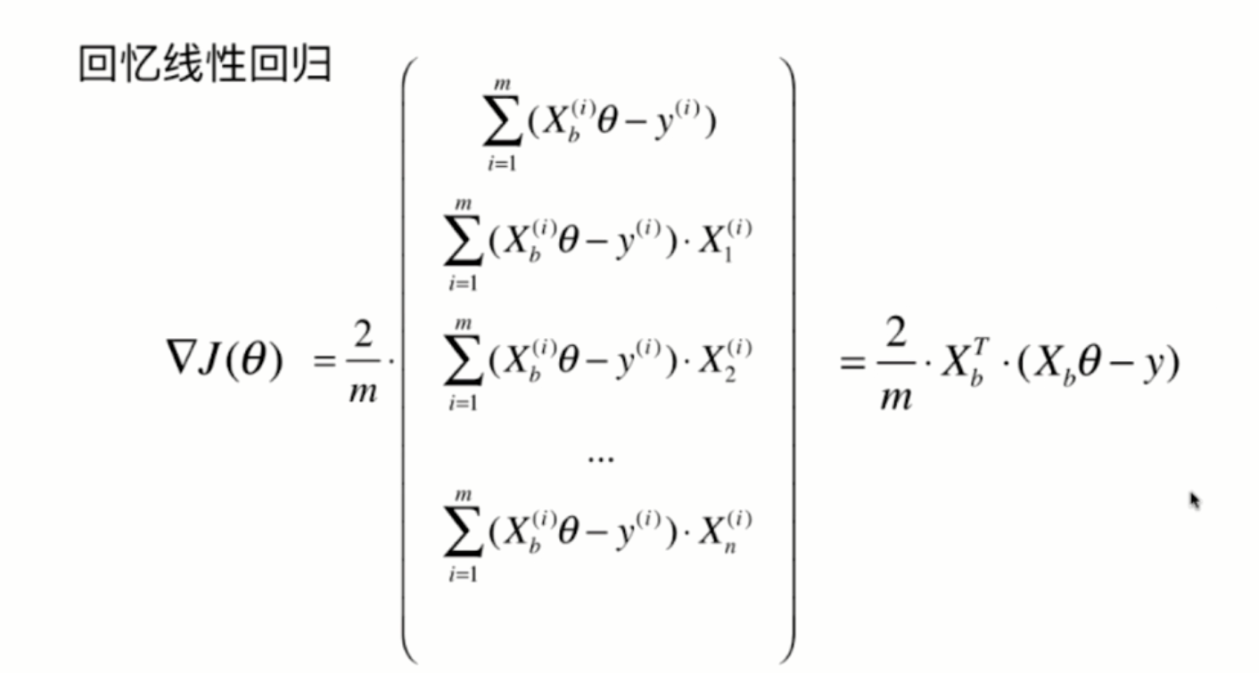
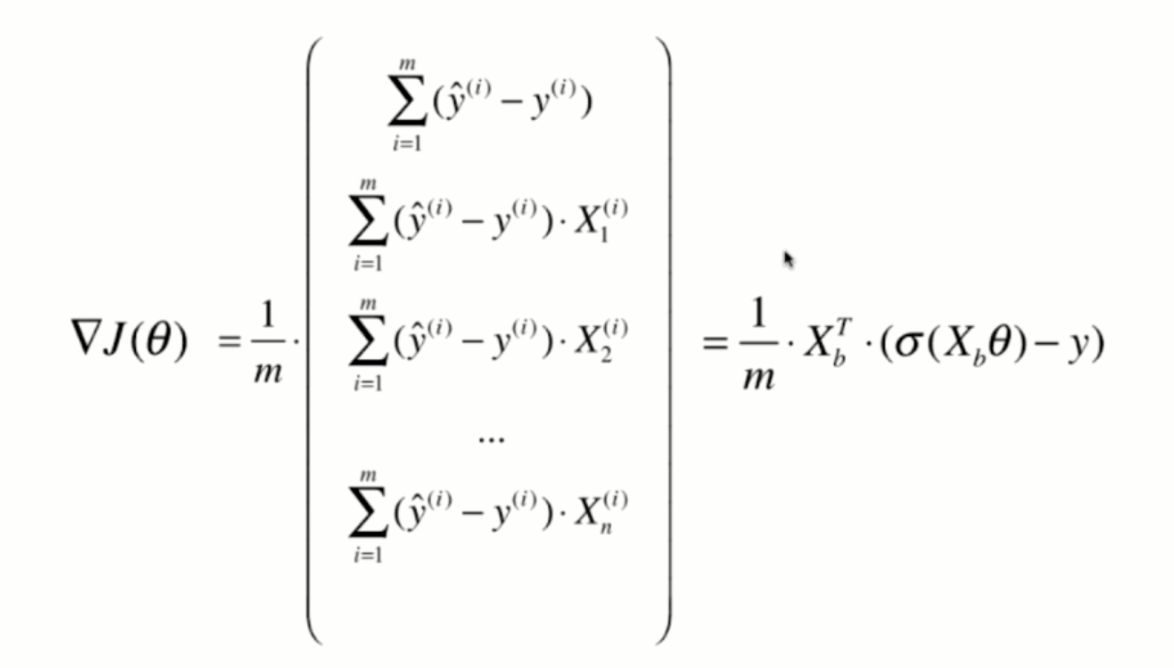
Derivation of loss function
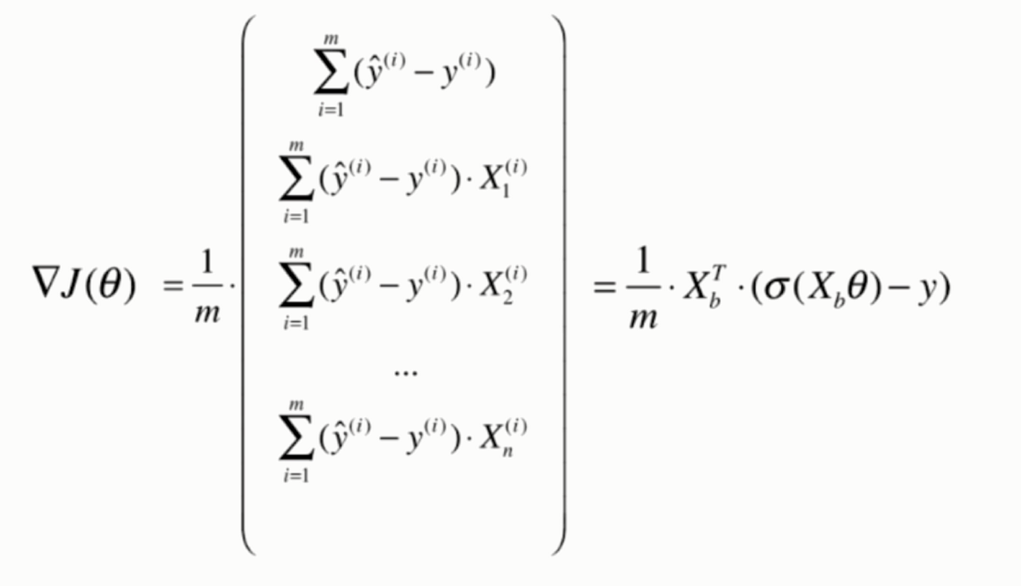
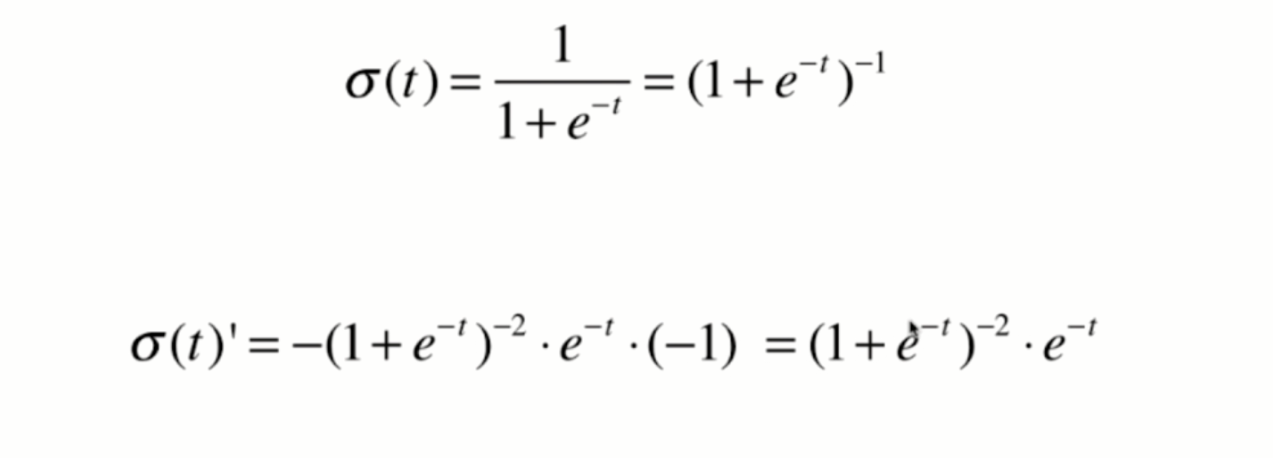
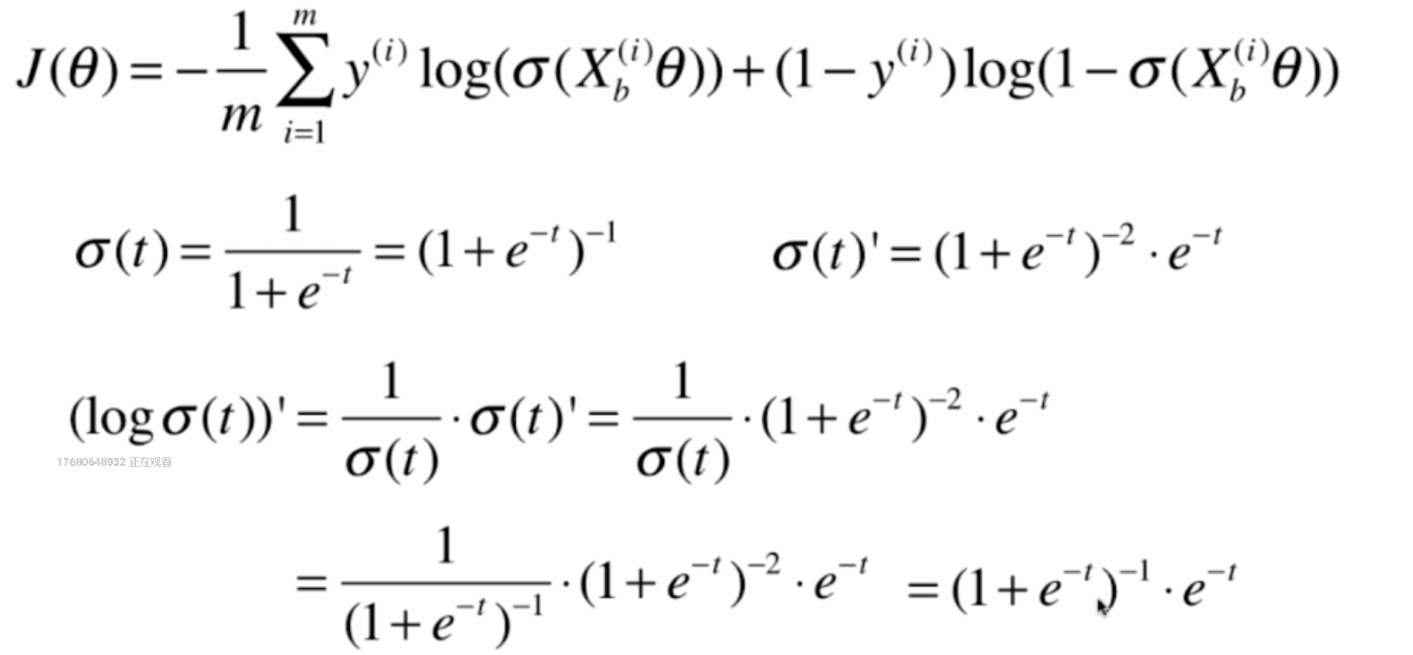
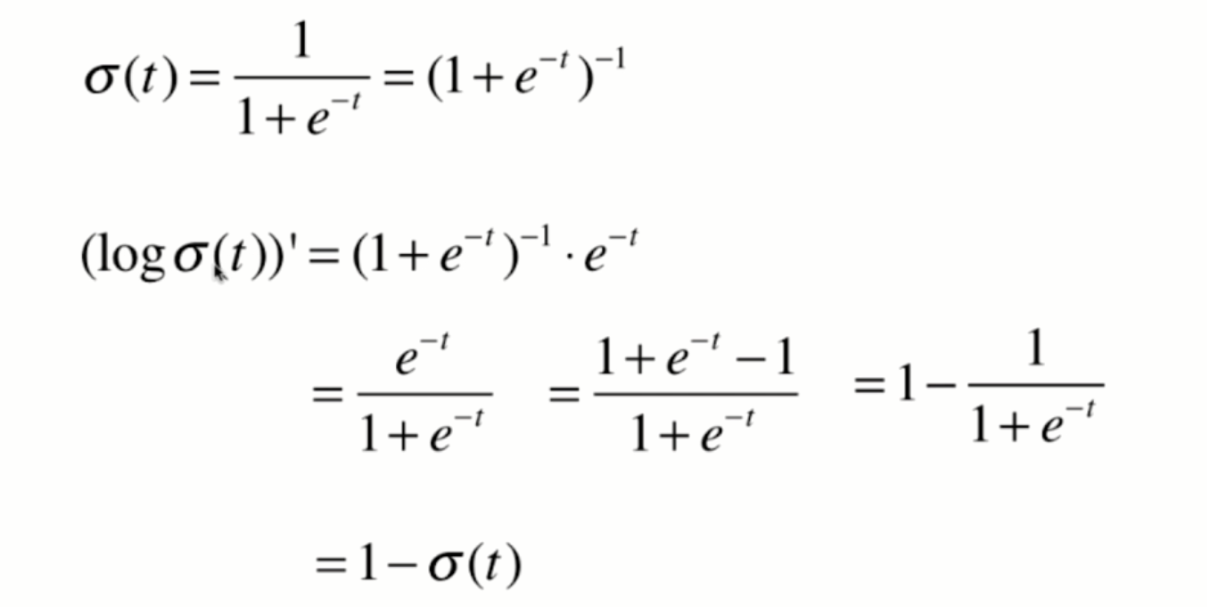
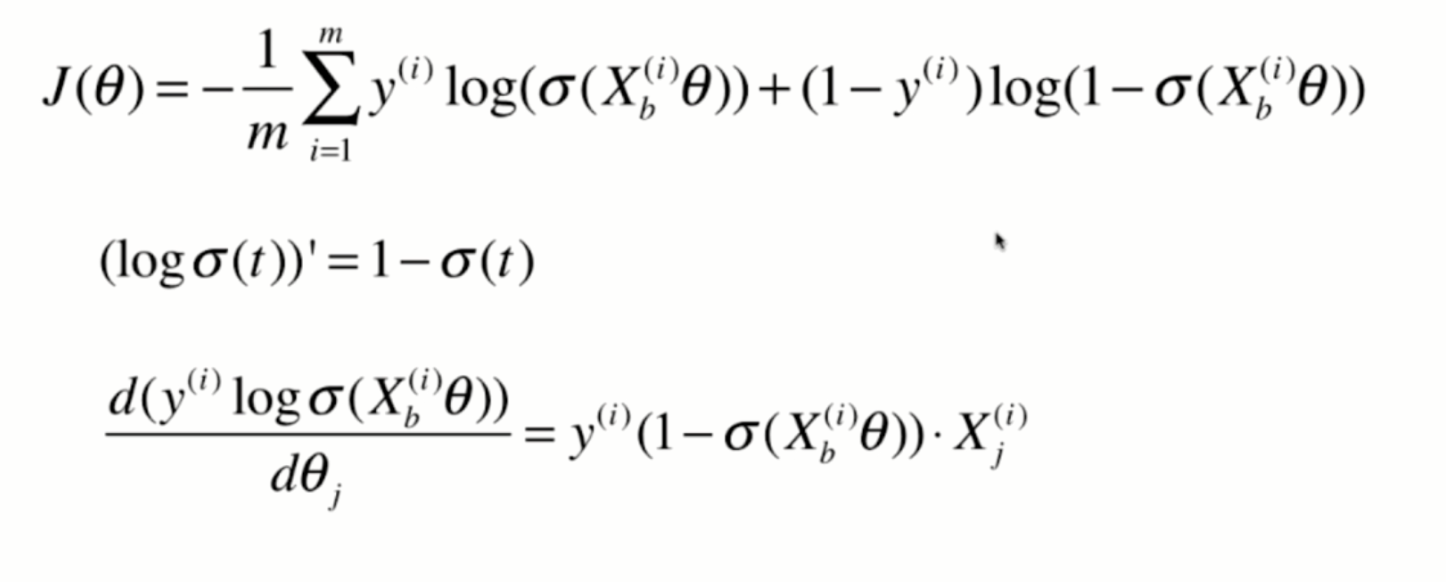
Derivation process
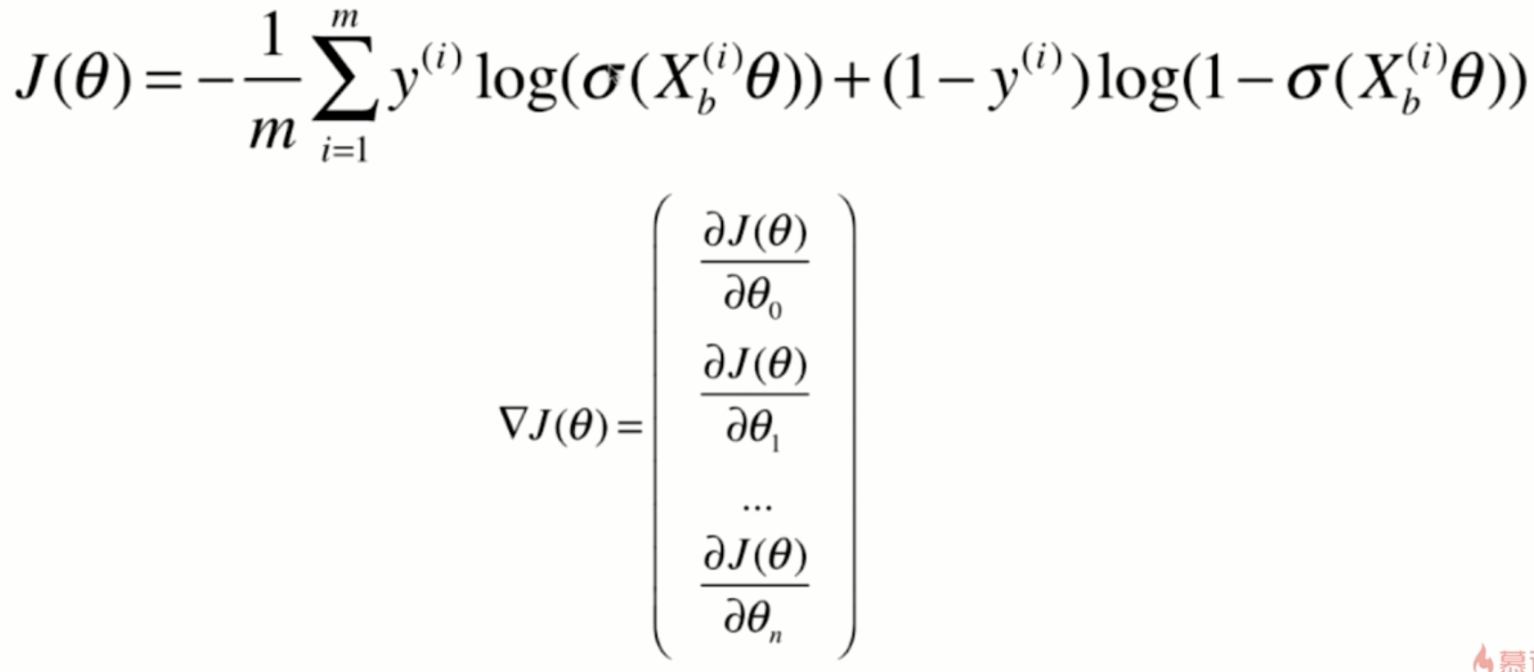
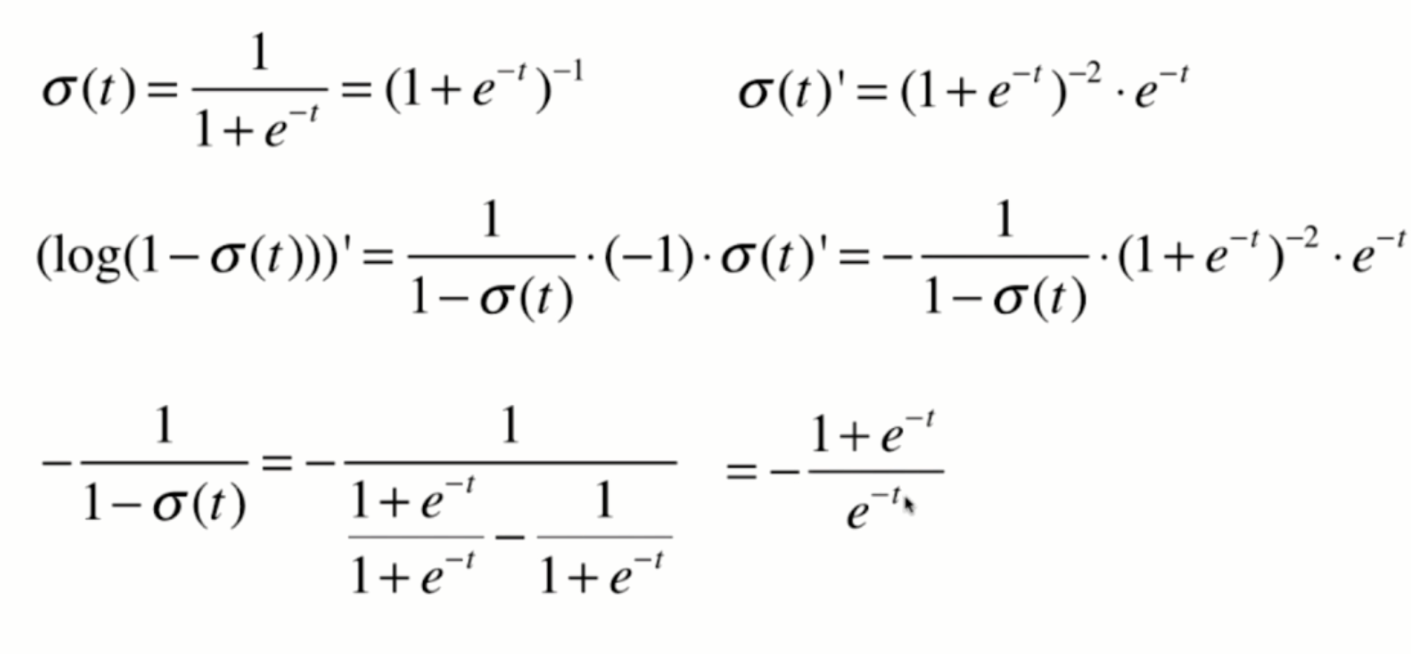
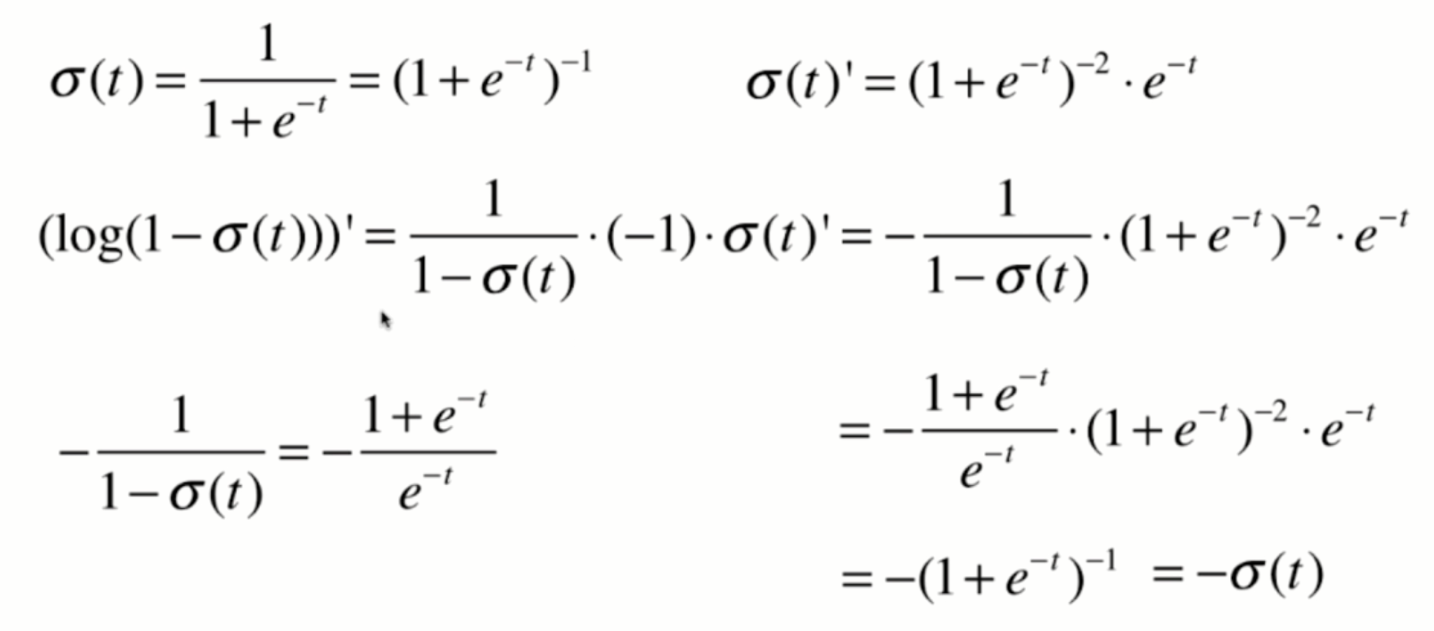
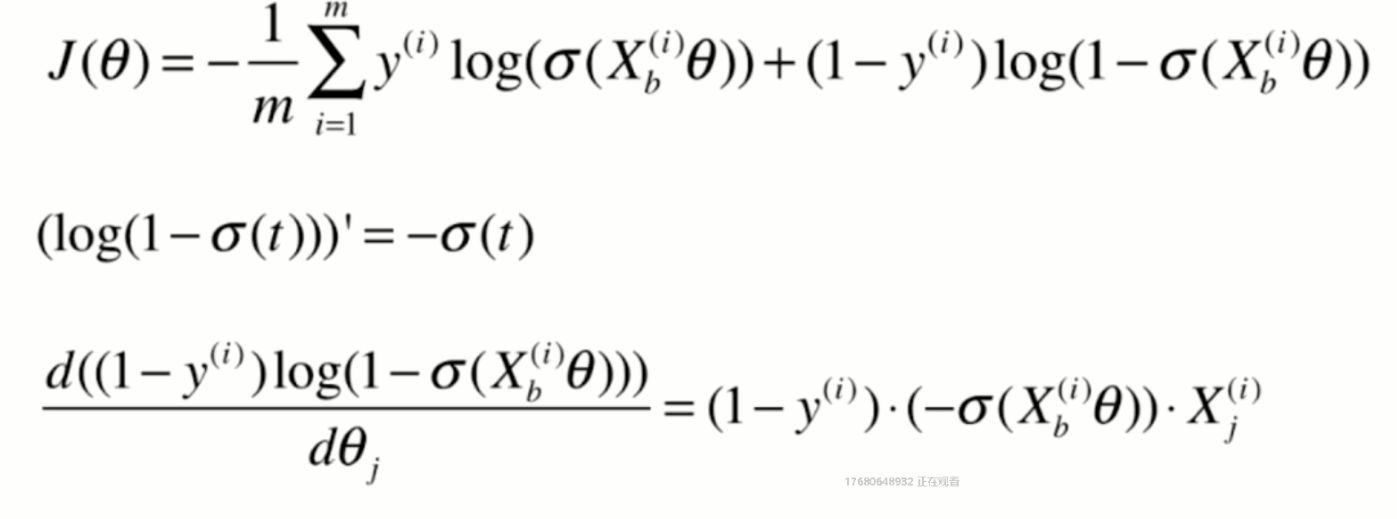
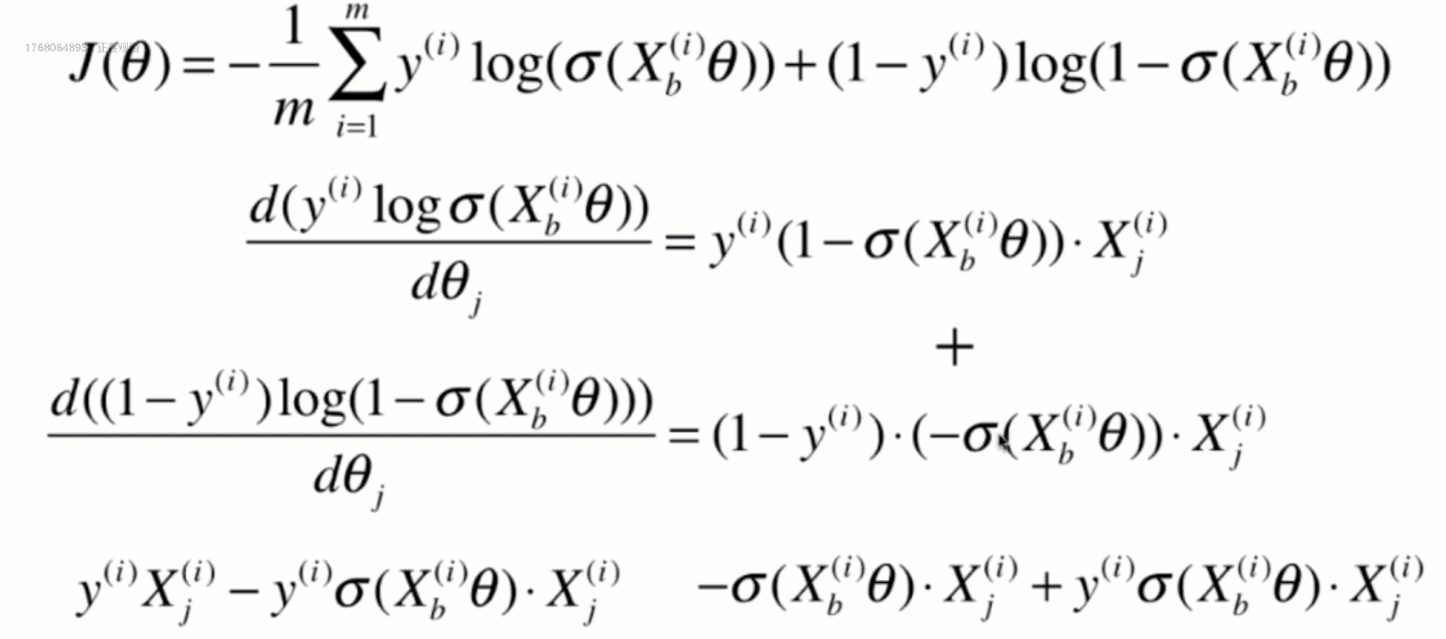
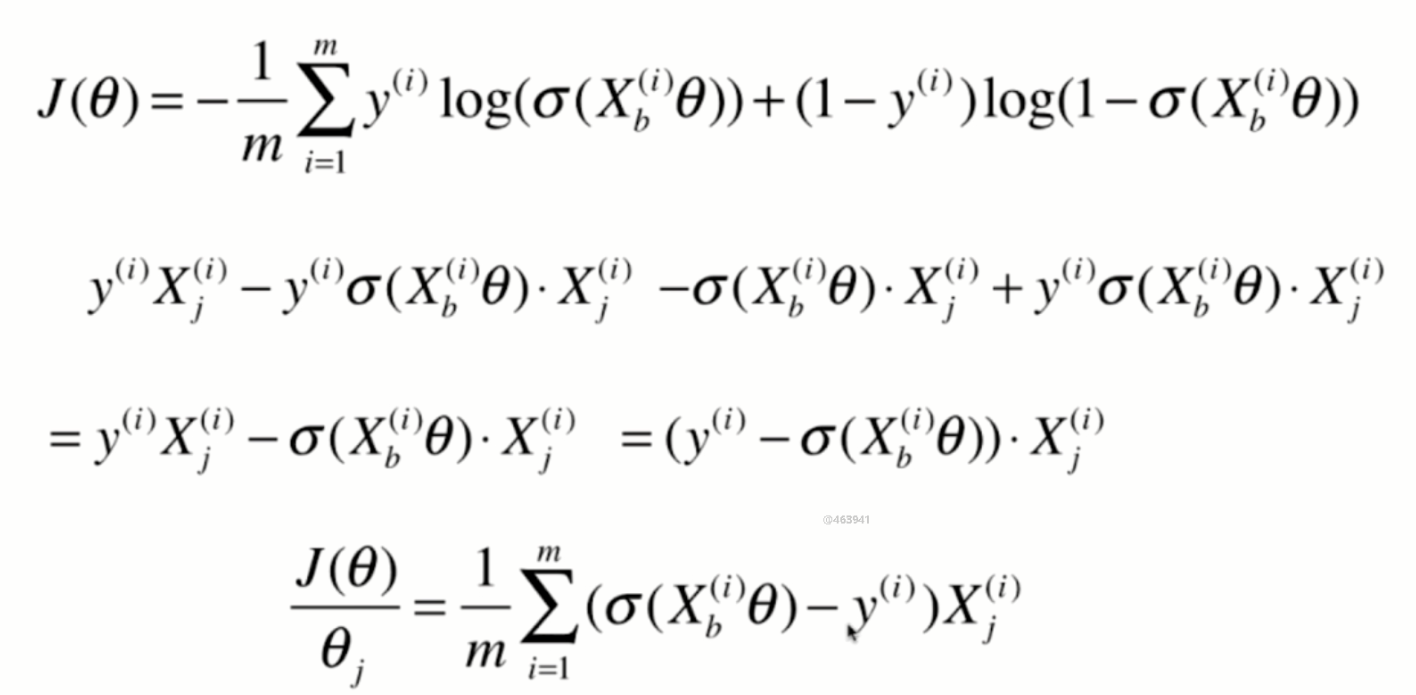
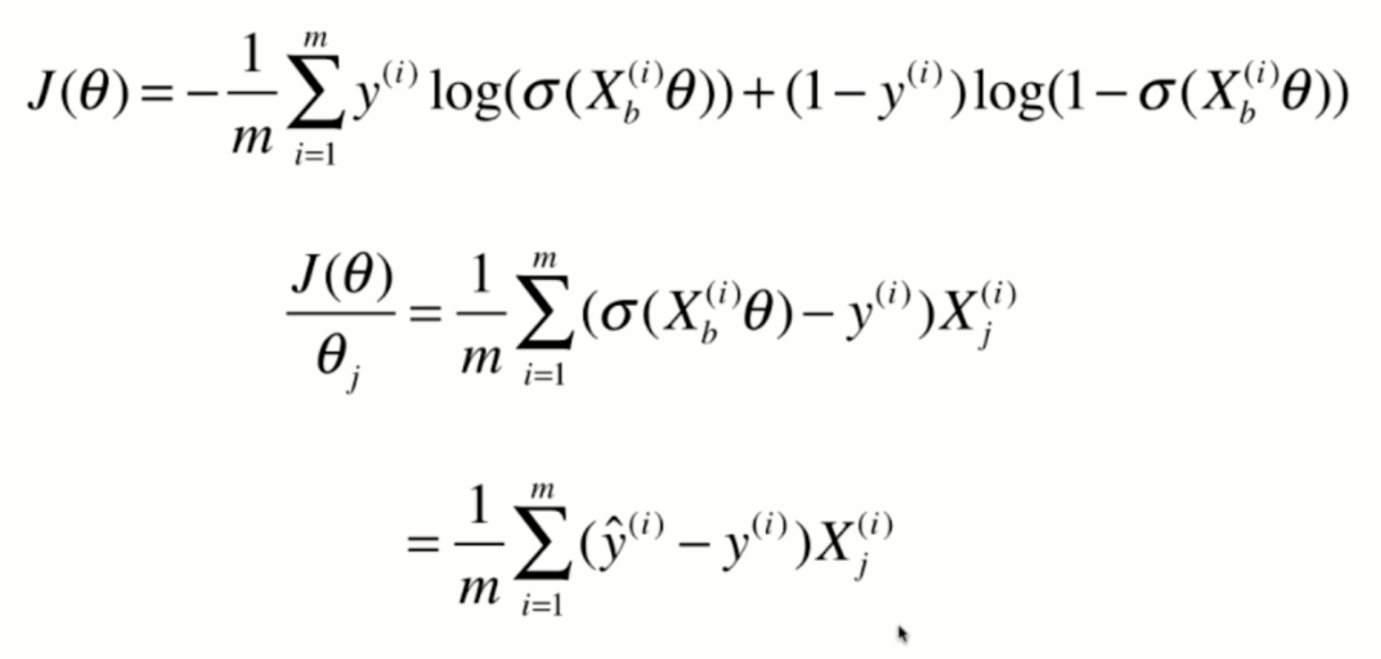
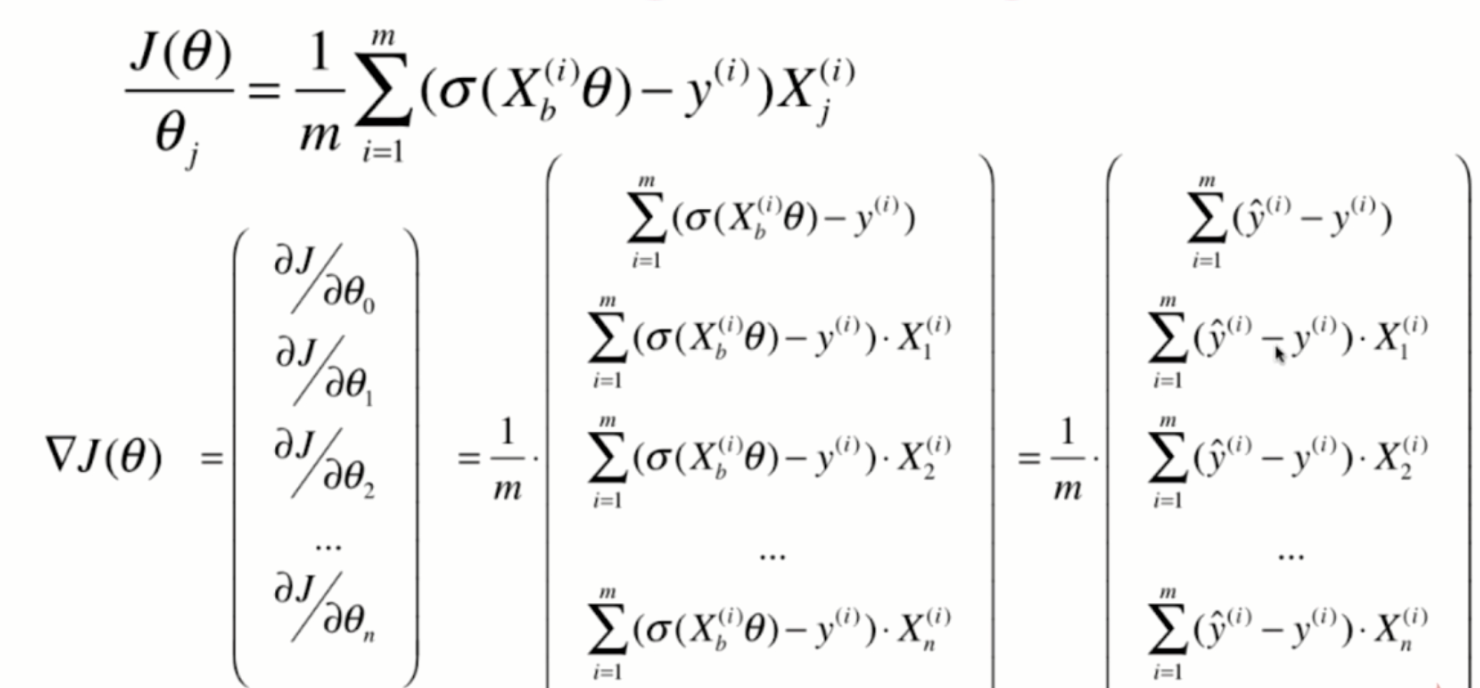
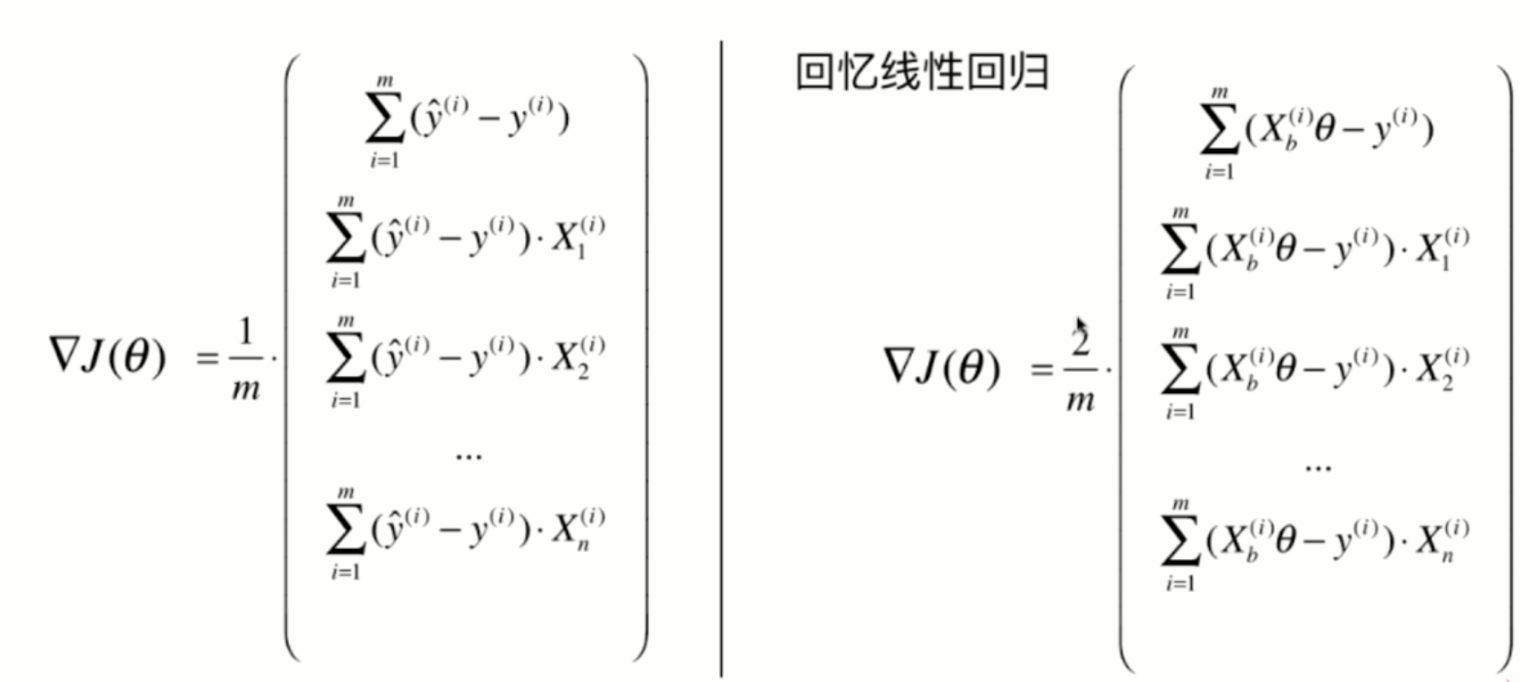
Vectorization:
Packaging Logistics model
Rewrite based on the class of linear regression previously implemented:
import numpy as np
from .metrics import accuracy_score

class LogisticRegression:

    def __init__(self):
        """initialization Logistic Regression Model"""
        self.coef_ = None
        self.intercept_ = None
        self._theta = None

    def _sigmoid(self, t):
        return 1. / (1. + np.exp(-t))

    def fit(self, X_train, y_train, eta=0.01, n_iters=1e4):
        """According to the training data set X_train, y_train, Training using gradient descent method Logistic Regression Model"""
        assert X_train.shape[0] == y_train.shape[0], \
            "the size of X_train must be equal to the size of y_train"

        def J(theta, X_b, y):
            y_hat = self._sigmoid(X_b.dot(theta))
            try:
                return - np.sum(y*np.log(y_hat) + (1-y)*np.log(1-y_hat)) / len(y)
            except:
                return float('inf')

        def dJ(theta, X_b, y):
            return X_b.T.dot(self._sigmoid(X_b.dot(theta)) - y) / len(y)

        def gradient_descent(X_b, y, initial_theta, eta, n_iters=1e4, epsilon=1e-8):

            theta = initial_theta
            cur_iter = 0

            while cur_iter < n_iters:
                gradient = dJ(theta, X_b, y)
                last_theta = theta
                theta = theta - eta * gradient
                if (abs(J(theta, X_b, y) - J(last_theta, X_b, y)) < epsilon):
                    break

                cur_iter += 1

            return theta

        X_b = np.hstack([np.ones((len(X_train), 1)), X_train])
        initial_theta = np.zeros(X_b.shape[1])
        self._theta = gradient_descent(X_b, y_train, initial_theta, eta, n_iters)

        self.intercept_ = self._theta[0]
        self.coef_ = self._theta[1:]

        return self

    def predict_proba(self, X_predict):
        """Given data set to be predicted X_predict,Return representation X_predict Result probability vector"""
        assert self.intercept_ is not None and self.coef_ is not None, \
            "must fit before predict!"
        assert X_predict.shape[1] == len(self.coef_), \
            "the feature number of X_predict must be equal to X_train"

        X_b = np.hstack([np.ones((len(X_predict), 1)), X_predict])
        return self._sigmoid(X_b.dot(self._theta))

    def predict(self, X_predict):
        """Given data set to be predicted X_predict,Return representation X_predict Result vector of"""
        assert self.intercept_ is not None and self.coef_ is not None, \
            "must fit before predict!"
        assert X_predict.shape[1] == len(self.coef_), \
            "the feature number of X_predict must be equal to X_train"

        proba = self.predict_proba(X_predict)
        return np.array(proba >= 0.5, dtype='int')

    def score(self, X_test, y_test):
        """According to the test data set X_test and y_test Determines the accuracy of the current model"""

        y_predict = self.predict(X_test)
        return accuracy_score(y_test, y_predict)

    def __repr__(self):
        return "LogisticRegression()"
Realize logical regression
import numpy as np
import matplotlib.pyplot as plt
from sklearn import datasets

iris = datasets.load_iris()
X = iris.data
y = iris.target
X = X[y<2,:2]
y = y[y<2]
X.shape
(100, 2)
y.shape
(100,)
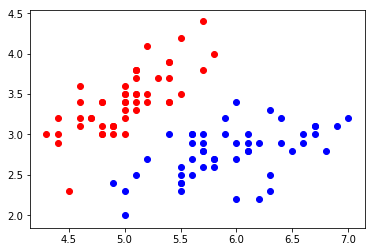
plt.scatter(X[y==0,0], X[y==0,1], color="red")
plt.scatter(X[y==1,0], X[y==1,1], color="blue")
plt.show()
Using logistic regression
from playML.model_selection import train_test_split

X_train, X_test, y_train, y_test = train_test_split(X, y, seed=666)
from playML.LogisticRegression import LogisticRegression

log_reg = LogisticRegression()
log_reg.fit(X_train, y_train)
LogisticRegression()
log_reg.score(X_test, y_test)
1.0
log_reg.predict_proba(X_test)
array([ 0.92972035,  0.98664939,  0.14852024,  0.17601199,  0.0369836 ,
        0.0186637 ,  0.04936918,  0.99669244,  0.97993941,  0.74524655,
        0.04473194,  0.00339285,  0.26131273,  0.0369836 ,  0.84192923,
        0.79892262,  0.82890209,  0.32358166,  0.06535323,  0.20735334])
log_reg.predict(X_test)
array([1, 1, 0, 0, 0, 0, 0, 1, 1, 1, 0, 0, 0, 0, 1, 1, 1, 0, 0, 0])
y_test
array([1, 1, 0, 0, 0, 0, 0, 1, 1, 1, 0, 0, 0, 0, 1, 1, 1, 0, 0, 0])
Decision boundary
import numpy as np
import matplotlib.pyplot as plt
from sklearn import datasets

iris = datasets.load_iris()

X = iris.data
y = iris.target

X = X[y<2,:2]
y = y[y<2]
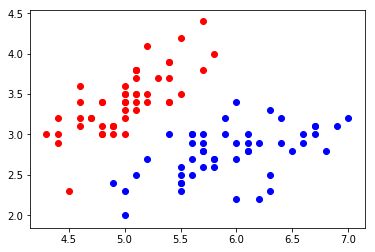
plt.scatter(X[y==0,0], X[y==0,1], color="red")
plt.scatter(X[y==1,0], X[y==1,1], color="blue")
plt.show()
from playML.model_selection import train_test_split

X_train, X_test, y_train, y_test = train_test_split(X, y, seed=666)
from playML.LogisticRegression import LogisticRegression

log_reg = LogisticRegression()
log_reg.fit(X_train, y_train)
LogisticRegression()
log_reg.coef_
array([ 3.01796521, -5.04447145])
log_reg.intercept_
-0.6937719272911228
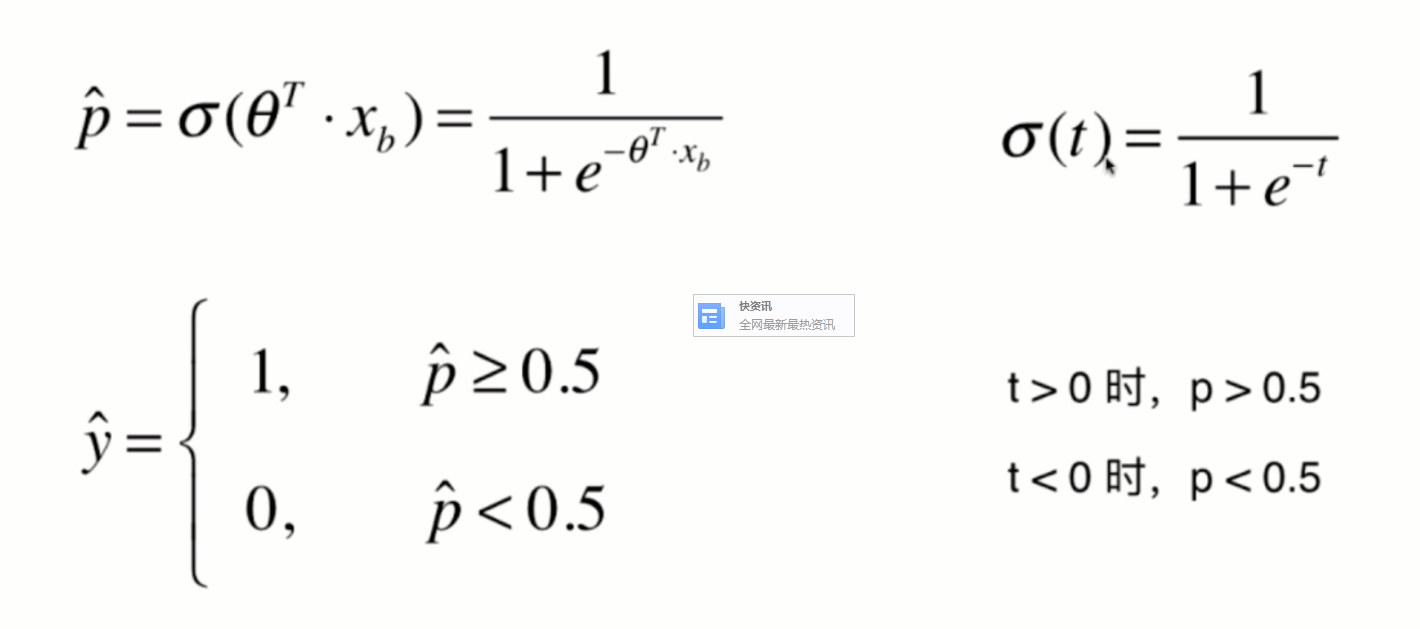
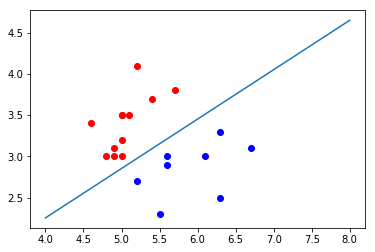
In logistic regression, the easy decision boundary is theta * X_ Straight line with B = 0
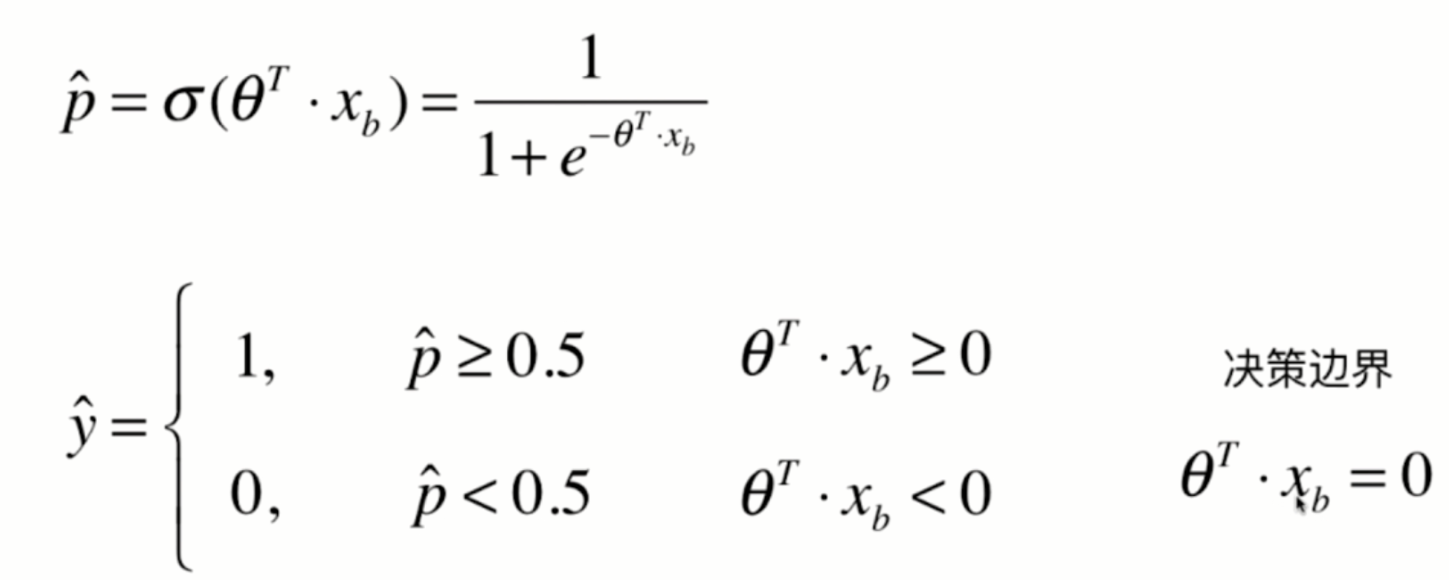
If there are only two eigenvalues, it is easy to draw the decision boundary of logistic regression through the formula
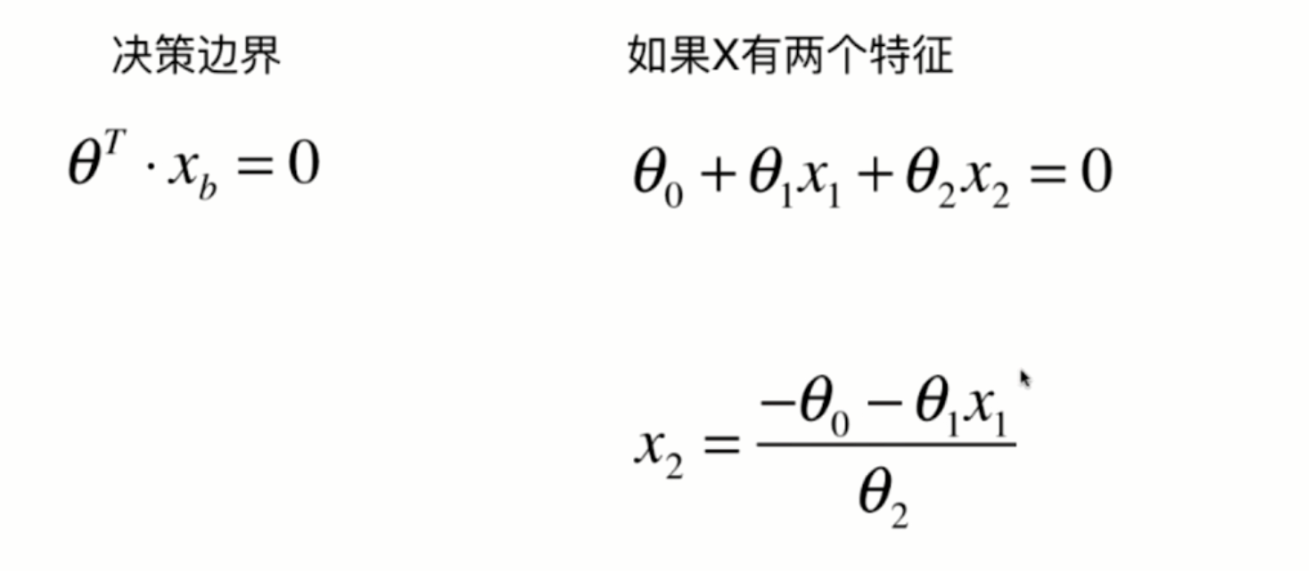
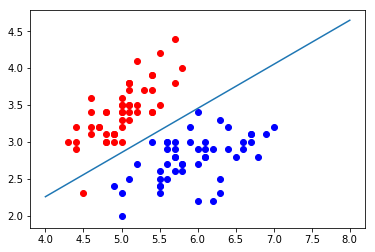
def x2(x1):
    return (-log_reg.coef_[0] * x1 - log_reg.intercept_) / log_reg.coef_[1]
x1_plot = np.linspace(4, 8, 1000)
x2_plot = x2(x1_plot)
plt.scatter(X[y==0,0], X[y==0,1], color="red")
plt.scatter(X[y==1,0], X[y==1,1], color="blue")
plt.plot(x1_plot, x2_plot)
plt.show()
plt.scatter(X_test[y_test==0,0], X_test[y_test==0,1], color="red")
plt.scatter(X_test[y_test==1,0], X_test[y_test==1,1], color="blue")
plt.plot(x1_plot, x2_plot)
plt.show()
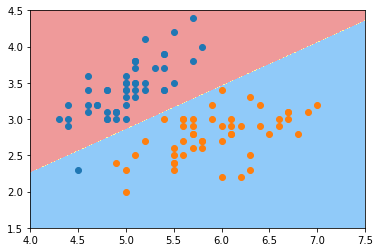
Drawing of irregular decision boundary

def plot_decision_boundary(model, axis):
    # Mesh grid matrix
    x0, x1 = np.meshgrid(
        np.linspace(axis[0], axis[1], int((axis[1]-axis[0])*100)).reshape(-1, 1),
        np.linspace(axis[2], axis[3], int((axis[3]-axis[2])*100)).reshape(-1, 1),
    )
  #  np.c_  Row splicing, and the high-dimensional matrix of travel () is tiled and reduced to one dimension
    X_new = np.c_[x0.ravel(), x1.ravel()]

    y_predict = model.predict(X_new)
    zz = y_predict.reshape(x0.shape)

    from matplotlib.colors import ListedColormap
    custom_cmap = ListedColormap(['#EF9A9A','#FFF59D','#90CAF9'])

    plt.contourf(x0, x1, zz, linewidth=5, cmap=custom_cmap)

plot_decision_boundary(log_reg, axis=[4, 7.5, 1.5, 4.5])
plt.scatter(X[y==0,0], X[y==0,1])
plt.scatter(X[y==1,0], X[y==1,1])
plt.show()
Decision boundary of kNN
from sklearn.neighbors import KNeighborsClassifier

knn_clf = KNeighborsClassifier()
knn_clf.fit(X_train, y_train)
KNeighborsClassifier(algorithm='auto', leaf_size=30, metric='minkowski',
           metric_params=None, n_jobs=1, n_neighbors=5, p=2,
           weights='uniform')
knn_clf.score(X_test, y_test)
1.0
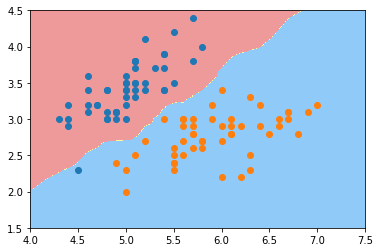
plot_decision_boundary(knn_clf, axis=[4, 7.5, 1.5, 4.5])
plt.scatter(X[y==0,0], X[y==0,1])
plt.scatter(X[y==1,0], X[y==1,1])
plt.show()
knn_clf_all = KNeighborsClassifier()
knn_clf_all.fit(iris.data[:,:2], iris.target)
KNeighborsClassifier(algorithm='auto', leaf_size=30, metric='minkowski',
           metric_params=None, n_jobs=1, n_neighbors=5, p=2,
           weights='uniform')
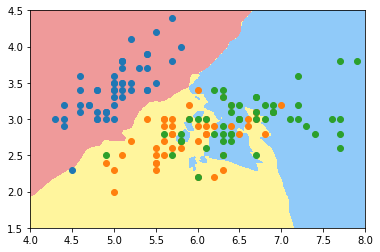
plot_decision_boundary(knn_clf_all, axis=[4, 8, 1.5, 4.5])
plt.scatter(iris.data[iris.target==0,0], iris.data[iris.target==0,1])
plt.scatter(iris.data[iris.target==1,0], iris.data[iris.target==1,1])
plt.scatter(iris.data[iris.target==2,0], iris.data[iris.target==2,1])
plt.show()
knn_clf_all = KNeighborsClassifier(n_neighbors=50)
knn_clf_all.fit(iris.data[:,:2], iris.target)

plot_decision_boundary(knn_clf_all, axis=[4, 8, 1.5, 4.5])
plt.scatter(iris.data[iris.target==0,0], iris.data[iris.target==0,1])
plt.scatter(iris.data[iris.target==1,0], iris.data[iris.target==1,1])
plt.scatter(iris.data[iris.target==2,0], iris.data[iris.target==2,1])
plt.show()
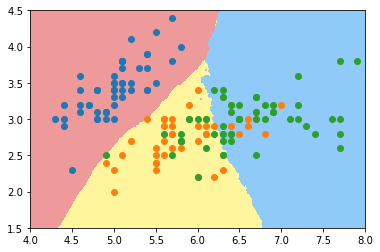
Application of polynomial features to logistic regression
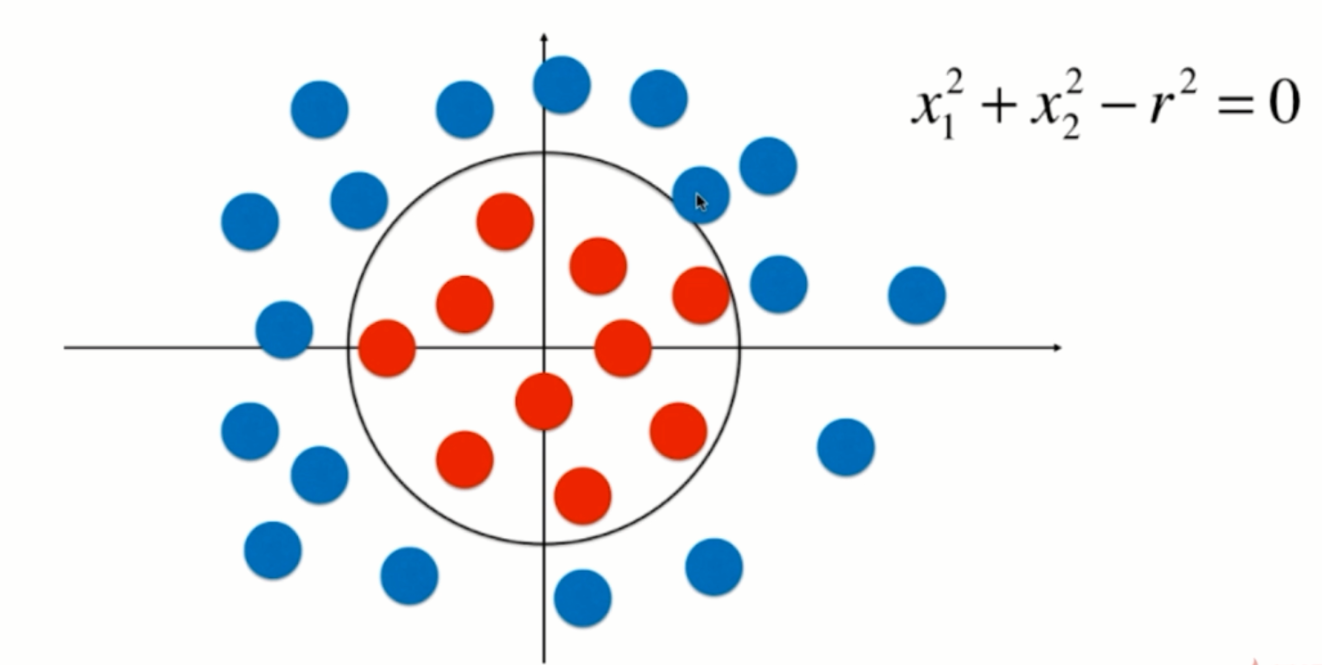
Adding polynomial features to logistic regression
import numpy as np
import matplotlib.pyplot as plt

np.random.seed(666)
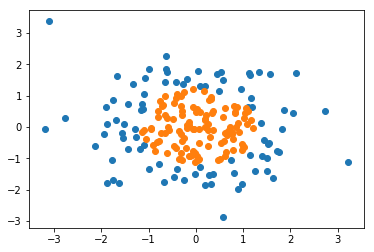
X = np.random.normal(0, 1, size=(200, 2))
y = np.array((X[:,0]**2+X[:,1]**2)<1.5, dtype='int')
plt.scatter(X[y==0,0], X[y==0,1])
plt.scatter(X[y==1,0], X[y==1,1])
plt.show()
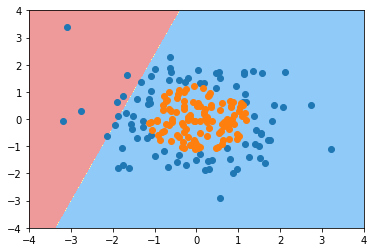
Using logistic regression
from playML.LogisticRegression import LogisticRegression
log_reg = LogisticRegression()
log_reg.fit(X, y)
LogisticRegression()
log_reg.score(X, y)
0.60499999999999998
def plot_decision_boundary(model, axis):

    x0, x1 = np.meshgrid(
        np.linspace(axis[0], axis[1], int((axis[1]-axis[0])*100)).reshape(-1, 1),
        np.linspace(axis[2], axis[3], int((axis[3]-axis[2])*100)).reshape(-1, 1),
    )
    X_new = np.c_[x0.ravel(), x1.ravel()]

    y_predict = model.predict(X_new)
    zz = y_predict.reshape(x0.shape)

    from matplotlib.colors import ListedColormap
    custom_cmap = ListedColormap(['#EF9A9A','#FFF59D','#90CAF9'])

    plt.contourf(x0, x1, zz, linewidth=5, cmap=custom_cmap)
plot_decision_boundary(log_reg, axis=[-4, 4, -4, 4])
plt.scatter(X[y==0,0], X[y==0,1])
plt.scatter(X[y==1,0], X[y==1,1])
plt.show()
from sklearn.preprocessing import PolynomialFeatures
from sklearn.pipeline import Pipeline
from sklearn.preprocessing import StandardScaler

def PolynomialLogisticRegression(degree):
    return Pipeline([
        ('poly', PolynomialFeatures(degree=degree)),
        ('std_scaler', StandardScaler()),
        ('log_reg', LogisticRegression())
    ])
poly_log_reg = PolynomialLogisticRegression(degree=2)
poly_log_reg.fit(X, y)
Pipeline(steps=[('poly', PolynomialFeatures(degree=2, include_bias=True, interaction_only=False)), ('std_scaler', StandardScaler(copy=True, with_mean=True, with_std=True)), ('log_reg', LogisticRegression())])
poly_log_reg.score(X, y)
0.94999999999999996
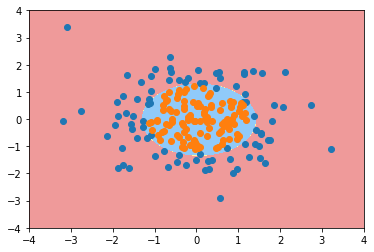
plot_decision_boundary(poly_log_reg, axis=[-4, 4, -4, 4])
plt.scatter(X[y==0,0], X[y==0,1])
plt.scatter(X[y==1,0], X[y==1,1])
plt.show()
poly_log_reg2 = PolynomialLogisticRegression(degree=20)
poly_log_reg2.fit(X, y)
Pipeline(steps=[('poly', PolynomialFeatures(degree=20, include_bias=True, interaction_only=False)), ('std_scaler', StandardScaler(copy=True, with_mean=True, with_std=True)), ('log_reg', LogisticRegression())])
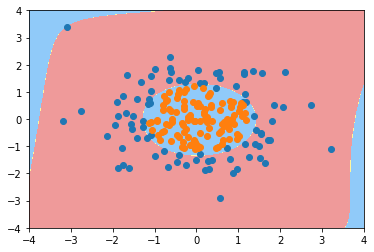
plot_decision_boundary(poly_log_reg2, axis=[-4, 4, -4, 4])
plt.scatter(X[y==0,0], X[y==0,1])
plt.scatter(X[y==1,0], X[y==1,1])
plt.show()
Regularization of logistic regression model
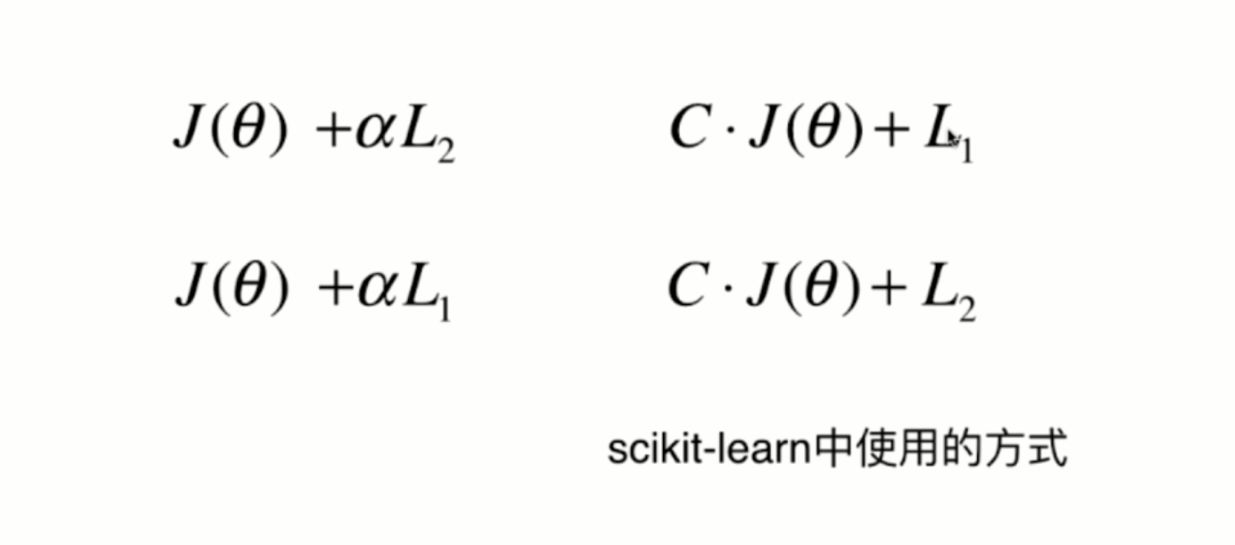
Logistic regression in scikit learn
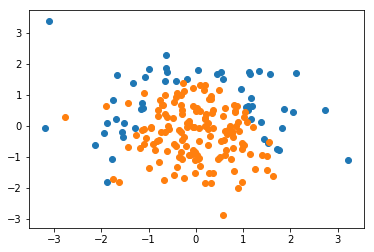
import numpy as np
import matplotlib.pyplot as plt

np.random.seed(666)
X = np.random.normal(0, 1, size=(200, 2))
y = np.array((X[:,0]**2+X[:,1])<1.5, dtype='int')
for _ in range(20):
    y[np.random.randint(200)] = 1
plt.scatter(X[y==0,0], X[y==0,1])
plt.scatter(X[y==1,0], X[y==1,1])
plt.show()
from sklearn.model_selection import train_test_split

X_train, X_test, y_train, y_test = train_test_split(X, y, random_state=666)
Using logistic regression in scikit learn
from sklearn.linear_model import LogisticRegression

log_reg = LogisticRegression()
log_reg.fit(X_train, y_train)
LogisticRegression(C=1.0, class_weight=None, dual=False, fit_intercept=True,
          intercept_scaling=1, max_iter=100, multi_class='ovr', n_jobs=1,
          penalty='l2', random_state=None, solver='liblinear', tol=0.0001,
          verbose=0, warm_start=False)
log_reg.score(X_train, y_train)
0.79333333333333333
log_reg.score(X_test, y_test)
0.85999999999999999
def plot_decision_boundary(model, axis):

    x0, x1 = np.meshgrid(
        np.linspace(axis[0], axis[1], int((axis[1]-axis[0])*100)).reshape(-1, 1),
        np.linspace(axis[2], axis[3], int((axis[3]-axis[2])*100)).reshape(-1, 1),
    )
    X_new = np.c_[x0.ravel(), x1.ravel()]

    y_predict = model.predict(X_new)
    zz = y_predict.reshape(x0.shape)

    from matplotlib.colors import ListedColormap
    custom_cmap = ListedColormap(['#EF9A9A','#FFF59D','#90CAF9'])

    plt.contourf(x0, x1, zz, linewidth=5, cmap=custom_cmap)
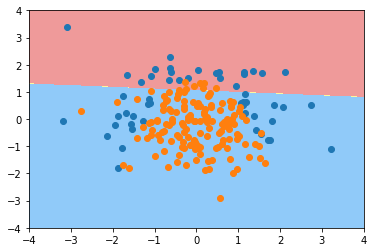
plot_decision_boundary(log_reg, axis=[-4, 4, -4, 4])
plt.scatter(X[y==0,0], X[y==0,1])
plt.scatter(X[y==1,0], X[y==1,1])
plt.show()
from sklearn.preprocessing import PolynomialFeatures
from sklearn.pipeline import Pipeline
from sklearn.preprocessing import StandardScaler

def PolynomialLogisticRegression(degree):
    return Pipeline([
        ('poly', PolynomialFeatures(degree=degree)),
        ('std_scaler', StandardScaler()),
        ('log_reg', LogisticRegression())
    ])
poly_log_reg = PolynomialLogisticRegression(degree=2)
poly_log_reg.fit(X_train, y_train)
Pipeline(steps=[('poly', PolynomialFeatures(degree=2, include_bias=True, interaction_only=False)), ('std_scaler', StandardScaler(copy=True, with_mean=True, with_std=True)), ('log_reg', LogisticRegression(C=1.0, class_weight=None, dual=False, fit_intercept=True,
          intercept_scaling=1, max_iter=100, multi_class='ovr', n_jobs=1,
          penalty='l2', random_state=None, solver='liblinear', tol=0.0001,
          verbose=0, warm_start=False))])
poly_log_reg.score(X_train, y_train)
0.91333333333333333
poly_log_reg.score(X_test, y_test)
0.93999999999999995
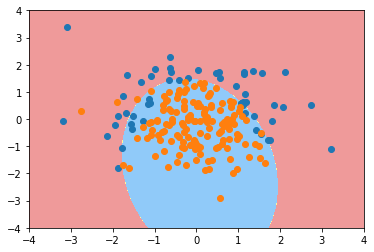
plot_decision_boundary(poly_log_reg, axis=[-4, 4, -4, 4])
plt.scatter(X[y==0,0], X[y==0,1])
plt.scatter(X[y==1,0], X[y==1,1])
plt.show()
poly_log_reg2 = PolynomialLogisticRegression(degree=20)
poly_log_reg2.fit(X_train, y_train)
Pipeline(steps=[('poly', PolynomialFeatures(degree=20, include_bias=True, interaction_only=False)), ('std_scaler', StandardScaler(copy=True, with_mean=True, with_std=True)), ('log_reg', LogisticRegression(C=1.0, class_weight=None, dual=False, fit_intercept=True,
          intercept_scaling=1, max_iter=100, multi_class='ovr', n_jobs=1,
          penalty='l2', random_state=None, solver='liblinear', tol=0.0001,
          verbose=0, warm_start=False))])
poly_log_reg2.score(X_train, y_train)
0.93999999999999995
poly_log_reg2.score(X_test, y_test)
0.92000000000000004
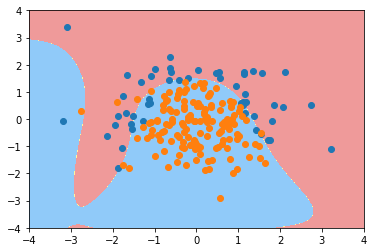
plot_decision_boundary(poly_log_reg2, axis=[-4, 4, -4, 4])
plt.scatter(X[y==0,0], X[y==0,1])
plt.scatter(X[y==1,0], X[y==1,1])
plt.show()
def PolynomialLogisticRegression(degree, C):
    return Pipeline([
        ('poly', PolynomialFeatures(degree=degree)),
        ('std_scaler', StandardScaler()),
        ('log_reg', LogisticRegression(C=C))
    ])

poly_log_reg3 = PolynomialLogisticRegression(degree=20, C=0.1)
poly_log_reg3.fit(X_train, y_train)
Pipeline(steps=[('poly', PolynomialFeatures(degree=20, include_bias=True, interaction_only=False)), ('std_scaler', StandardScaler(copy=True, with_mean=True, with_std=True)), ('log_reg', LogisticRegression(C=0.1, class_weight=None, dual=False, fit_intercept=True,
          intercept_scaling=1, max_iter=100, multi_class='ovr', n_jobs=1,
          penalty='l2', random_state=None, solver='liblinear', tol=0.0001,
          verbose=0, warm_start=False))])
poly_log_reg3.score(X_train, y_train)
0.85333333333333339
poly_log_reg3.score(X_test, y_test)
0.92000000000000004
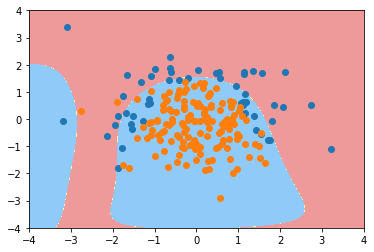
plot_decision_boundary(poly_log_reg3, axis=[-4, 4, -4, 4])
plt.scatter(X[y==0,0], X[y==0,1])
plt.scatter(X[y==1,0], X[y==1,1])
plt.show()
def PolynomialLogisticRegression(degree, C, penalty='l2'):
    return Pipeline([
        ('poly', PolynomialFeatures(degree=degree)),
        ('std_scaler', StandardScaler()),
        ('log_reg', LogisticRegression(C=C, penalty=penalty))
    ])

poly_log_reg4 = PolynomialLogisticRegression(degree=20, C=0.1, penalty='l1')
poly_log_reg4.fit(X_train, y_train)
Pipeline(steps=[('poly', PolynomialFeatures(degree=20, include_bias=True, interaction_only=False)), ('std_scaler', StandardScaler(copy=True, with_mean=True, with_std=True)), ('log_reg', LogisticRegression(C=0.1, class_weight=None, dual=False, fit_intercept=True,
          intercept_scaling=1, max_iter=100, multi_class='ovr', n_jobs=1,
          penalty='l1', random_state=None, solver='liblinear', tol=0.0001,
          verbose=0, warm_start=False))])
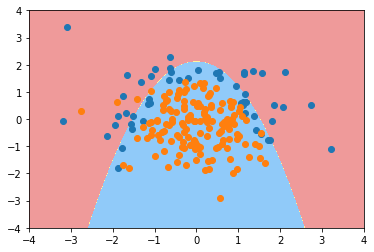
poly_log_reg4.score(X_train, y_train)
0.82666666666666666
poly_log_reg4.score(X_test, y_test)
0.90000000000000002
plot_decision_boundary(poly_log_reg4, axis=[-4, 4, -4, 4])
plt.scatter(X[y==0,0], X[y==0,1])
plt.scatter(X[y==1,0], X[y==1,1])
plt.show()
Using logistic regression to solve multi classification problems



OvR and OvO
import numpy as np
import matplotlib.pyplot as plt
from sklearn import datasets

iris = datasets.load_iris()
X = iris.data[:,:2]
y = iris.target
from sklearn.model_selection import train_test_split

X_train, X_test, y_train, y_test = train_test_split(X, y, random_state=666)
from sklearn.linear_model import LogisticRegression

log_reg = LogisticRegression()
log_reg.fit(X_train, y_train)
LogisticRegression(C=1.0, class_weight=None, dual=False, fit_intercept=True,
          intercept_scaling=1, max_iter=100, multi_class='ovr', n_jobs=1,
          penalty='l2', random_state=None, solver='liblinear', tol=0.0001,
          verbose=0, warm_start=False)
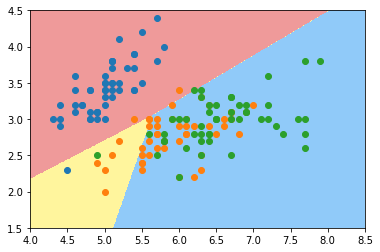
log_reg.score(X_test, y_test)
0.65789473684210531
def plot_decision_boundary(model, axis):

    x0, x1 = np.meshgrid(
        np.linspace(axis[0], axis[1], int((axis[1]-axis[0])*100)).reshape(-1, 1),
        np.linspace(axis[2], axis[3], int((axis[3]-axis[2])*100)).reshape(-1, 1),
    )
    X_new = np.c_[x0.ravel(), x1.ravel()]

    y_predict = model.predict(X_new)
    zz = y_predict.reshape(x0.shape)

    from matplotlib.colors import ListedColormap
    custom_cmap = ListedColormap(['#EF9A9A','#FFF59D','#90CAF9'])

    plt.contourf(x0, x1, zz, linewidth=5, cmap=custom_cmap)
plot_decision_boundary(log_reg, axis=[4, 8.5, 1.5, 4.5])
plt.scatter(X[y==0,0], X[y==0,1])
plt.scatter(X[y==1,0], X[y==1,1])
plt.scatter(X[y==2,0], X[y==2,1])
plt.show()
log_reg2 = LogisticRegression(multi_class="multinomial", solver="newton-cg")
log_reg2.fit(X_train, y_train)
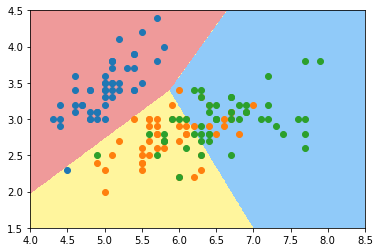
log_reg2.score(X_test, y_test)
0.78947368421052633
plot_decision_boundary(log_reg2, axis=[4, 8.5, 1.5, 4.5])
plt.scatter(X[y==0,0], X[y==0,1])
plt.scatter(X[y==1,0], X[y==1,1])
plt.scatter(X[y==2,0], X[y==2,1])
plt.show()
Use all data
X = iris.data
y = iris.target

X_train, X_test, y_train, y_test = train_test_split(X, y, random_state=666)
log_reg = LogisticRegression()
log_reg.fit(X_train, y_train)
log_reg.score(X_test, y_test)
0.94736842105263153
log_reg2 = LogisticRegression(multi_class="multinomial", solver="newton-cg")
log_reg2.fit(X_train, y_train)
log_reg2.score(X_test, y_test)
1.0
OvO and OvR
from sklearn.multiclass import OneVsRestClassifier

ovr = OneVsRestClassifier(log_reg)
ovr.fit(X_train, y_train)
ovr.score(X_test, y_test)
0.94736842105263153
from sklearn.multiclass import OneVsOneClassifier

ovo = OneVsOneClassifier(log_reg)
ovo.fit(X_train, y_train)
ovo.score(X_test, y_test)
1.0