summary
KMeans is an unsupervised learning method. He is a classification algorithm. It is used to explore the original data and classify the samples with the same attributes in the original data. This article only talks about the simple use of KMeans. For the content about the evaluation results, see my next article.
Several concepts in KMeans
- Cluster: that is, grouping. KMeans divides the data into K clusters, with large differences between clusters and small differences within clusters
- Centroid: the mean value of all data in the cluster is the centroid of the cluster. For example, the centroid of a cluster point in a two-dimensional plane is the mean of the vertical coordinates of all points in the cluster
- Intra cluster error: the sum of the distances from the sample point to its centroid, which is used to measure the difference of clusters
KMeans working process
- K sample points are randomly selected as the initial centroid
- Each sample is divided into clusters with the nearest centroid
- After clustering each sample, calculate the new centroid of each cluster
- Repeat the process 2 and 3 until the new centroid does not change
KMeans usage example
Import related modules
from sklearn.cluster import KMeans
from sklearn.datasets import make_blobs
import matplotlib.pyplot as plt
import warnings

%matplotlib inline

# Ignore warning
warnings.filterwarnings("ignore")
Generate raw data
Make in sklearn is used here_ Blobs method to generate raw data. About the use of this method, Look at my other article . Here, the data generated by this method will return labels (i.e. the classification to which each sample belongs) to facilitate the verification of the results of KMeans.
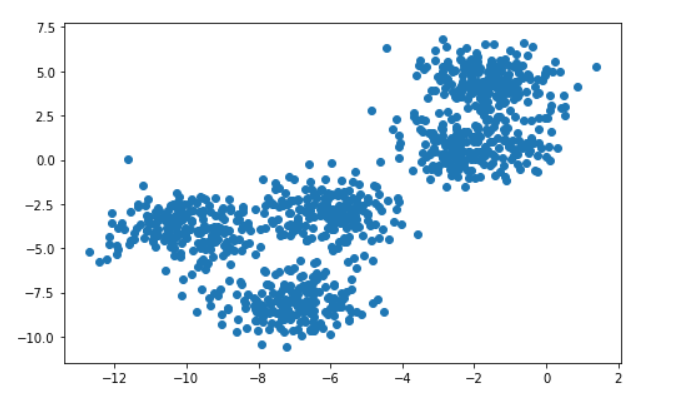
# Generate data for KMeans clustering
# In real life, we don't know the clustering of data, which needs us to explore with KMEans
X, y = make_blobs(n_samples=1000, n_features=2, centers=5, random_state=1)

# Display raw data
plt.figure(figsize=(8, 5))
plt.scatter(X[:, 0], X[:, 1])
# When we do not know the clustering of the original number
# According to the scatter diagram, we can reasonably guess that the clustering situation may be 2, 4, 5, etc
# In practice, the specific cluster needs to be divided into several clusters, which need to be judged according to the specific business
Classification by KMeans
Here, I assume that there are four clusters of data (although I know that five clusters are correct, this is only to show the use of KMeans, and there is no need to be too tangled with the accuracy of the results). In reality, it needs to be divided into several clusters according to business requirements and model requirements.
Pass n_ Use the clusters parameter to set the number of clusters to be clustered
# Suppose the data is divided into 4 clusters
cluster_4 = KMeans(n_clusters=4).fit(X)
# It should be noted that there is no need to predict tags in KMeans
# That is to say, KMeans automatically divides our data into n after our fit is completed_ Cluster cluster
# We can view the clustering of each sample and other data through attributes
KMeans common properties
labels_ View clustering results
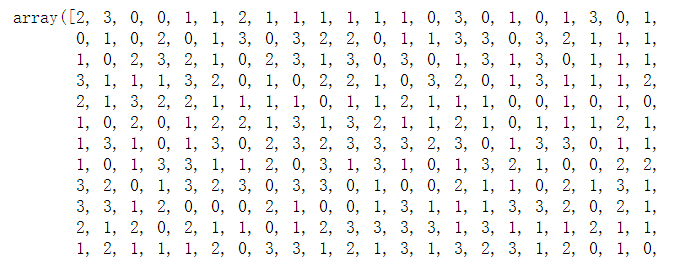
# Through labels_ Attribute to view the cluster to which each sample belongs
cluster_4.labels_
cluster_centers_ View the centroid of each cluster
# Through attribute cluster_centers_ To see the centroid of each cluster
cluster_4.cluster_centers_
# array([[-5.98544724, -2.94134241],
#        [-1.80916412,  2.65609291],
#        [-7.05942132, -8.07760549],
#        [-9.98028373, -3.90557712]])
inertia_ View the error of KMeans classification results
# Through inertia_ To see the clustering error
cluster_4.inertia_
# 3336.779415794397
Display of classification results
# Draw the situation after clustering
plt.figure(figsize=(10,6))
plt.scatter(
    x=X[:, 0],
    y=X[:, 1],
    c=cluster_4.labels_,
    s=20
    )
# Draw the center of mass
plt.scatter(cluster_4.cluster_centers_[:, 0], cluster_4.cluster_centers_[:, 1], marker='X', s=70, c='red')
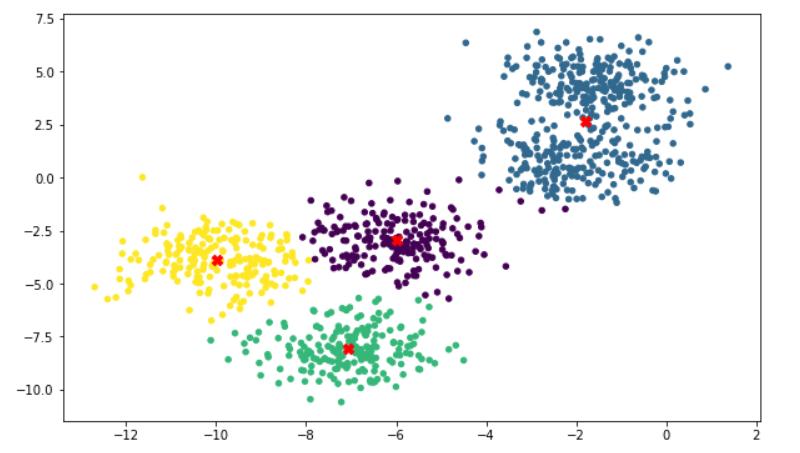
It can be seen that the effect of classification is still very obvious. If the original data has only four categories, this result is undoubtedly very correct.
predict method in KMeans
We mentioned earlier that KMeans does not need to predict the results. In the fit step, he said that the data is divided into K clusters. And you can use the attribute labels_ To view the clustering and segmentation results. So why does sklearn still provide this interface.
Reason: KMeans is a very time-consuming operation (constantly calculating the distance from each sample to the centroid). When the amount of data is very small, it may be difficult for us to detect the consumption of time. When we have a large amount of data, such as 50w data. It will be a long process for KMeans to calculate directly. At this time, you need to use the predict method. Under the 50w data, we may only need 2k data to basically calculate the centroid of the 50w data. Then we can use the KMeans object trained from the 2k data to call the predict method to cluster the rest of the data, which will greatly reduce the running time of KMeans (although there will be some small errors).
summary
Here we mainly talk about the introduction and usage of KMeans. Some of its details and evaluation criteria will be introduced in detail in the following articles.