Why maptalks
As buddies, partners know that every map vendor is bound to their own map resources. For example, very popular mapBox, Gd, Baidu, Tencent, etc., you must register their products, get key, and then call api to carry out map related operations, though it brings convenience, but there is also this limitation.
Then someone may ask, it's so convenient to use their own, so you don't have to develop it yourself. No, why use other ones?
This problem is very good. The best way to make a product is to be controlled by the development itself. What can be done and to what extent can be achieved can be grasped by the development. This is a complete independent product. When it comes to autonomy, Chinese people also have personal experience. Crop gene patents, lithography machines, software, etc. are controlled by foreign countries. As users, we can only recognize planting and eating. maptalks is an open-source map framework for Chinese people. We can customize our map resources without third-party support, and also integrate many plug-ins, such as three, eckards Thermal diagram to support our development needs. This is not propaganda. I have some personal views.
API
https://maptalks.org/maptalks.js/api/0.x/Map.html
initialization
First you need to install maptalks
npm install maptalks
Similar to other frameworks, just understand;
Oh, there's another point. If there is a cross domain problem, you need to set crossOrigin: undefined
<template>
<div id="map" class="container"></div>
</template>
<script>
// Introducing styles and components
import 'maptalks/dist/maptalks.css';
import * as maptalks from 'maptalks';
export default {
data() {
return {
// Map engine
mapEngine: null,
// Inclination
pitch: 50,
// toolbar
// rotate
whirl: null,
// Zoom in / out
zoom: 14,
// Bearing
bearing: 0,
// Screen coordinates
containerPoint: {x: null, y: null},
// Map coordinates
coordinatePoint: {x: null, y: null}
}
},
mounted() {
const _t = this
this.$nextTick(() => {
const map = new maptalks.Map('map', {
// Default center point
center: [118.13245430046891, 24.495713873147764],
// Zoom level
zoom: _t.zoom,
// Inclination
pitch: _t.pitch,
// Minimum zoom level
minZoom: 1,
// Maximum zoom level
maxZoom: 18,
// baseLayer represents the base layer. It can add multiple layers separated by commas
baseLayer: new maptalks.TileLayer('base', {
// Cross domain problems occur. To set this, it must be undefined
crossOrigin: undefined,
// Electronic map layer
urlTemplate: 'https://{s}.basemaps.cartocdn.com/light_all/{z}/{x}/{y}.png',
subdomains: ['a', 'b', 'c', 'd'],
attribution: '© <a href="http://osm.org">OpenStreetMap</a> contributors, © <a href="https://carto.com/">CARTO</a>'
})
});
});
}
}
</script>
<style lang="scss">
.container {
width: 100%;
height: 100%
}
</style>
Symbol Properties
This attribute is used to set the style. It is a rule. Later, our functions are related to this. Therefore, we understand it in advance. The following is its document description:
https://github.com/maptalks/maptalks.js/wiki/Symbol-Reference
Create Layer
There are two ways to create layers:
- Create layers while creating map instances:
2 parameters. The required parameter is the first (id). The second parameter is options, which is its layer attribute setting. It is generally on the line by default. It can also be set later through layer objects.
const map = new maptalks.Map('map', {
// Default center point
center: [118.13245430046891, 24.495713873147764],
// Zoom level
zoom: _t.zoom,
// Inclination
pitch: _t.pitch,
// Minimum zoom level
minZoom: 1,
// Maximum zoom level
maxZoom: 18,
// baseLayer represents the base layer. It can add multiple layers separated by commas
baseLayer: new maptalks.TileLayer('base', {
// Electronic map layer
urlTemplate: 'https://{s}.basemaps.cartocdn.com/light_all/{z}/{x}/{y}.png',
subdomains: ['a', 'b', 'c', 'd'],
attribution: '© <a href="http://osm.org">OpenStreetMap</a> contributors, © <a href="https://carto.com/">CARTO</a>'
}),
layers: [
// Create vector layer v
// new maptalks.VectorLayer('v ', geometry list, optional parameter configurations))
new maptalks.VectorLayer('v')
]
});
- Create a layer instance and add it to the map instance
Note: a method addTo(map) is used here. This method is common to all components, which means that this method is used to add the tools and components introduced below to the map.
new maptalks.VectorLayer('v').addTo(map)
Zoom in, zoom out, etc
During map initialization, we can also add some of our tools:
It provides new maptalks control. Toolbar let's instance a toolbar, format:
// Toolbar instantiation
      new maptalks.control.Toolbar({
        items: [
          {
              // Display name
            item: 'enlarge',
              // Click time
            click: () => {
              map.setZoom(_t.zoom += 1)
            }
          }
        ]
      }).addTo(map);
Here I briefly list the attributes in items. In fact, it has four attributes: position, vertical, reverseMenu and items. For details, see maptalks / docs / API / 0 x/control. Toolbar. HTML can also be viewed from the perspective of the source code. In the source code, it has a default configuration, such as the following:
var options$s = {
  'height': 28,
  'vertical': false,
  'position': 'top-right',
  'reverseMenu': false,
  'items': {}
};
The zoom tool provides off the shelf components:
  /**
     * Add zoom tool
     * @param map
     */
    addZoomTool(map) {
      new maptalks.control.Zoom({
        // Tool location
        position: 'top-left',
        // Is it displayed as a line segment
        slider: false,
        // Show zoom level text box
        zoomLevel: true
      }).addTo(map);
    },
We can also customize and create:
 new maptalks.control.Toolbar({
        items: [
          {
            item: 'enlarge',
            click: () => {
              map.setZoom(_t.zoom += 1)
            }
          },
          {
            item: 'narrow',
            click: () => {
              map.setZoom(_t.zoom -= 1)
            }
          },
          {
            item: 'rotate',
            click: () => {
              map.setBearing(_t.bearing -= 50)
            }
          },
          {
            item: 'Reset',
            click: () => {
              _t.mapDataReset(map)
            }
          },
          {
            item: 'locking',
            click: (t) => {
              if (t.target.item === 'locking') {
                map.setOptions({
                  // Draggable
                  draggable: false,
                  // translation
                  dragPan: false,
                  // rotate
                  dragRotate: false,
                  // spacing
                  dragPitch: false,
                  // Scroll zoom
                  scrollWheelZoom: false,
                  // Click zoom
                  touchZoom: false,
                  // Double click zoom
                  doubleClickZoom: false
                })
                t.target.item = 'Unlock'
              } else {
                map.setOptions({
                  // Draggable
                  draggable: true,
                  // translation
                  dragPan: true,
                  // rotate
                  dragRotate: true,
                  // spacing
                  dragPitch: true,
                  // Scroll zoom
                  scrollWheelZoom: true,
                  // Click zoom
                  touchZoom: true,
                  // Double click zoom
                  doubleClickZoom: true
                })
                t.target.item = 'locking'
              }
            }
          }
        ]
      }).addTo(map);
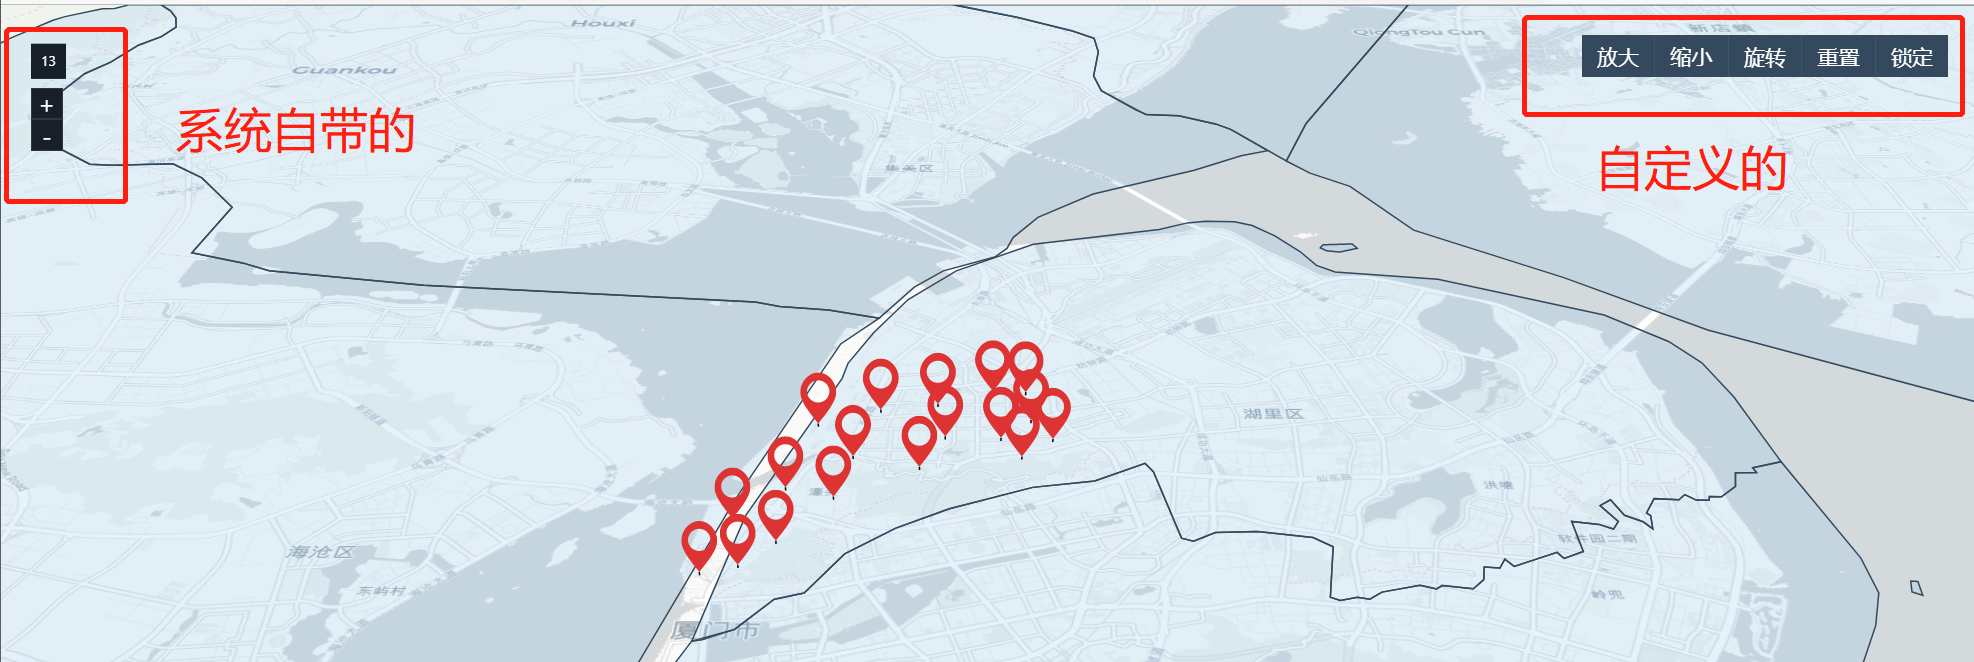
The effects are as follows:
Draw area faces (geometry)
First of all, we should know that it has two concepts: Geometry and polygon. Polygon inherits Geometry. The two can be regarded as one thing;
Also, drawing faces requires drawing on the VectorLayer layer layer.
The principle of its picture is that two points define a straight line, and multiple points are connected into multiple lines. From a distance, it is a curve. Then the surface connects the starting and ending points to make it closed-loop, and the color is a surface.
OK, you can find a data to test: Map selector (aliyun.com)
Download a geojson data with any name. Here's how to use it:
First, to clear how to add geometric faces, use layer addGeometry (Geometry). addGeometry supports both single and array. In other words, the parameters we can pass in can be Polygon, MultiPolygon, Geometry, MultiGeometry, or their arrays.
-
Polygon
const optiosn = {
    visible: true,
    editable: true,
    cursor: 'pointer',
    shadowBlur: 0,
    // shadow
    shadowColor: 'red',
    draggable: false,
    dragShadow: true,
    drawOnAxis: null,
    enableAltitude: true,
    symbol: {
        // Line color
        lineColor: '#34495e',
        // line width
        lineWidth: 1,
        // Fill color
        polygonFill: 'rgb(135,196,240)',
        // Opacity
        polygonOpacity: 0.2
    }
}
const polygon = new maptalks.Polygon(data, options)


new maptalks.VectorLayer('v').addGeometry(polygon).addTo(_t.mapEngine)
This method compares the feeling of the bottom layer, because the data it passes in is a coordinate set, and the format is as follows:
There are three layers of packages, which is really uncomfortable. Moreover, our data is generally obtained through GeoJSON. To use this method, we have to obtain it from JSON objects. I used this method from the beginning, which is quite uncomfortable.
[ [ [121.55074604278596, 31.242008515751614], [121.55074604278596, 31.23914637638951], [121.55349262481711, 31.23914637638951], [121.55349262481711, 31.24134802974913], [121.5518618417361, 31.241384723537074], [121.55074604278596, 31.242008515751614] ] ]-
MultiPolygon
maptalks provides a geojson tool class that is more compatible with geojson. This tool is called geojson
-
const geoJson = require( '@/mock/xiamen.json')


  /**
    * Draw area faces according to geojson
    * @param geoJson geoJson data
    * @param layer Layer if required
    */
drawAreaPolygon(geoJson, layer) {
    const _t = this
    const geometry = maptalks.GeoJSON.toGeometry(geoJson)
    if (geometry) {
        geometry.forEach(g => {
            g.setSymbol({
                // Line color
                lineColor: '#34495e',
                // line width
                lineWidth: 1,
                // Fill color
                polygonFill: 'rgb(135,196,240)',
                // Opacity
                polygonOpacity: 0.2
            })
        })
    }
    layer.addGeometry(geometry)
},
maptalks. GeoJSON. Togeometry (geojason) gets a MultiPolygon array object
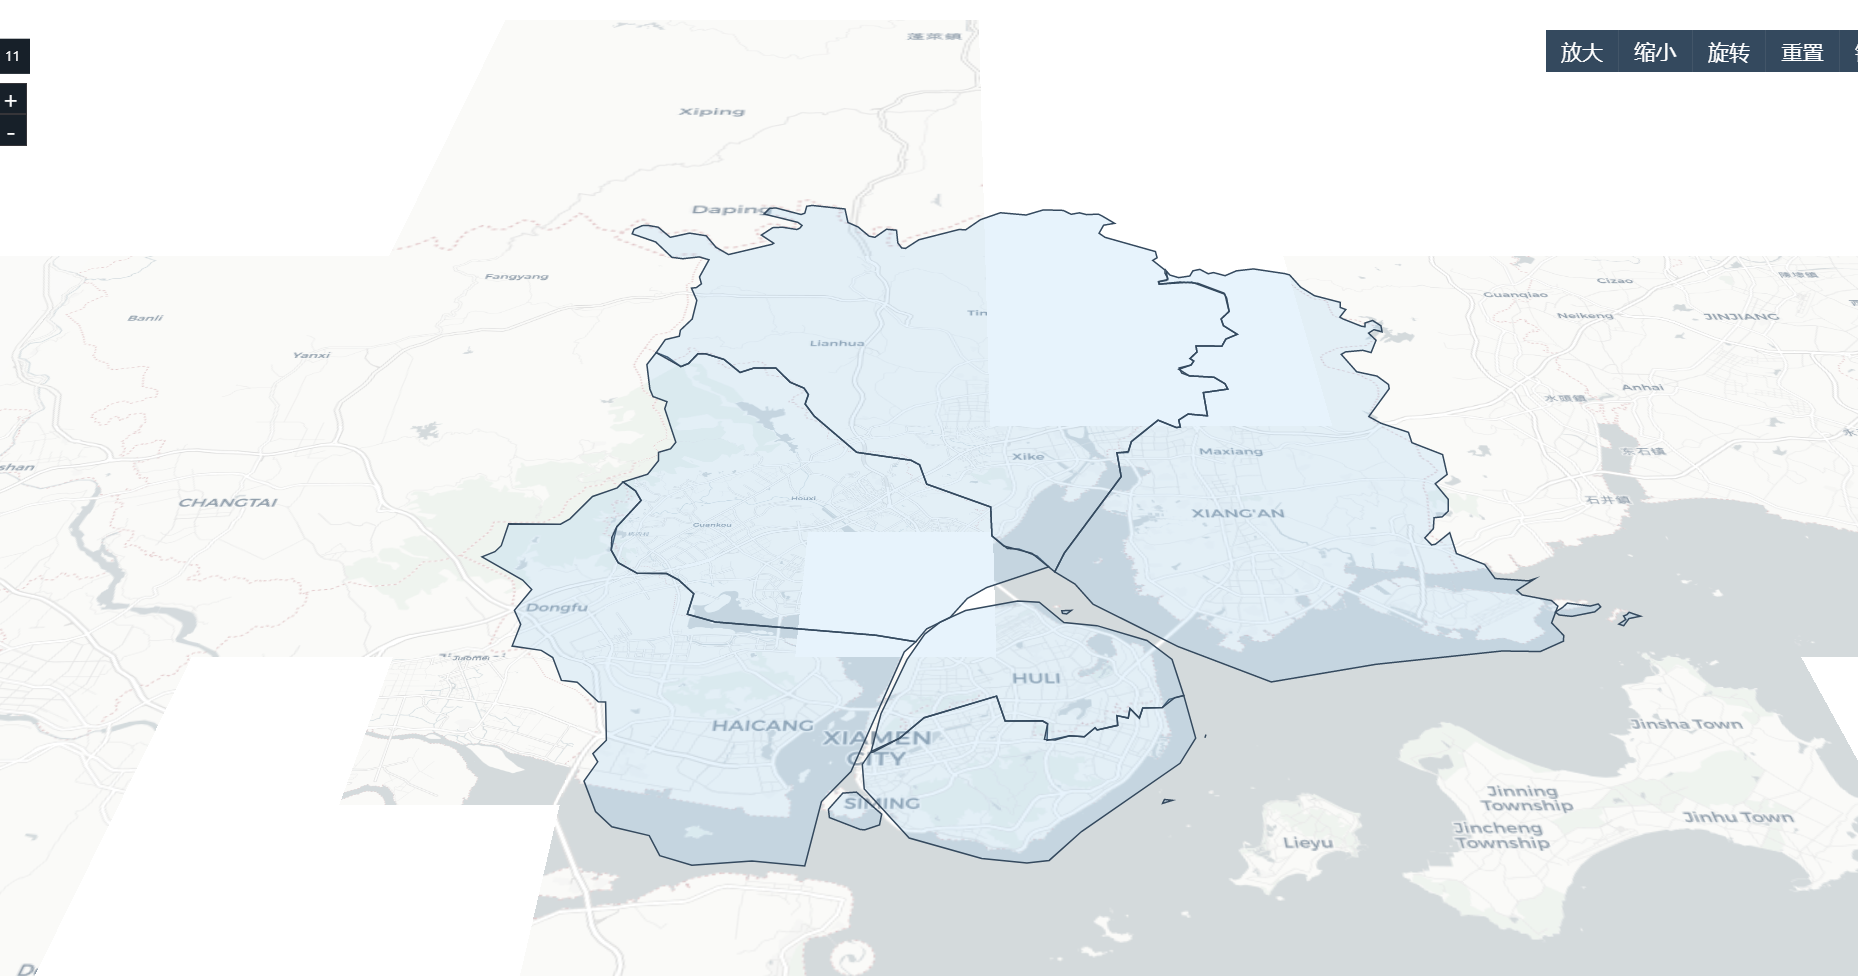
The effects are as follows:
It seems that the JSON data is not very accurate. It's not important. What's important is that we have drawn the surface and need some interaction.
Face interaction (event listening)
We have drawn a surface above, but we can only see it, and there is no interaction. The user experience is very, very, um... There is no user experience. Now let's add events to realize the interaction of mouse movement and click.
Geometry Polygon provides the same for listening to events on and js. There is nothing to say. Let me take the face created by geojason as an example:
 drawAreaPolygon(geoJson, layer) {
        const _t = this
        const geometry = maptalks.GeoJSON.toGeometry(geoJson)
          if (geometry) {
              geometry.forEach(g => {
                  g.setSymbol({
                      // Line color
                      lineColor: '#34495e',
                      // line width
                      lineWidth: 1,
                      // Fill color
                      polygonFill: 'rgb(135,196,240)',
                      // Opacity
                      polygonOpacity: 0.2
                  })
                  // Set information box
                  g.setInfoWindow({
                      title    : g.properties.name,
                      content  : '<br style="color:#F00 "> central point: '+ g.properties.center +' < / BR > Administrative Division: '+ g.properties.addcode +' < / BR > parent administrative division: '+ g.properties.parent.addcode +' < / div > '
                  })
                  // Mouse interaction event listening
                  g.on('mouseenter', function (e) {
                      e.target.updateSymbol({
                          polygonFill: '#f00'
                      });
                  }).on('mouseout', function (e) {
                      e.target.updateSymbol({
                          polygonFill: 'rgb(135,196,240)'
                      });
                  }).on('click', function (e) {
                      e.target.openInfoWindow(e.coordinate)
                  })
              })
          }
          layer.addGeometry(geometry)
      },
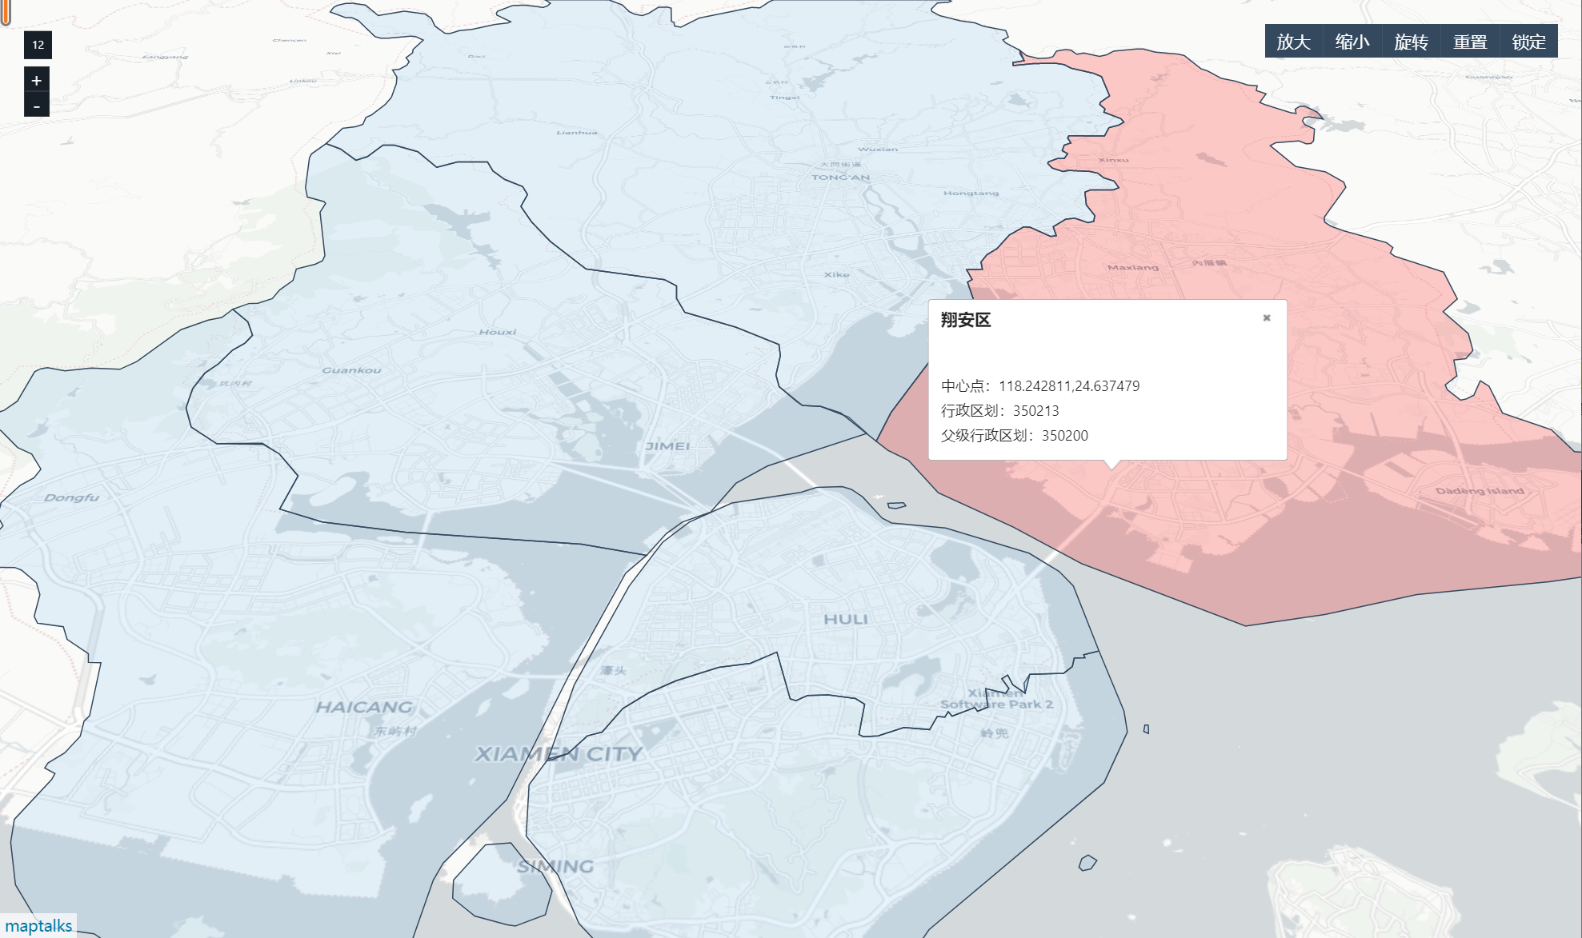
The effects are as follows:
It displays a pop-up box where the mouse clicks
Basic operations are available now and are commonly used, but you think you still need a right-click menu. Menu ah, yes, it also provides the settings of these things. Here is another simple example:
 drawAreaPolygon(geoJson, layer) {
            const _t = this
            const geometry = maptalks.GeoJSON.toGeometry(geoJson)
            if (geometry) {
                geometry.forEach(g => {
                    g.setSymbol({
                        // Line color
                        lineColor: '#34495e',
                        // line width
                        lineWidth: 1,
                        // Fill color
                        polygonFill: 'rgb(135,196,240)',
                        // Opacity
                        polygonOpacity: 0.2
                    })
                    // Set information box
                    g.setInfoWindow({
                        title: g.properties.name,
                        content: '<br style="color:#F00 "> central point: '+ g.properties.center +' < / BR > Administrative Division: '+ g.properties.addcode +' < / BR > parent administrative division: '+ g.properties.parent.addcode +' < / div > '
                    })
                    // Set context menu
                    g.setMenu({
                        width: 160,
                        custom: false,
                        items: [
                            { item: 'Menu one', click: function() { alert('Query Clicked!'); return false } },
                            '-',
                            { item: 'Menu II', click: function() { alert('Edit Clicked!') } },
                            { item: 'Menu III', click: function() { alert('About Clicked!') } }
                        ]
                    })
                    // Mouse interaction event listening
                    g.on('mouseenter', function(e) {
                        e.target.updateSymbol({
                            polygonFill: '#f00'
                        })
                    }).on('mouseout', function(e) {
                        e.target.updateSymbol({
                            polygonFill: 'rgb(135,196,240)'
                        })
                    }).on('click', function(e) {
                        e.target.openInfoWindow(e.coordinate)
                    })
                })
            }
            layer.addGeometry(geometry)
        },
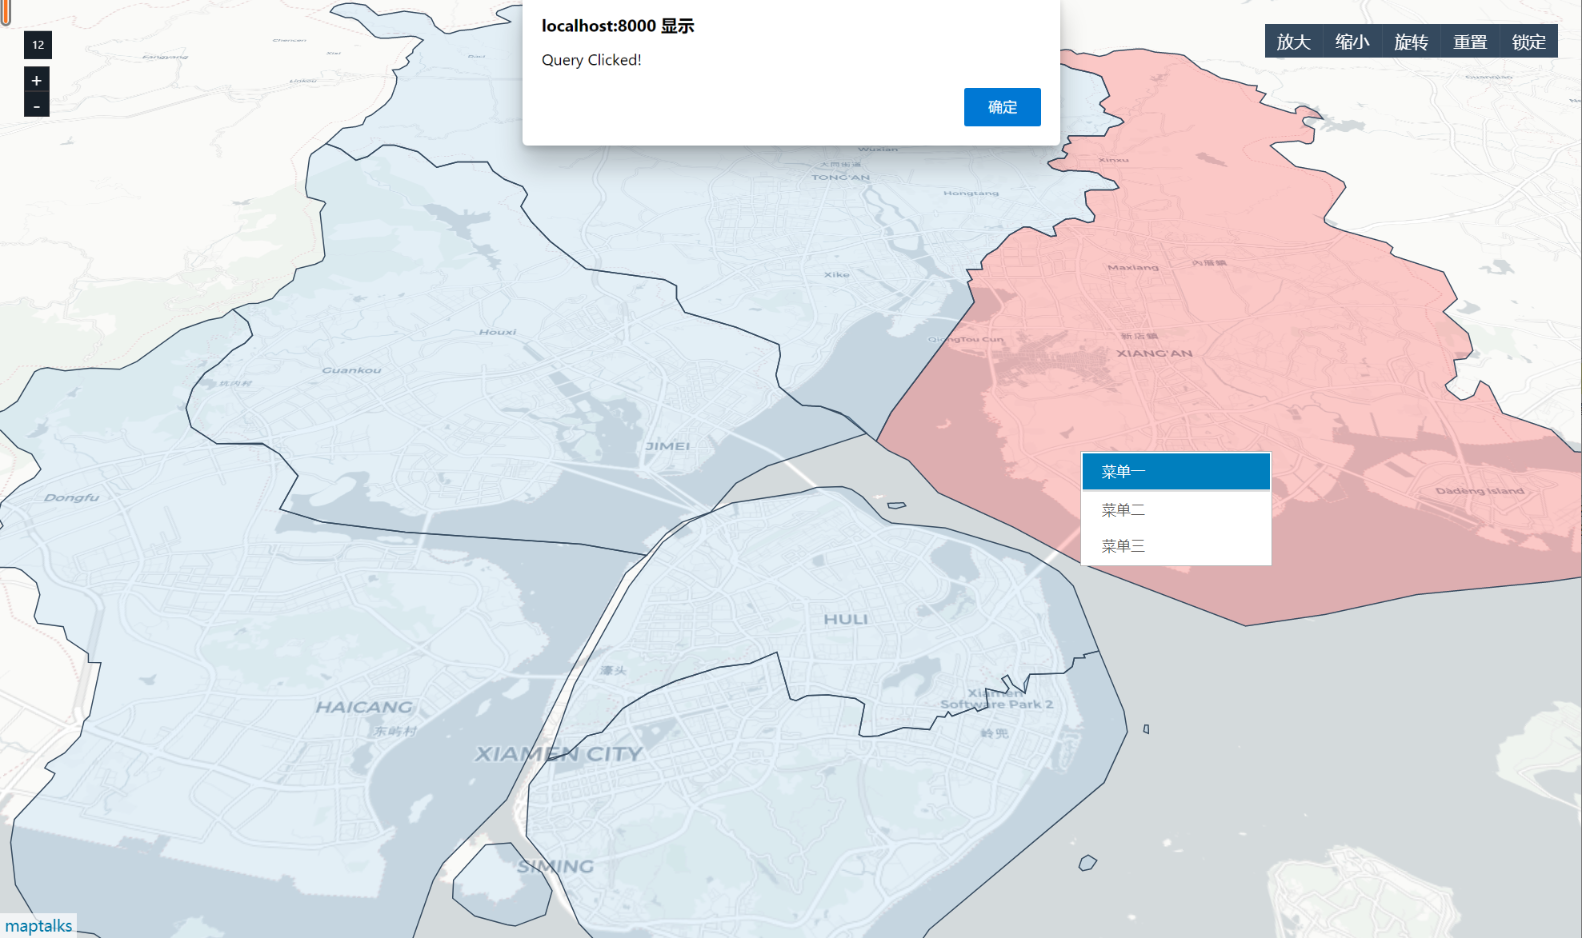
The menu here has a return value. If false is returned, the menu will not be closed.
The effects are as follows:
Draw mark
Drawing a mark is not as complex as Polygon. It only needs a coordinate point, and then draw an icon in the specified coordinates,
It has an addTo method that can be added to any layer
drawMark(centerPointList, layer) {
            if (!centerPointList) {
                console.log('No area center point data')
                return
            }
            const info = { content: '', width: 150, minHeight: 100 }
            const result = []
            // The data format of d here is array, for example: [- 0.113049, 51.498568]
            centerPointList.forEach(d => {
                if (!d.info) {
                    d.info = info
                }
                // High and highlighted mark
                const mark = new maptalks.Marker(d.center, {
                    // If this property is set, the default icon will be replaced
                    // symbol: {
                        // markerFile: 'foo.png',
                        // textName: d.name
                    // },
                    properties: {
                        // Height setting
                        altitude: 50
                    }
                }).addTo(layer)
                mark.setInfoWindow({
                    title: d.name,
                    content: '<div>' + d.adcode + '</div>',
                    // autoPan: true,
                    width: d.info.width,
                    minHeight: d.info.minHeight,
                    // 'custom': false,
                    // Click open and close
                    // autoOpenOn: 'click',
                    // autoCloseOn: 'click'
                })

                // mark without height
                // new maptalks.Marker(d).updateSymbol({
                //   markerOpacity: 0.5,
                //   markerFill: '#bbb'
                // }).addTo(layer)

                mark.setZIndex(1000)
                result.push(mark)
            })
            return result
        },
The centerPointList here is the properties attribute in geojason;
Points for attention in drawing 3D graphics
A key point here is that to draw a 3D mark, you need to set the layer layer and enable the height drawing as follows:
layer.setOptions({
        // Enable height drawing
        enableAltitude: true,
        altitudeProperty: 'altitude',
        // Draw a height line
        drawAltitude: {
         // Here is the width of the drawn height line, which can be understood as Z. it should be transparent and set to 0 here
          lineWidth: 1,
          lineColor: '#000'
        }
      })
Lock Perspective
When locking is enabled, the view we see will only be the area we have set. By default, this area is the center set during map initialization
 lockView() {
     const extent = this.map.getExtent()
     this.map.setMaxExtent(extent)
 },