In order to reduce information redundancy and reduce the dimension of data, the optimal band feature combination is established by using the optimal index factor (OIF). Its basic principle is: the amount of information covered in the image is directly proportional to its standard deviation. The larger the standard deviation, the more information; The independence of image is inversely proportional to the correlation coefficient between bands. The lower the correlation coefficient, the smaller the information redundancy, and the better the independence. This method combines the correlation between various bands and the amount of information of single band images, and has been widely used.
You can refer to the following papers:
Chavez P S, GL B, LB S. Statistical method for selecting Landsat MSS ratios[J]. 1982.
(OIF first proposed by Chavez)
Zhao Qingzhan, Liu Wei, Yin Xiaojun, Zhang Tianyi Research on optimal band combination based on UAV multispectral image features [J] Journal of agricultural machinery, 2016,47 (03): 242-248 + 291
Pei Huan, sun Tianjiao, Wang Xiaoyan Object oriented land use / Cover Classification Based on texture features of Landsat 8 OLI image [J] Journal of agricultural engineering, 2018,34 (02): 248-255
OIF calculation formula
In the original paper
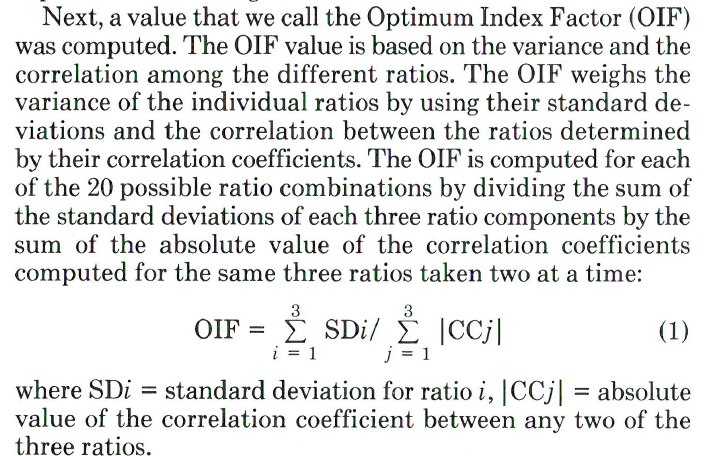
Usually written in this form
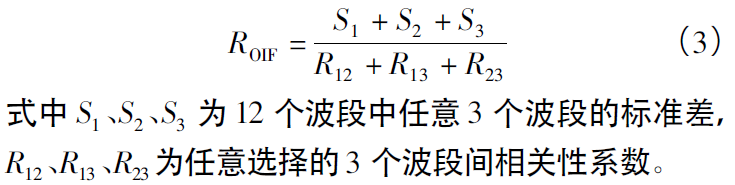
Select three band combinations and calculate their OIF values. The larger the OIF value, the smaller the band standard deviation and the smaller the correlation coefficient between bands, indicating that the band combination data quality is the best.
matlab program to calculate OIF
1) Because I use both the original image to calculate OIF and the ratio between different bands to calculate OIF, there will be two parts at the beginning of the code, but the main variable involved in OIF operation is X. Moreover, I assign the abnormal value (mainly 0, in fact, there are negative values not handled) in the band ratio to NaN. If 0 is not handled, NaN will appear in the result of OIF calculation. omitnan value is ignored in some functions.
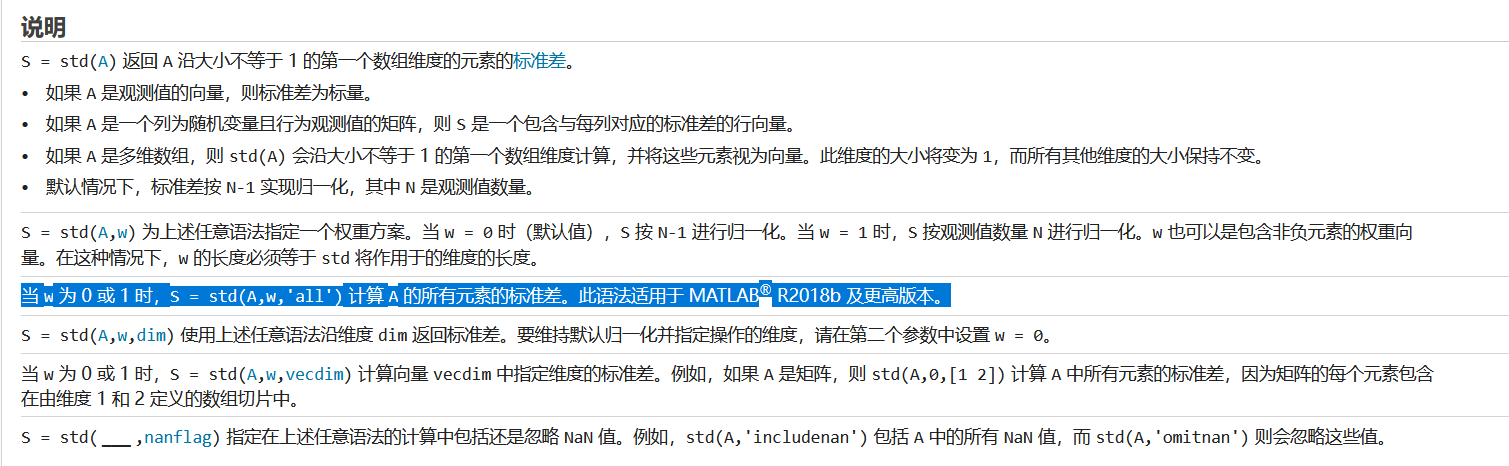
2) My version of matlab is relatively low, and the calculation of standard deviation is a self written process. Because it is a multidimensional array, it is impossible to calculate it directly with std. according to the official website documents, the version above 2018b can directly calculate the standard deviation of all elements of a multidimensional array.
 And the calculation standard deviation written by yourself is publicized as
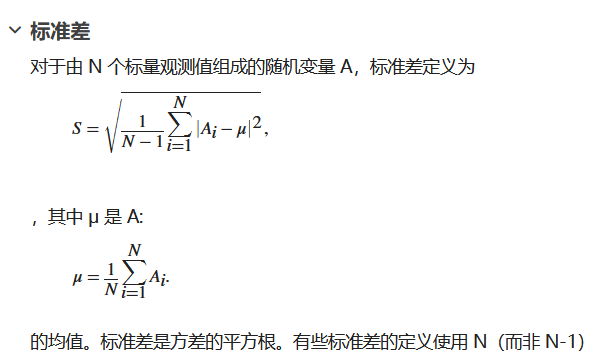 Here, 1 / (n-1) is used to consider the concept of unbiased estimator. For details, refer to the mathematical statistics section.
3) My original image is int16 type, which is changed to double type here to calculate the band ratio later. If int16 type is used to calculate the ratio, the result is wrong
clear all
clc
Image = imread('20180316QFLY_GS.tif');  % Read image for int16 Type, if you directly change the exception value to NaN It can't be changed into double type
Image_D = double(Image);

% Band ratio
Image_D(Image_D == 0) = NaN;
XRatio_Combination = nchoosek(1:size(Image_D,3),2);  % Combination of ratios
X_Combination = nchoosek(1:size(XRatio_Combination,1),3);  % Choose three from so many ratio combinations
X = zeros(size(Image,1),size(Image,2),size(XRatio_Combination,1));
for m = 1:size(XRatio_Combination,1)
    % Calculate the band ratio and follow XRatio_Combination Stored in the order of X
    X(:,:,m) = Image_D(:,:,XRatio_Combination(m,1)) ./ Image_D(:,:,XRatio_Combination(m,2));
end

% Original image
% X = Image_D;  % Original band calculation OIF
% X_Combination = nchoosek(1:size(X,3),3);  % n Choose 3, n Is the number of bands,This is used for raw band calculation OIF

%%
% Calculate the standard deviation and correlation coefficient
X_StdDev = zeros(1,size(X,3));
% Not included NaN You can use it directly std2
% for i = 1:size(X,3)
%     X_StdDev(i) = std2((X(:,:,i)));  % Standard deviation of each band
% end
for i = 1:size(X,3)
    X_Mean1 = mean(mean(X(:,:,i),'omitnan'));
    X_Sq = (X(:,:,i) - X_Mean1).^2;
    X_StdDev(i) = sqrt(sum(sum(X_Sq),'omitnan')/(size(X,1) * size(X,2) - 1));
end
XCom_StdDev = [X_Combination,zeros(size(X_Combination,1),1)];


for i = 1:size(X_Combination,1)  % Note that the end value of the loop here is the combination number, that is X_Combination Number of rows
    XCom_StdDev(i,4) = X_StdDev(X_Combination(i,1)) + X_StdDev(X_Combination(i,2)) + ...
        X_StdDev(X_Combination(i,3));  % Calculation of combined band StdDev Sum of
end
XCom_Corr = [X_Combination,zeros(size(X_Combination,1),1)];
for j = 1:size(X_Combination,1)
    % corrcoef of'Rows','complete'Used to ignore NaN value
     c1 = corrcoef(double(X(:,:,X_Combination(j,1))),double(X(:,:,X_Combination(j,2))),'Rows','complete');
     c2 = corrcoef(double(X(:,:,X_Combination(j,1))),double(X(:,:,X_Combination(j,3))),'Rows','complete');
     c3 = corrcoef(double(X(:,:,X_Combination(j,2))),double(X(:,:,X_Combination(j,3))),'Rows','complete');
     XCom_Corr(j,4) = c1(2,1) + c2(2,1) + c3(2,1);
end
%%
% calculation OIF
OIF = [X_Combination,zeros(size(X_Combination,1),1)];
OIF(:,4) = XCom_StdDev(:,4) ./ XCom_Corr(:,4);  % Preliminary calculation OIF
X_OIF = sortrows(OIF,-4);  % according to OIF Sort values in descending order
fprintf('The optimal combined band ratio is %d/%d,%d/%d,%d/%d,his OIF Value is%.3f\n',XRatio_Combination(X_OIF(1,1),:),...
    XRatio_Combination(X_OIF(1,2),:),XRatio_Combination(X_OIF(1,3),:),X_OIF(1,4));  % Band ratio
% fprintf('The optimal combination band is %d,%d,%d,his OIF Value is%.3f\n',X_OIF(1,:));  % Original band