1. General
∙ \bullet · generation: in 1975, Holland proposed GA
∙ \bullet · source: biological evolution: natural selection, survival of the fittest; Biological genetic variation.
∙ \bullet · basic idea:
▹ \triangleright ▹ construct the fitness function according to the problem objective function
▹ \triangleright ▹ produce an initial population (100-1000)
▹ \triangleright ▹ continuously select, cross, mutate and reproduce according to the fitness function
▹ \triangleright ▹ after several generations, the individual with the best fitness function is obtained, that is, the optimal solution
∙ \bullet · constituent elements:
▹ \triangleright ▹ Population, Population size
▹ \triangleright ▹ Gene Representation: generally, binary coding method (depending on the situation) is used to generate a series of binary strings.
▹ \triangleright ▹ Genetic Operator: Crossover operator and Mutation operator.
▹ \triangleright ▹ selection strategy: generally proportional selection, select individuals with high fitness in the population, and the fittest will survive and the fittest will survive.
▹ \triangleright ▹ Stopping Rule/Criterion: usually specifies the maximum number of iterations.
2. Basic GA
∙
\bullet
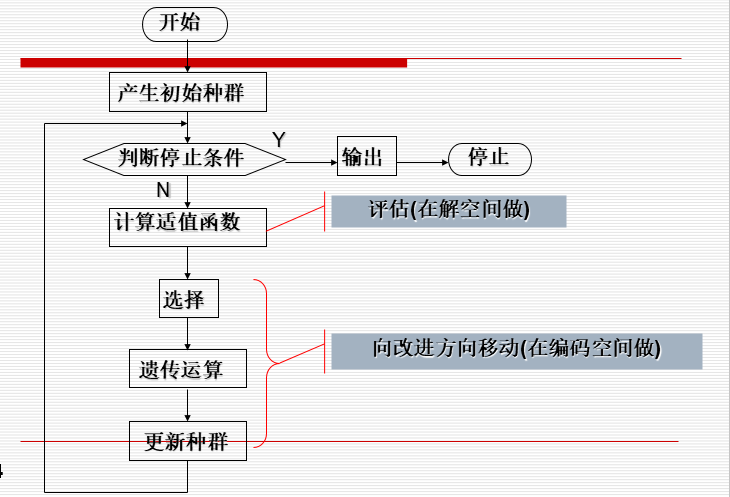
· GA flow chart:

∙
\bullet
· conversion between solution space and coding space: generally, the coding space is a binary string and the solution space is a decimal number, so the binary string is used for genetic operation. When calculating fitness and returning results, it is converted to a decimal number.
∙ \bullet · for the TSP problem, we set the chromosome as a random sequence of n cities to represent the travel route.
3. Specific implementation process
3.1 tsp.m
t s p tsp tsp function generates the specified city coordinates and forms a distance matrix. Here, we have written 10, 30, 48, 50 and 75 city coordinates, which can be directly called when using. If we have city coordinates, we can also bring in our own city coordinates.
function [DLn,cityn]=tsp(n)
%input parameter  n Is the number of cities and returns the parameter Dln by n×n Distance matrix, cityn by n×2 City coordinate matrix

if n==10
    city10=[0.4 0.4439;0.2439 0.1463;0.1707 0.2293;0.2293 0.761;0.5171 0.9414;
        0.8732 0.6536;0.6878 0.5219;0.8488 0.3609;0.6683 0.2536;0.6195 0.2634];%10 cities d'=2.691
    for i=1:10
        for j=1:10
            DL10(i,j)=((city10(i,1)-city10(j,1))^2+(city10(i,2)-city10(j,2))^2)^0.5;
        end
    end
    DLn=DL10;
    cityn=city10;
end

if n==30
    city30=[41 94;37 84;54 67;25 62;7 64;2 99;68 58;71 44;54 62;83 69;64 60;18 54;22 60;
        83 46;91 38;25 38;24 42;58 69;71 71;74 78;87 76;18 40;13 40;82 7;62 32;58 35;45 21;41 26;44 35;4 50];%30 cities d'=423.741 by D B Fogel
    for i=1:30
        for j=1:30
            DL30(i,j)=((city30(i,1)-city30(j,1))^2+(city30(i,2)-city30(j,2))^2)^0.5;
        end
    end
    DLn=DL30;
    cityn=city30;
end

if n==48
    city48=[6734 1453;2233 10;5530 1424;401 841;3082 1644;7608 4458;7573 3716;7265 1268;6898 1885;
        1112 2049;5468 2606;5989 2873;4706 2674;4612 2035;6347 2683;6107 669;7611 5184;7462 3590;7732 4723;
        5900 3561;4483 3369;6101 1110;5199 2182;1633 2809;4307 2322;675 6;7555 4819;7541 3981;3177 756;7352 4506;
        7545 2801;3245 3305;6426 3173;4608 1198;23 2216;7248 3779;7762 4595;7392 2244;3484 2829;6271 2135;4985 140;
        1916 1569;7280 4899;7509 3239;10 2676;6807 2993;5185 3258;3023 1942;];%48cities d'=  by att48
    for i=1:48
        for j=1:48
            DL48(i,j)=((city48(i,1)-city48(j,1))^2+(city48(i,2)-city48(j,2))^2)^0.5;
        end
    end
    DLn=DL48;
    cityn=city48;
end

if n==50
    city50=[31 32;32 39;40 30;37 69;27 68;37 52;38 46;31 62;30 48;21 47;25 55;16 57;
        17 63;42 41;17 33;25 32;5 64;8 52;12 42;7 38;5 25; 10 77;45 35;42 57;32 22;
        27 23;56 37;52 41;49 49;58 48;57 58;39 10;46 10;59 15;51 21;48 28;52 33;
        58 27;61 33;62 63;20 26;5 6;13 13;21 10;30 15;36 16;62 42;63 69;52 64;43 67];%50 cities d'=427.855 by D B Fogel
    for i=1:50
        for j=1:50
            DL50(i,j)=((city50(i,1)-city50(j,1))^2+(city50(i,2)-city50(j,2))^2)^0.5;
        end
    end
    DLn=DL50;
    cityn=city50;
end

if n==75
    city75=[48 21;52 26;55 50;50 50;41 46;51 42;55 45;38 33;33 34;45 35;40 37;50 30;
        55 34;54 38;26 13;15 5;21 48;29 39;33 44;15 19;16 19;12 17;50 40;22 53;21 36;
        20 30;26 29;40 20;36 26;62 48;67 41;62 35;65 27;62 24;55 20;35 51;30 50;
        45 42;21 45;36 6;6 25;11 28;26 59;30 60;22 22;27 24;30 20;35 16;54 10;50 15;
        44 13;35 60;40 60;40 66;31 76;47 66;50 70;57 72;55 65;2 38;7 43;9 56;15 56;
        10 70;17 64;55 57;62 57;70 64;64 4;59 5;50 4;60 15;66 14;66 8;43 26];%75 cities d'=549.18 by D B Fogel
    for i=1:75
        for j=1:75
            DL75(i,j)=((city75(i,1)-city75(j,1))^2+(city75(i,2)-city75(j,2))^2)^0.5;
        end
    end
    DLn=DL75;
    cityn=city75;
end
3.2 CalDist.m
C a l D i s t CalDist CalDist function calculates the total distance of the specified sequence, and input parameters d i s l i s t dislist dislist is the distance matrix, s s s is the city sorting sequence and returns the result F F F is the total length of the distance.
function F=CalDist(dislist,s)
%Calculate the total length, dislist Is the distance matrix, s Sort cities, F Is the total length of the distance

DistanV=0;
n=size(s,2);
for i=1:(n-1)
    DistanV=DistanV+dislist(s(i),s(i+1));
end
DistanV=DistanV+dislist(s(n),s(1));
F=DistanV;
3.3 objf.m
o b j f objf objf is the calculation fitness function, and the parameters are passed in s s s is the population, including i n n ( species group large Small ) Inn (population size) Inn (population size) is a different tourist route. d i s l i s t dislist dislist is the distance matrix. return f f f is the fitness of each individual in the population, p p p is the cumulative probability, which is used for individual selection of the next generation.
function [f,p]=objf(s,dislist);

inn=size(s,1);  %Read population size
for i=1:inn
   f(i)=CalDist(dislist,s(i,:));  %Calculate the value of the function, i.e. fitness
end
f=1000./f';
%Calculate selection probability
fsum=0;
for i=1:inn
   fsum=fsum+f(i)^15;
end
for i=1:inn
   ps(i)=f(i)^15/fsum;
end
%Calculate cumulative probability
p(1)=ps(1);
for i=2:inn
   p(i)=p(i-1)+ps(i);
end
p=p';
end
3.4 sel.m
s e l sel The sel function represents the selection operation, including parameters s s s is the population, p p p is the cumulative probability. This function realizes the function of selecting two individual serial numbers with high fitness.
function seln=sel(s,p);

inn=size(p,1);
%Select two individuals from the population
for i=1:2
   r=rand;  %Generate a random number
   prand=p-r;
   j=1;
   while prand(j)<0  %High fitness, that is, individuals with high probability of occurrence are selected first
       j=j+1;
   end
   seln(i)=j; %Sequence number of the selected individual
end
end
3.5 scro.m
s c r p scrp The scrp function represents the crossover operation, with parameters s s s is the population, s e l n seln seln is the sequence number of the two individuals selected for the selection operation, p c pc pc is the crossover probability. return s c r o scro scro is two individuals after exchanging some chromosomes.
function scro=cro(s,seln,pc);

bn=size(s,2);
pcc=pro(pc);  %Whether to perform crossover operation is determined according to the crossover probability. 1 means yes, 0 means No
scro(1,:)=s(seln(1),:);
scro(2,:)=s(seln(2),:);
if pcc==1
   c1=round(rand*(bn-2))+1;  %stay[1,bn-1]A cross bit is generated randomly within the range
   c2=round(rand*(bn-2))+1;
   chb1=min(c1,c2);
   chb2=max(c1,c2);
   middle=scro(1,chb1+1:chb2);
   scro(1,chb1+1:chb2)=scro(2,chb1+1:chb2);
   scro(2,chb1+1:chb2)=middle;
   for i=1:chb1
       while find(scro(1,chb1+1:chb2)==scro(1,i))
           zhi=find(scro(1,chb1+1:chb2)==scro(1,i));
           y=scro(2,chb1+zhi);
           scro(1,i)=y;
       end
       while find(scro(2,chb1+1:chb2)==scro(2,i))
           zhi=find(scro(2,chb1+1:chb2)==scro(2,i));
           y=scro(1,chb1+zhi);
           scro(2,i)=y;
       end
   end
   for i=chb2+1:bn
       while find(scro(1,1:chb2)==scro(1,i))
           zhi=find(scro(1,1:chb2)==scro(1,i));
           y=scro(2,zhi);
           scro(1,i)=y;
       end
       while find(scro(2,1:chb2)==scro(2,i))
           zhi=find(scro(2,1:chb2)==scro(2,i));
           y=scro(1,zhi);
           scro(2,i)=y;
       end
   end
end
end
3.6 mut.m
m u t mut mut function represents mutation operation, parameters s n e w snew snew is the individual after cross operation, p m pm pm is the probability of variation. return s n n e w snnew snnew is a new individual after mutation.
function snnew=mut(snew,pm);

bn=size(snew,2);
snnew=snew;

pmm=pro(pm);  %The mutation operation is determined according to the mutation probability. 1 is yes and 0 is No
if pmm==1
   c1=round(rand*(bn-2))+1;  %stay[1,bn-1]Randomly generate a variable in the range
   c2=round(rand*(bn-2))+1;
   chb1=min(c1,c2);
   chb2=max(c1,c2);
   x=snew(chb1+1:chb2);
   snnew(chb1+1:chb2)=fliplr(x);
end
end
3.7 drawTSP.m
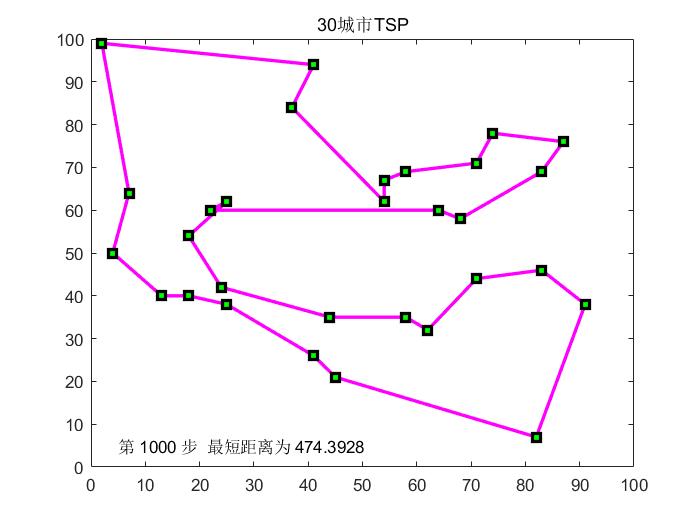
d r a w T S P drawTSP The drawTSP function draws T S P TSP TSP roadmap and search process map functions.
function m=drawTSP(Clist,BSF,bsf,p,f)
CityNum=size(Clist,1);
for i=1:CityNum-1
    plot([Clist(BSF(i),1),Clist(BSF(i+1),1)],[Clist(BSF(i),2),Clist(BSF(i+1),2)],'ms-','LineWidth',2,'MarkerEdgeColor','k','MarkerFaceColor','g');
    hold on;
end
plot([Clist(BSF(CityNum),1),Clist(BSF(1),1)],[Clist(BSF(CityNum),2),Clist(BSF(1),2)],'ms-','LineWidth',2,'MarkerEdgeColor','k','MarkerFaceColor','g');
title([num2str(CityNum),'city TSP']);
if f==0
    text(5,5,['The first ',int2str(p),' step','  The shortest distance is ',num2str(bsf)]);
else
    text(5,5,['Final search results: shortest distance ',num2str(bsf)]);
end
hold off;
pause(0.05);
3.8 genetic_algorithm.m
This function is the main function.
function gaTSP

CityNum=30;
[dislist,Clist]=tsp(CityNum);

inn=100; %Initial population size
gnmax=1000;  %Maximum number of iterations
pc=0.8; %Crossover probability
pm=0.8; %Variation probability

%Generate initial population
for i=1:inn
    s(i,:)=randperm(CityNum);  %Randomly disrupt the sequence of cities to form individuals
end
[f,p]=objf(s,dislist);

gn=1; %Number of iterations
while gn<gnmax+1
   for j=1:2:inn
      seln=sel(s,p);  %Select operation
      scro=cro(s,seln,pc);  %Cross operation
      scnew(j,:)=scro(1,:);
      scnew(j+1,:)=scro(2,:);
      smnew(j,:)=mut(scnew(j,:),pm);  %Mutation operation
      smnew(j+1,:)=mut(scnew(j+1,:),pm);
   end
   s=smnew;  %New populations have emerged
   [f,p]=objf(s,dislist);  %Calculate the fitness of the new population
   %Record the best and average fitness of the current generation
   [fmax,nmax]=max(f);
   ymean(gn)=1000/mean(f);
   ymax(gn)=1000/fmax;
   %Record the best individuals of the current generation
   x=s(nmax,:);
   drawTSP(Clist,x,ymax(gn),gn,0);
   gn=gn+1;
   %pause;
end
gn=gn-1;

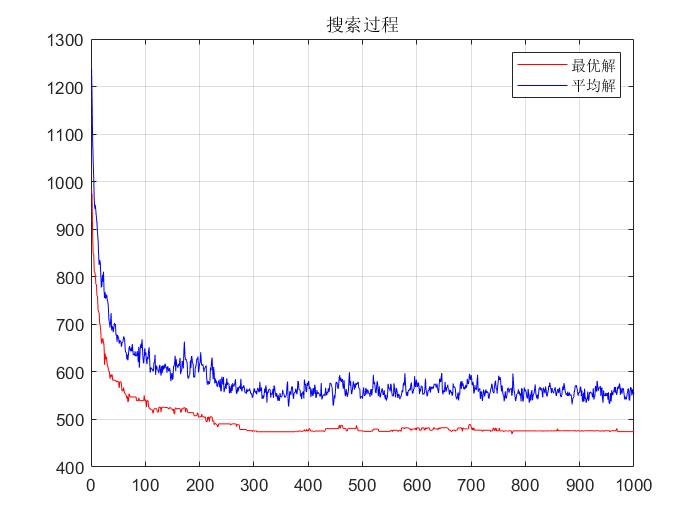
figure(2);
plot(ymax,'r'); hold on;
plot(ymean,'b');grid;
title('search process');
legend('Optimal solution','Mean solution');
end
4. Results

