Recently, I often encounter the confusion between matplotlib's OO API and pyplot package, so I took the time to read the matplotlib documents. The following is a general translation and summary. Many basic things still need to be mastered systematically and firmly
essential factor
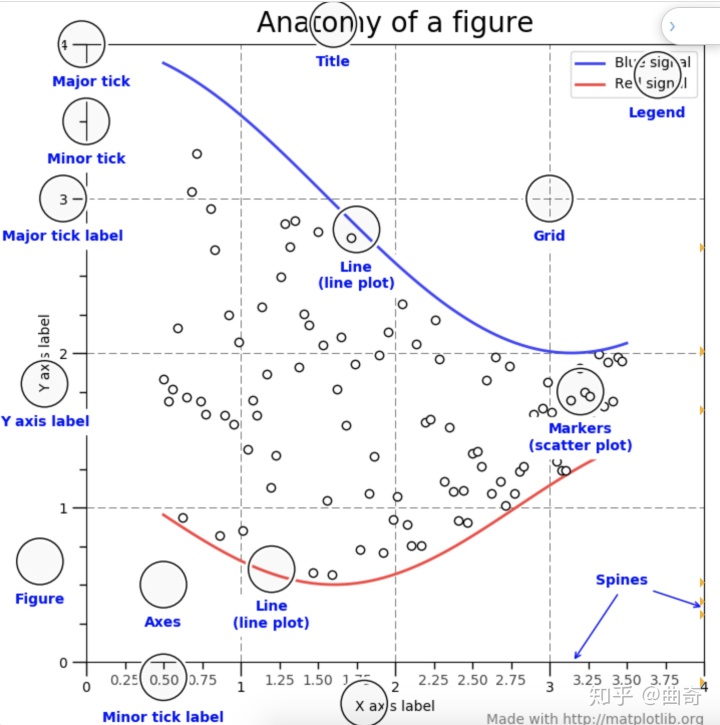
Figure
It is the whole picture, like the pop-up windows and Jupiter widgets, which are used to track all Axes, artists (titles, legend) and canvas (users don't touch it very much). A figure can contain any number of Axes, at least one. The simplest way to create a new figure is:
fig = plt.figure()  # an empty figure with no Axes
fig, ax = plt.subplots()  # a figure with a single Axes
fig, axs = plt.subplots(2, 2)  # a figure with a 2x2 grid of Axes
This is the simplest way to create axes, but you can add axes later to allow more complex axes layout s.
Axes
The area where data points are placed (x-y coordinates or x-y-z coordinates). Axes contains two or three Axis objects, which can control data limits (axes.Axes.set_xlim() and axes Axes. set_ ylim()).
Each axis has a title, x-label and y-label, respectively through (axes. Axes. Set_title(), axes Axes. set_ xlabel(),axes. Axes. set_ Ylabel (control)
The Axes class and its member methods are the main entry to object oriented.
Axis
It's the combination of numbers and lines below. Control limits, ticks, and ticktabs.
The location of ticks is determined by Locator Object controlled, ticklabel character string By Formatter Object controlled.
Artist
Basically, everything you see in the picture is an artist (including Figure, Axes and Axis objects) Text Object, Line2D Object, collections Object, Patch Objects, etc. All Artists are painted on canvas. Most Artists are bound to Axes, so an Artist cannot be shared by multiple Axes.
Type of input
Only numpy.array or numpy.ma.masked_array
Other objects like pandas or np.matrix Cannot be used as input. list can be automatically converted to array.
It can be changed into np.array
a = pandas.DataFrame(np.random.rand(4, 5), columns = list('abcde'))
a_asarray = a.values

b = np.matrix([[1, 2], [3, 4]])
b_asarray = np.asarray(b)
Object oriented interface and pyplot interface
There are two methods to use matplotlib. Many functions of the two methods are the same:
- Explicitly create figures and axes, and then call the methods of these objects.
- Rely on pyplot to automatically create and manage figures and axes, and then use pyplot function to draw pictures.
The following is OO style
x = np.linspace(0, 2, 100)

# Note that even in the OO-style, we use `.pyplot.figure` to create the figure.
fig, ax = plt.subplots()  # Create a figure and an axes.
ax.plot(x, x, label='linear')  # Plot some data on the axes.
ax.plot(x, x**2, label='quadratic')  # Plot more data on the axes...
ax.plot(x, x**3, label='cubic')  # ... and some more.
ax.set_xlabel('x label')  # Add an x-label to the axes.
ax.set_ylabel('y label')  # Add a y-label to the axes.
ax.set_title("Simple Plot")  # Add a title to the axes.
ax.legend()  # Add a legend.
Or pyplot style
x = np.linspace(0, 2, 100)

plt.plot(x, x, label='linear')  # Plot some data on the (implicit) axes.
plt.plot(x, x**2, label='quadratic')  # etc.
plt.plot(x, x**3, label='cubic')
plt.xlabel('x label')
plt.ylabel('y label')
plt.title("Simple Plot")
plt.legend()
matplotlib tutorials generally include OO or pyplot methods. Both methods can be used, but it should be noted that they should not be mixed. Usually, pyplot is used in interactive plotting like Jupiter notebook, and OO style is used in non interactive functions or scripts that can be reused in large projects.
There is also a pylab interface in the old version of matplotlib, which is rarely used now.
Sometimes it is necessary to reuse a drawing function with different data. The following function signature is recommended
def my_plotter(ax, data1, data2, param_dict):
    """
    A helper function to make a graph

    Parameters
    ----------
    ax : Axes
        The axes to draw to

    data1 : array
       The x data

    data2 : array
       The y data

    param_dict : dict
       Dictionary of kwargs to pass to ax.plot

    Returns
    -------
    out : list
        list of artists added
    """
    out = ax.plot(data1, data2, **param_dict)
    return out
Then use it like this
data1, data2, data3, data4 = np.random.randn(4, 100)
fig, ax = plt.subplots(1, 1)
my_plotter(ax, data1, data2, {'marker': 'x'})
Or two sub plots
fig, (ax1, ax2) = plt.subplots(1, 2)
my_plotter(ax1, data1, data2, {'marker': 'x'})
my_plotter(ax2, data3, data4, {'marker': 'o'})
backends
What is backend? Backend is to do all the complicated work to render the picture. There are two kinds of backends: user interface backend (pygtk, wxpython, tkinter, qt4, or macosx) and hardcopy backend (PNG, SVG, PDF, PS)
How to set the backend
Three, the priority is 1 < 2 < 3
- The rcParams["backend"] (default: 'agg') parameter in your matplotlibrc file
- The MPLBACKEND environment variable
- The function matplotlib.use()
import matplotlib as mpl
mpl.rcParams['backend'] = 'agg'
Or setting environment variables, not recommended
unix
> export MPLBACKEND=qt5agg
> python simple_plot.py

> MPLBACKEND=qt5agg python simple_plot.py
Or direct use use function , you need to use before any figure is created.
import matplotlib
matplotlib.use('qt5agg')
Generally speaking, matplotlib will automatically select the default backend to complete interactive work and drawing in scripts.
What is interactive mode
Interactive allows you to dynamically display changes to the drawing. Do an action to display one. These two methods can be used to control the interactive mode on and off. matplotlib.pyplot.ion(), matplotlib.pyplot.ioff().
Note that interactive mode can only be used in ipython or original python shell, and does not support IDLE IDE.
import matplotlib.pyplot as plt
plt.ion()
plt.plot([1.6, 2.7])
It can be refreshed and displayed immediately after action
plt.title("interactive test")
plt.xlabel("index")
You can also get the current Axes instance, and then call the instance method.
ax = plt.gca()
ax.plot([3.1, 2.2])
In certain backends (like macosx) or old versions of matplotlib, it may not be displayed immediately. You can call the plot.draw() method to update it.
non-interactive
import matplotlib.pyplot as plt
plt.ioff()
plt.plot([1.6, 2.7])
Nothing happens in this way (there may be pictures in Mac OS X). In order to see the pictures, you need to call plt.show(). After calling the show method, the show method executes the just input together, and then pauses the current process for a block. At this time, the terminal command is unresponsive unless you manually close the plot window. The advantage of this is that when you execute a script in the past, you haven't seen the picture, and it will disappear in a flash. In this way, the picture can stay and wait for your feedback.
In non interactive mode, all actions are delay ed until show function Call before execution.
The show function can be called multiple times. After the previous picture window is closed, the next picture will be displayed. (python shell)
import numpy as np
import matplotlib.pyplot as plt

plt.ioff()
for i in range(3):
    plt.plot(np.random.rand(10))
    plt.show()
Summary interactive and non interactive
- interactive pyplot automatic drawing If you use the OO method, call the draw() function to refresh
- Non-interactive It is convenient to generate one or more pictures in the script. Use the show() function to display all the pictures, and the block process will be suspended until the pictures are manually destroy ed.
performance
I don't think I use much
line simplify
import numpy as np
import matplotlib.pyplot as plt
import matplotlib as mpl

# Setup, and create the data to plot
y = np.random.rand(100000)
y[50000:] *= 2
y[np.geomspace(10, 50000, 400).astype(int)] = -1
mpl.rcParams['path.simplify'] = True

mpl.rcParams['path.simplify_threshold'] = 0.0
plt.plot(y)
plt.show()

mpl.rcParams['path.simplify_threshold'] = 1.0
plt.plot(y)
plt.show()
reference resources
https://matplotlib.org/tutorials/introductory/usage.html#sphx-glr-tutorials-introductory-usage-py