Micrometer provides a common API for performance monitoring data collection of JVM based applications and supports a variety of metric types, which can be used to observe, alert and respond to the current state of applications.
By adding the following dependencies, you can publish the service indicator data collected by Micrometer to Prometheus.
<dependency>
  <groupId>io.micrometer</groupId>
  <artifactId>micrometer-registry-prometheus</artifactId>
  <version>${micrometer.version}</version>
</dependency>
Of course, if you haven't determined which monitoring system to access, you can also directly rely on the micrometer core, and then create a simplemeter registry.
Accessible monitoring system
Micrometer has a set of modules containing various monitoring system implementations, each of which is called registry.
Before going into Micrometer, let's first look at three important features of the monitoring system:
-
Dimensionality: describes whether the system supports multi-dimensional data models.
Dimensional Hierarchical AppOptics, Atlas, Azure Monitor, Cloudwatch, Datadog, Datadog StatsD, Dynatrace, Elastic, Humio, Influx, KairosDB, New Relic, Prometheus, SignalFx, Sysdig StatsD, Telegraf StatsD, Wavefront Graphite, Ganglia, JMX, Etsy StatsD -
Rate Aggregation: refers to the aggregation of a group of samples within a specified time interval. One is to do Rate Aggregation at the client before sending the index data, and the other is to send the aggregation value directly.
Client-side Server-side AppOptics, Atlas, Azure Monitor, Datadog, Elastic, Graphite, Ganglia, Humio, Influx, JMX, Kairos, New Relic, all StatsD flavors, SignalFx Prometheus, Wavefront -
Publishing: it describes the publishing method of indicator data. One is that the client regularly pushes the data to the monitoring system, and the other is that the monitoring system calls the client interface to pull the data in idle time.
Client pushes Server polls AppOptics, Atlas, Azure Monitor, Datadog, Elastic, Graphite, Ganglia, Humio, Influx, JMX, Kairos, New Relic, SignalFx, Wavefront Prometheus, all StatsD flavors
Registry
Meter is an interface used to collect various indicator data of the application. All Meters in Micrometer are created and managed through MeterRegistry. Each monitoring system supported by Micrometer has a corresponding MeterRegistry implementation.
The simplest Register is simplemeter Registry (automatically assembled in spring based applications). It will save the latest value of each meter in memory, but will not publish the value anywhere.
MeterRegistry registry = new SimpleMeterRegistry();
Composite Registries
Micrometer provides a compositemeter registry, which allows developers to publish indicator data to multiple monitoring systems at the same time by adding multiple registries.
CompositeMeterRegistry composite = new CompositeMeterRegistry();

Counter compositeCounter = composite.counter("counter");
// Here, the increment statement is in a waiting state until a registry is registered by CompositeMeterRegistry.
// At this time, the counter counter value is 0
compositeCounter.increment(); (1)

SimpleMeterRegistry simple = new SimpleMeterRegistry();
// The counter counter is registered in the simple registry
composite.add(simple); (2)

// simple registry counter is incremented together with counters of other registries in CompositeMeterRegistry
compositeCounter.increment(); (3)
Global Registry
Micrometer provides a global registry, metrics Global Registry, which is also a compositemeter registry, internally provides a series of methods for building meters.
public class Metrics {
    public static final CompositeMeterRegistry globalRegistry = new CompositeMeterRegistry();
    private static final More more = new More();

    /**
     * When using metrics After you build meters using methods such as counter (...), you can add a registry to the global registry
     * These meters are added to each registry
     *
     * @param registry Registry to add.
     */
    public static void addRegistry(MeterRegistry registry) {
        globalRegistry.add(registry);
    }

    /**
     * Remove a registry from the global composite registry. Removing a registry does not remove any meters
     * that were added to it by previous participation in the global composite.
     *
     * @param registry Registry to remove.
     */
    public static void removeRegistry(MeterRegistry registry) {
        globalRegistry.remove(registry);
    }

    /**
     * Tracks a monotonically increasing value.
     *
     * @param name The base metric name
     * @param tags Sequence of dimensions for breaking down the name.
     * @return A new or existing counter.
     */
    public static Counter counter(String name, Iterable<Tag> tags) {
        return globalRegistry.counter(name, tags);
    }

    ...
}
Custom Registry
Micrometer provides us with many out of the box registries, which can basically meet most business scenarios. At the same time, users can customize the registry according to the actual scene requirements.
Usually, we can create customized registries by inheriting MeterRegistry, PushMeterRegistry, or StepMeterRegistry.
// Custom registry config
public interface CustomRegistryConfig extends StepRegistryConfig {

  CustomRegistryConfig DEFAULT = k -> null;

  @Override
  default String prefix() {
    return "custom";
  }

}


// Custom registry
public class CustomMeterRegistry extends StepMeterRegistry {

  public CustomMeterRegistry(CustomRegistryConfig config, Clock clock) {
    super(config, clock);

    start(new NamedThreadFactory("custom-metrics-publisher"));
  }

  @Override
  protected void publish() {
    getMeters().stream().forEach(meter -> System.out.println("Publishing " + meter.getId()));
  }

  @Override
  protected TimeUnit getBaseTimeUnit() {
    return TimeUnit.MILLISECONDS;
  }

}

/**
 *
 */
@Configuration
public class MetricsConfig {

  @Bean
  public CustomRegistryConfig customRegistryConfig() {
    return CustomRegistryConfig.DEFAULT;
  }

  @Bean
  public CustomMeterRegistry customMeterRegistry(CustomRegistryConfig customRegistryConfig, Clock clock) {
    return new CustomMeterRegistry(customRegistryConfig, clock);
  }

}
Meters
Micrometer supports many types of metrics, including timer, counter, gauge, distributionsummary, longtask timer, functioncounter, functiontimer and TimeGauge.
In Micrometer, a meter is uniquely determined by its name and dimension (dimensions, also known as "tags", i.e. Tag tag in API). The introduction of the concept of dimension is convenient for us to split a certain indicator data more finely.
Naming Meters
Each monitoring system has its own naming style, and the naming rules between different systems may be incompatible. The naming convention adopted by Micrometer is through To separate lowercase words. In Micrometer, this will be implemented for different implementations of each monitoring system The naming style of separated words is converted into the naming convention recommended by each monitoring system, and the special characters prohibited in naming will also be removed.
// Micrometer naming convention
registry.timer("http.server.requests");

// Prometheus naming convention
registry.timer("http_server_requests_duration_seconds");

// Atlas naming convention
registry.timer("httpServerRequests");

// Graphite naming convention
registry.timer("http.server.requests");

// InfluxDB naming convention
registry.timer("http_server_requests");
Of course, we can override the default naming convention rules by implementing the NamingConvention interface:
registry.config().namingConvention(myCustomNamingConvention);
Tag Naming
For Tag naming, it is also recommended to separate lowercase words with dots consistent with meter, which is also helpful to convert the naming style into the naming mode recommended by each monitoring system.
Recommended writing
registry.counter("database.calls", "db", "users")
registry.counter("http.requests", "uri", "/api/users")
This naming method provides sufficient context semantics for us to analyze the data. It is assumed that if we only analyze the data through name, the data obtained is also meaningful. For example, select database Call, then we can get access to all databases. Next, if you want to conduct in-depth analysis, you can further filter the data through Tag db.
Error example
registry.counter("calls",
    "class", "database",
    "db", "users");

registry.counter("calls",
    "class", "http",
    "uri", "/api/users");
Let's take another look at the above naming method. At this time, if you only view the data through the name attribute calls, you will get all the indicator data including db access and http call. Obviously, this kind of data is meaningless for us to analyze production problems. We need to further select the class tag to refine the data dimension.
Common Tags
common tags belong to the registry level tag, which will be applied to all metric s reported to the monitoring system. Such tags are usually some attributes of the system dimension, such as host, instance, region, stack information, etc.
registry.config().commonTags("stack", "prod", "region", "us-east-1");
registry.config().commonTags(Arrays.asList(Tag.of("stack", "prod"), Tag.of("region", "us-east-1"))); // equivalently
common tags must be added to the registry before adding any meter.
Tag Values
First, tag values cannot be empty.
In addition, we also need to normalize the tag value and limit its possible values. For example, for 404 exception responses in HTTP requests, you can set the response value of such exceptions to return not uniformly_ Found, otherwise, the measurement dimension of indicator data will increase with the increase of the number of such resource not found exceptions, resulting in the aggregation of indicator data becoming very discrete.
Meter Filters
Meter Filter is used to control the time of meter registration and the types of statistics that can be published. We can configure filters for each registry.
The filter provides the following three basic functions:
- Reject / accept meter registration.
- Change the ID information of meter (io.micrometer.core.instrument.Meter.Id)
- Configure distribution statistics for certain types of meter s.
registry.config()
    // Multiple filter configurations take effect sequentially
    .meterFilter(MeterFilter.ignoreTags("too.much.information"))
    .meterFilter(MeterFilter.denyNameStartsWith("jvm"));
Reject / accept Meters
It is used to configure that only specified forms of meters are accepted, or some meters are masked.
new MeterFilter() {
    @Override
    public MeterFilterReply accept(Meter.Id id) {
       if(id.getName().contains("test")) {
          return MeterFilterReply.DENY;
       }
       return MeterFilterReply.NEUTRAL;
    }
}


public enum MeterFilterReply {
    // If the meter registration request is rejected, the registry will return a NOOP version of the meter (such as NoopCounter and NoopTimer)
    DENY,

    // When no filter returns DENY, the meter registration process continues
    NEUTRAL,

    // Indicates that the meter registration is successful, and there is no need to continue to flow down the accept(...) of "ask" other filter s method
    ACCEPT
}
For the deny/accept policy of Meter, MeterFilter provides us with some common methods:
- accept(): accept all meter registrations. Any filter after this method is invalid.
- Accept (predict < meter. ID >): receive meter registration that meets the given conditions.
- acceptNameStartsWith(String): receives meter registration with name starting with the specified character.
- deny(): all meter registration requests are rejected. Any filter after this method is invalid.
- denyNameStartsWith(String): reject the registration request of all meter s whose name starts with the specified string.
- Deny (predict < meter. ID >): refuse the registration request of a meter that meets specific conditions.
- maximumAllowableMetrics(int): when the number of registered meters reaches the maximum allowed registration limit, all subsequent registration requests are rejected.
- maximumAllowableTags(String meterNamePrefix, String tagKey, int maximumTagValues, MeterFilter onMaxReached): sets an upper limit of tags. When the upper limit is reached, subsequent registration requests are rejected.
- Denyunless (predict < meter. ID >): a whitelist mechanism that rejects the registration requests of all meters that do not meet the given conditions.
Change the ID information of Meter
new MeterFilter() {
    @Override
    public Meter.Id map(Meter.Id id) {
       if(id.getName().startsWith("test")) {
          return id.withName("extra." + id.getName()).withTag("extra.tag", "value");
       }
       return id;
    }
}
Common methods:
- Commontags (iterative < tag >): add a set of public tags for all indicators. It is generally recommended that developers add public tags for application name, host, region and other information.
- ignoreTags(String...): used to remove the specified tag key from all meter s. For example, when we find that a tag has too high cardinality and has put pressure on the monitoring system, we can give priority to this method to quickly reduce the pressure on the system on the premise that all detection points cannot be changed immediately.
- Replacetagvalues (string tagkey, function < string, string > replacement, string... exceptions): replace all tag values that meet the specified conditions. In this way, you can the cardinality size of a tag.
- renameTag(String meterNamePrefix, String fromTagKey, String toTagKey): renames the tag key s of all metric named with the given prefix.
Configure distribution statistics
new MeterFilter() {
    @Override
    public DistributionStatisticConfig configure(Meter.Id id, DistributionStatisticConfig config) {
        if (id.getName().startsWith(prefix)) {
            return DistributionStatisticConfig.builder()
                    // The request whose ID name starts with the specified prefix provides indicator statistical histogram information
                    .publishPercentiles(0.9, 0.95)
                    .build()
                    .merge(config);
        }
        return config;
    }
};
Rate polymerization
Rate aggregation can be completed on the client before the index data is published, or it can be temporarily aggregated on the server as part of the server query. Micrometer can be used according to the style of each monitoring system
Not all indicators need to be published or viewed as a rate. For example, neither the gauge value nor the number of active tasks in a long-term scheduled task is a rate.
Server aggregation
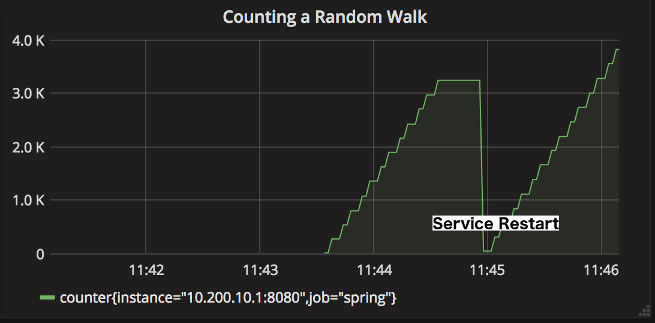
The monitoring system that performs the server rate calculation expects to report the absolute value of the count at each release interval. For example, from the start of the application, the counter counter is the absolute sum of all increments generated at each publishing interval.
When the service restarts, the counter count will drop to zero. Once the new service instance is started successfully, the rate aggregation graph will return to a value of about 55.
The following figure shows a counter without rate aggregation. This counter is almost useless because it only reflects the growth rate of the counter over time.
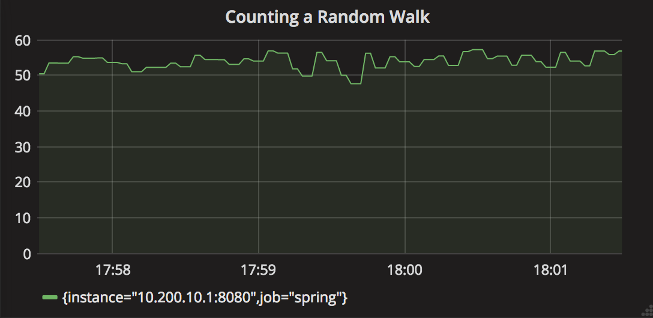
Through the comparison of the above diagrams, it can be found that if we realize zero downtime deployment (e.g. red black deployment) in the actual production environment, we can realize service anomaly monitoring by setting the minimum alarm threshold of the rate aggregation curve (in the zero downtime deployment environment, there is no need to worry about the decrease of counter count due to service restart).
Client aggregation
In practical application, the following two types of monitoring systems expect the client to complete rate aggregation before publishing index data.
- Expect aggregate data. In most cases in the production environment, we need to make decisions based on the rate of service indicators. In this case, the server needs to do less calculations to meet the query requirements.
- Only a few or no mathematical calculations in the query phase allow us to do rate aggregation. For these systems, it is very meaningful to publish a pre aggregated data.
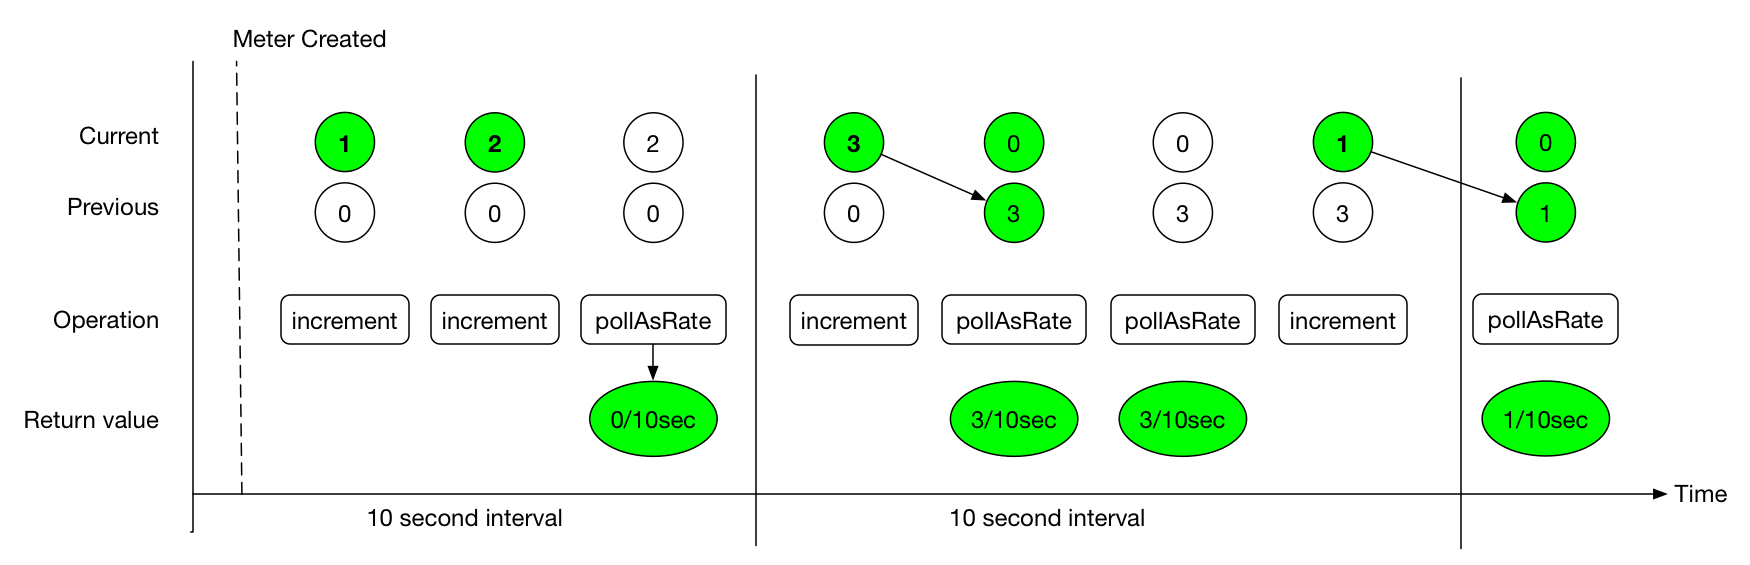
The Timer of Micrometer will record the count value and totalTime value respectively. For example, the publishing interval we configured is 10s, and then there are 20 requests. The time consumption of each request is 100ms. Then, for the first time interval:
- count = 10 seconds * (20 requests / 10 seconds) = 20 requests;
- totalTime = 10 seconds _ (20 _ 100 ms / 10 seconds) = 2 seconds.
count statistics represents the throughput information of the service, and totalTime represents the total time consumption of all requests in the whole time interval.
totalTime / count = 2 seconds / 20 requests = 0.1 seconds / request = 100 ms / request indicates the average delay of all requests.
Indicator type
Counters
Counters is used to report a single count indicator. The Counter interface allows you to increment by a fixed positive value.
When using counter to build charts and alarms, we are usually most interested in the rate at which events occur within a given time interval. For example, given a queue, we can use counter to measure the speed at which data items are written to and removed from the queue.
Normal rand = ...; // a random generator

MeterRegistry registry = ...
Counter counter = registry.counter("counter"); (1)

Flux.interval(Duration.ofMillis(10))
        .doOnEach(d -> {
            if (rand.nextDouble() + 0.1 > 0) { (2)
                counter.increment(); (3)
            }
        })
        .blockLast();

// counter streaming call
Counter counter = Counter
    .builder("counter")
    .baseUnit("beans") // optional
    .description("a description of what this counter does") // optional
    .tags("region", "test") // optional
    .register(registry);
Gauges
gauge is used to get the current value. Common application scenarios, such as real-time statistics of the number of currently running threads.
gauge is useful for monitoring attributes with natural upper limits. It is not suitable for counting the number of requests of the application, because the number of requests will extend indefinitely as the service life cycle increases.
Never use gauge to measure data that could have been counted with counter.
List<String> list = registry.gauge("listGauge", Collections.emptyList(), new ArrayList<>(), List::size); (1)
List<String> list2 = registry.gaugeCollectionSize("listSize2", Tags.empty(), new ArrayList<>()); (2)
Map<String, Integer> map = registry.gaugeMapSize("mapGauge", Tags.empty(), new HashMap<>());

// maintain a reference to myGauge
AtomicInteger myGauge = registry.gauge("numberGauge", new AtomicInteger(0));

// ... elsewhere you can update the value it holds using the object reference
myGauge.set(27);
myGauge.set(11);
There is also a special type of gauge multigauge, which can publish a set of metric s at a time.
// SELECT count(*) from job group by status WHERE job = 'dirty'
MultiGauge statuses = MultiGauge.builder("statuses")
    .tag("job", "dirty")
    .description("The number of widgets in various statuses")
    .baseUnit("widgets")
    .register(registry);

...

// run this periodically whenever you re-run your query
statuses.register(
    resultSet.stream()
        .map(result -> Row.of(Tags.of("status", result.getAsString("status")), result.getAsInt("count"))));
Timers
Timer is used to measure the event delay and response frequency in a short time. All timer implementations record the total time taken for event response and the total number of events. Timer does not support negative numbers. In addition, if it is used to record large quantities and long delay events, it is easy to cause the index value data to exceed the limit (exceeding Long.MAX_VALUE).
public interface Timer extends Meter {
    ...
    void record(long amount, TimeUnit unit);
    void record(Duration duration);
    double totalTime(TimeUnit unit);
}
The maximum statistical value defined in the basic implementation of Timer (such as CumulativeTimer and StepTimer) refers to the maximum value in a time window (TimeWindowMax). If no new value is recorded within the time window, the maximum value will be reset to zero as a new time window begins.
The time window size is the step size defined by MeterRegistry by default, or through expiration (...) in DistributionStatisticConfig Method is set explicitly.
/**
 * @return The step size to use in computing windowed statistics like max. The default is 1 minute.
 * To get the most out of these statistics, align the step interval to be close to your scrape interval.
 */
default Duration step() {
    // The default step of PrometheusMeterRegistry is one minute
    return getDuration(this, "step").orElse(Duration.ofMinutes(1));
}


// You can also customize the step size through DistributionStatisticConfig
public class DistributionStatisticConfig implements Mergeable<DistributionStatisticConfig> {
    public static final DistributionStatisticConfig DEFAULT = builder()
            .percentilesHistogram(false)
            .percentilePrecision(1)
            .minimumExpectedValue(1.0)
            .maximumExpectedValue(Double.POSITIVE_INFINITY)
            .expiry(Duration.ofMinutes(2))
            .bufferLength(3)
            .build();

     ...
}


public Builder expiry(@Nullable Duration expiry) {
    config.expiry = expiry;
    return this;
}
Timer.Sample
It can be used to count the execution time of the method. Before the method starts to execute, record the time stamp of the start time through sample, and then complete the timing task by calling stop when the method is executed.
Timer.Sample sample = Timer.start(registry);

// do stuff
Response response = ...

sample.stop(registry.timer("my.timer", "response", response.status()));
@Timed
@Timed can be added to any method, including Web methods. After adding this annotation, the method timing function can be supported.
@ Timed is not recognized in the Spring Boot configuration of Micrometer.
An AspectJ aspect is provided in the micrometer core, which enables us to make the @ Timed annotation available on any method through Spring AOP.
@Configuration
public class TimedConfiguration {
   @Bean
   public TimedAspect timedAspect(MeterRegistry registry) {
      return new TimedAspect(registry);
   }
}


@Service
public class ExampleService {

  @Timed
  public void sync() {
    // @Timed will record the execution time of this method,
    // from the start and until it exits normally or exceptionally.
    ...
  }

  @Async
  @Timed
  public CompletableFuture<?> async() {
    // @Timed will record the execution time of this method,
    // from the start and until the returned CompletableFuture
    // completes normally or exceptionally.
    return CompletableFuture.supplyAsync(...);
  }

}
Distribution Summaries
The distributed summary records the distribution of events, which is similar to Timer in structure, but it does not record the value in a time unit. For example, we can record the size of the request load hitting the server through the distributed summary.
You can create a distributed summary by:
DistributionSummary summary = registry.summary("response.size");

DistributionSummary summary = DistributionSummary
    .builder("response.size")
    .description("a description of what this summary does") // optional
    .baseUnit("bytes") // optional (1)
    .tags("region", "test") // optional
    .scale(100) // optional (2)
    .register(registry);
Long Task Timers
The long task timer is a special timer that allows you to measure time while the detected task is still running. A normal timer records the duration of a task only when it is completed.
The long task timer counts the following data:
- Number of active tasks;
- Total duration of all active tasks;
- Maximum duration in an active task.
Unlike the Timer, the long task Timer does not publish statistics about completed tasks.
Imagine a scenario where a background process periodically refreshes the data in the database into the metadata. Under normal circumstances, the whole refresh task can be completed in a few minutes. Once the service is abnormal, the refresh task may take a long time. At this time, the long task timer can be used to record the total active time of refreshing data.
@Timed(value = "aws.scrape", longTask = true)
@Scheduled(fixedDelay = 360000)
void scrapeResources() {
    // find instances, volumes, auto-scaling groups, etc...
}
If your framework does not support @ Timed, you can create a long task timer as follows.
LongTaskTimer scrapeTimer = registry.more().longTaskTimer("scrape");
void scrapeResources() {
    scrapeTimer.record(() => {
        // find instances, volumes, auto-scaling groups, etc...
    });
}
Another point to note is that if we want to trigger an alarm when the process exceeds the specified threshold, when using the long task Timer, we can receive an alarm within the first reporting interval after the task exceeds the specified threshold. If you use a regular Timer, you can only receive an alarm at the first reporting interval after the task ends. At this time, it may have been a long time.
Histograms
Timer and distribution summaries support data collection to observe the proportion of data distribution. There are usually two ways to view the proportion:
-
Percentile histograms: Micrometer first accumulates all values into an underlying histogram, and then sends a set of predetermined buckets to the monitoring system. The query language of the monitoring system is responsible for calculating the percentile of this histogram.
At present, only Prometheus, Atlas, and Wavefront support histogram based percentage approximation calculation (through histogram_quantile,: percentile, and hs()). If you choose the above monitoring systems, this method is recommended because it can realize cross dimensional aggregation of histograms and obtain the aggregatable percentage from the histograms.
-
Client side percentiles: Micrometer is responsible for calculating the approximate percentage under each meter ID, and then sending it to the monitoring system. This display is not as flexible as Percentile histograms because it does not support cross dimensional aggregation of percentage approximations.
However, this method provides some insight into the percentage distribution to those monitoring systems that do not support percentage calculation based on histogram on the server side.
Timer.builder("my.timer")
   .publishPercentiles(0.5, 0.95) // Used to set the percentage value calculated in the application. It cannot be aggregated across dimensions
   .publishPercentileHistogram() // (2)
   .serviceLevelObjectives(Duration.ofMillis(100)) // (3)
   .minimumExpectedValue(Duration.ofMillis(1)) // (4)
   .maximumExpectedValue(Duration.ofSeconds(10))
Access Prometheus
Prometheus periodically pulls indicator data from application instances based on the service discovery mode. It supports user-defined query language and mathematical operations.
-
When accessing Prometheus, you first need to introduce the following maven dependencies:
<dependency> <groupId>io.micrometer</groupId> <artifactId>micrometer-registry-prometheus</artifactId> <version>${micrometer.version}</version> </dependency> -
When creating the Prometheus Registry, you need to expose an HTTP endpoint to the Prometheus scraper for data pulling.
PrometheusMeterRegistry prometheusRegistry = new PrometheusMeterRegistry(PrometheusConfig.DEFAULT); try { HttpServer server = HttpServer.create(new InetSocketAddress(8080), 0); server.createContext("/prometheus", httpExchange -> { String response = prometheusRegistry.scrape(); (1) httpExchange.sendResponseHeaders(200, response.getBytes().length); try (OutputStream os = httpExchange.getResponseBody()) { os.write(response.getBytes()); } }); new Thread(server::start).start(); } catch (IOException e) { throw new RuntimeException(e); } -
Set the pulled data format. By default, the script () method of Prometheus meterregistry returns the default text format of Prometheus. Starting with Micrometer 1.7.0, you can also specify the data format as follows OpenMetrics Defined data format:
String openMetricsScrape = registry.scrape(TextFormat.CONTENT_TYPE_OPENMETRICS_100);
-
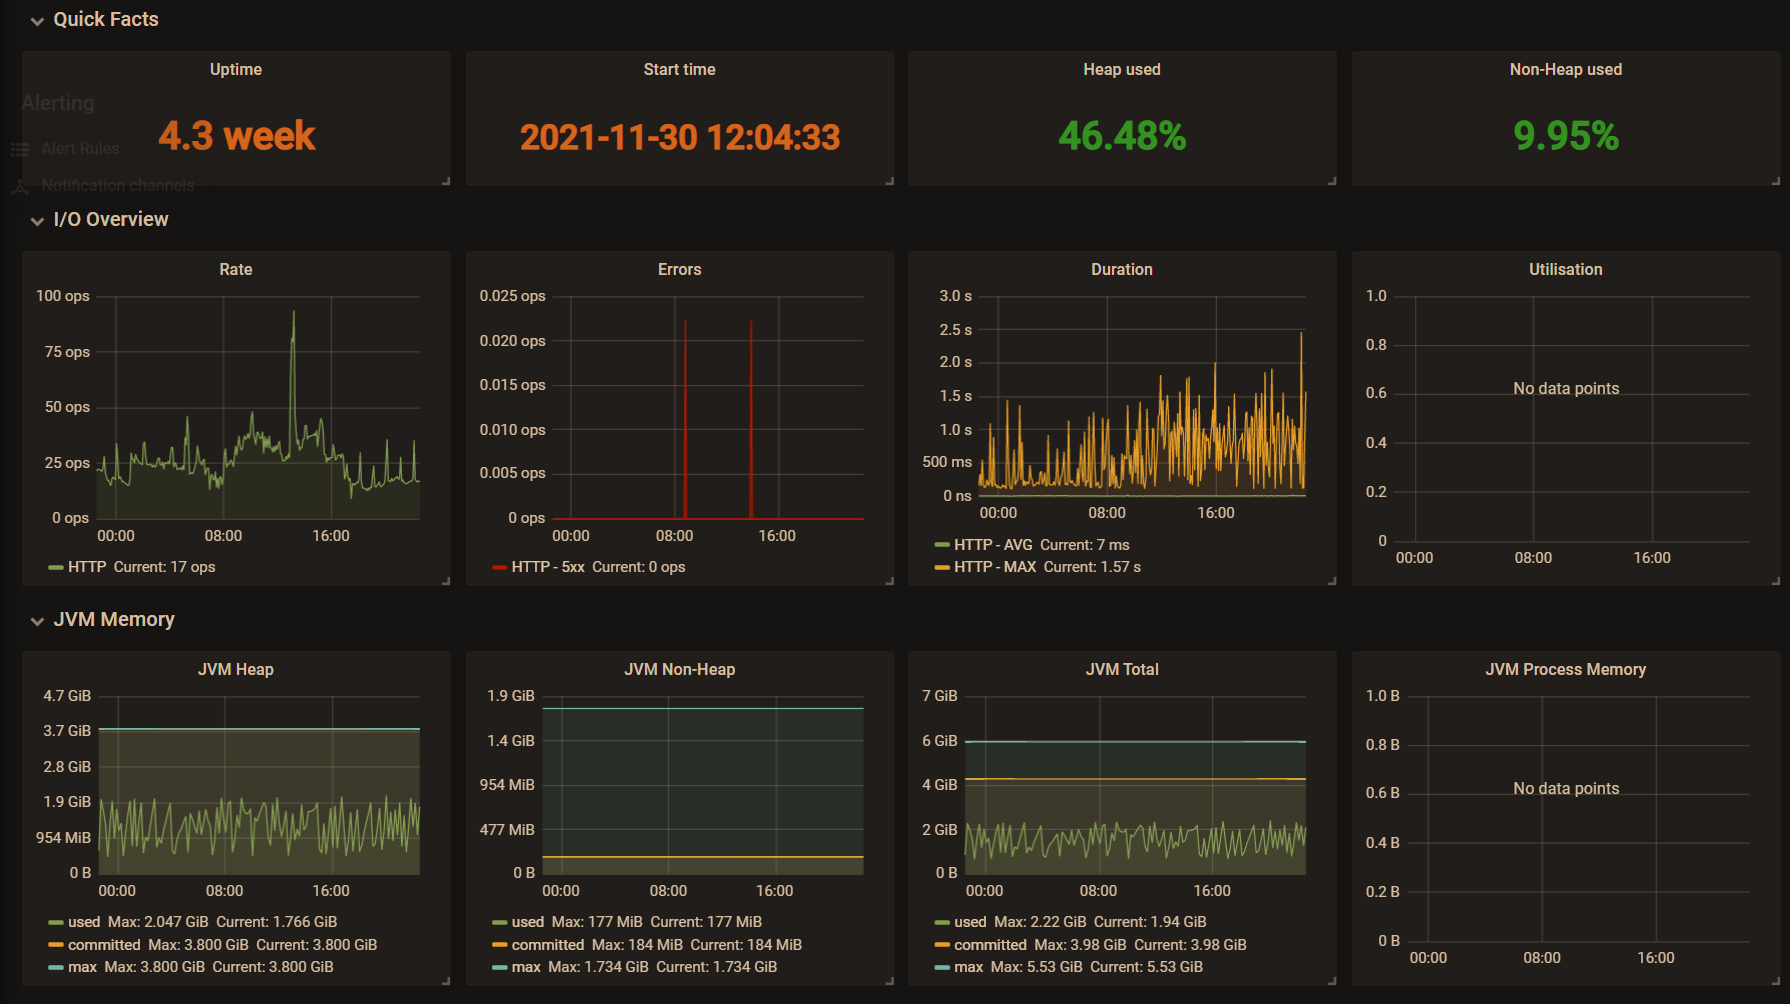
Graphical display. The indicator data captured by Prometheus is displayed in the Grafana panel. The figure below uses an officially published Grafana dashboard template( JVM-dashboard)
How to use in SpringBoot
-
Spring Boot Actuator provides dependency management and automatic configuration for Micrometer. The following configurations need to be introduced first:
<dependency>
  <groupId>org.springframework.boot</groupId>
  <artifactId>spring-boot-starter-actuator</artifactId>
</dependency>
<dependency>
  <groupId>io.micrometer</groupId>
  <artifactId>micrometer-registry-prometheus</artifactId>
</dependency>
<dependency>
  <groupId>org.springframework</groupId>
  <artifactId>spring-aop</artifactId>
</dependency>
<dependency>
  <groupId>org.aspectj</groupId>
  <artifactId>aspectjweaver</artifactId>
</dependency>
Next, configure the registry through the MeterRegistryCustomizer. For example, configure the registry level public tag attribute before the meter is registered with the registry.
@Configuration public class MicroMeterConfig { @Bean public MeterRegistryCustomizer<MeterRegistry> meterRegistryCustomizer() { return meterRegistry -> meterRegistry.config().commonTags(Collections.singletonList(Tag.of("application", "mf-micrometer-example"))); } // @ Timed cannot be used directly in Spring Boot. TimedAspect aspect support needs to be introduced. @Bean public TimedAspect timedAspect(MeterRegistry registry) { return new TimedAspect(registry); } } @RequestMapping("health") @RestController public class MetricController { @Timed(percentiles = {0.5, 0.80, 0.90, 0.99, 0.999}) @GetMapping("v1") public ApiResp health(String message) { try { Thread.sleep(new Random().nextInt(1000)); } catch (InterruptedException e) { e.printStackTrace(); } return ApiResp.ok(new JSONObject().fluentPut("message", message)); } @GetMapping("v2") @Timed(percentiles = {0.5, 0.80, 0.90, 0.99, 0.999}) public ApiResp ping() { return ApiResp.ok(new JSONObject().fluentPut("message", "OK")); } } -
Spring Boot provides a / Actor / promethues endpoint by default for pulling service indicator data. The data exposed by the endpoint may contain application sensitive data. The following configuration can limit the endpoint data exposure (the exclude priority is higher than the include priority).
Property Default management.endpoints.jmx.exposure.exclude management.endpoints.jmx.exposure.include * management.endpoints.web.exposure.exclude management.endpoints.web.exposure.include health -
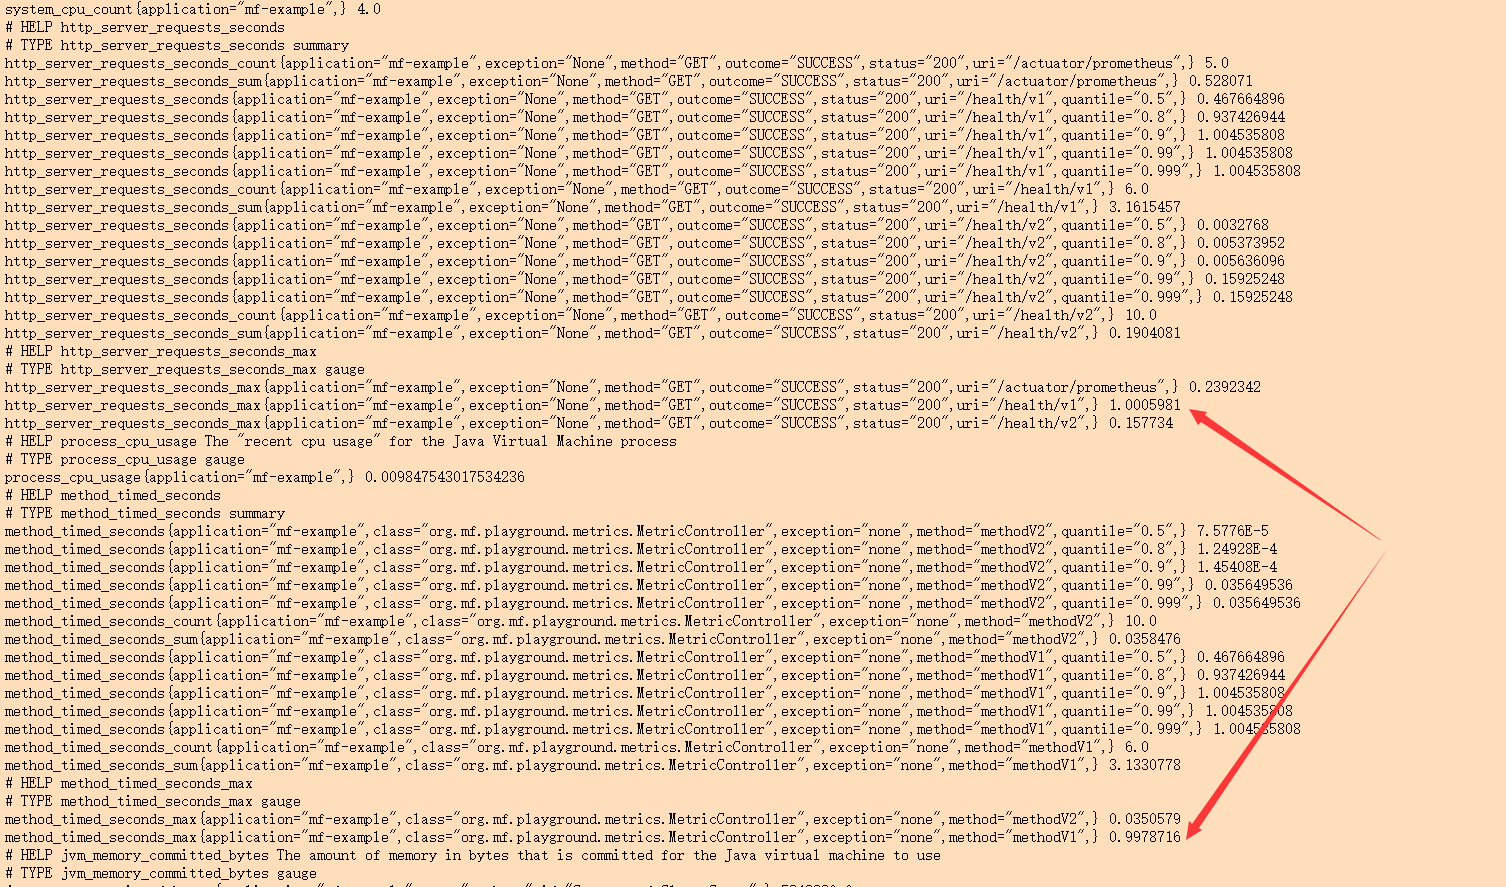
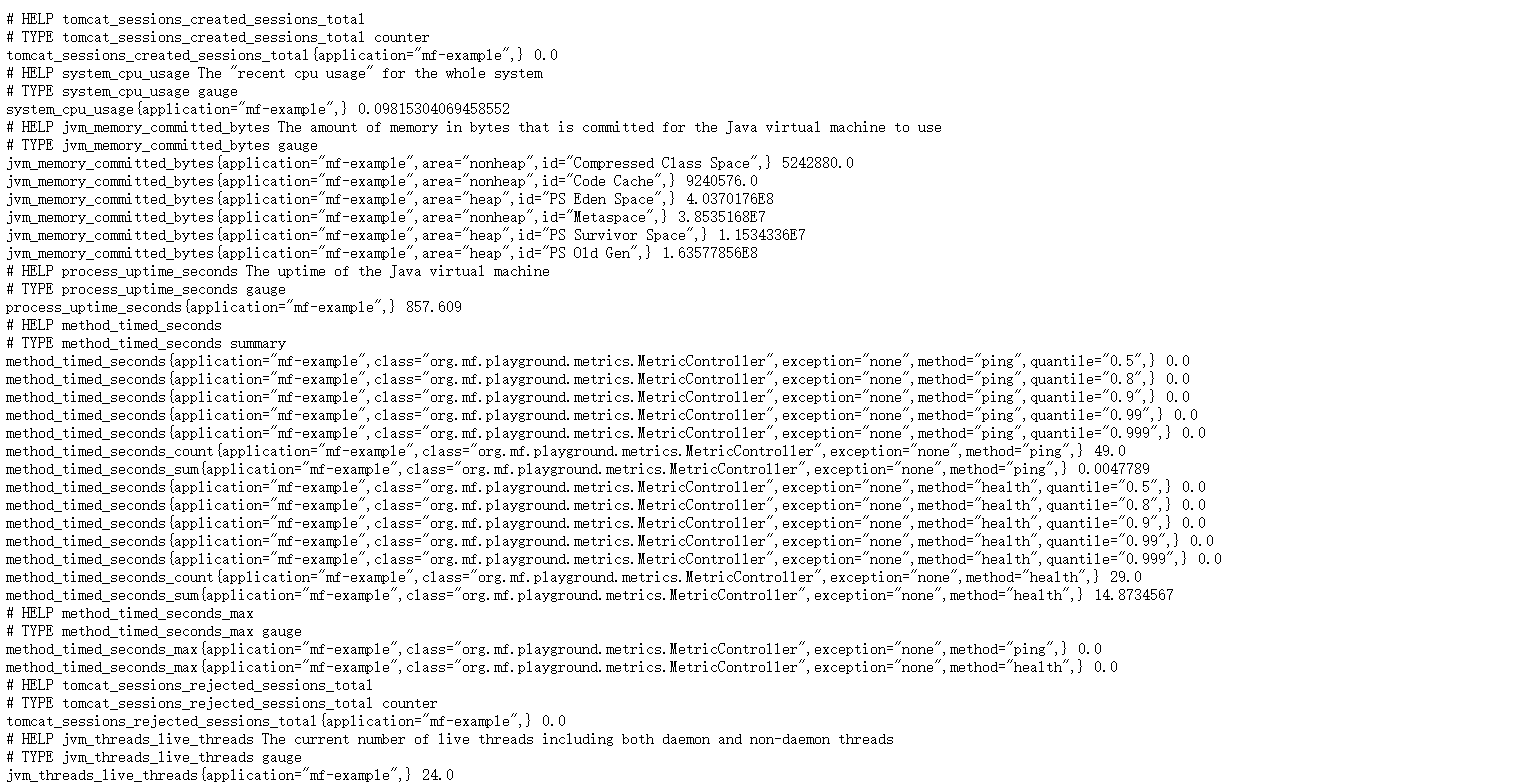
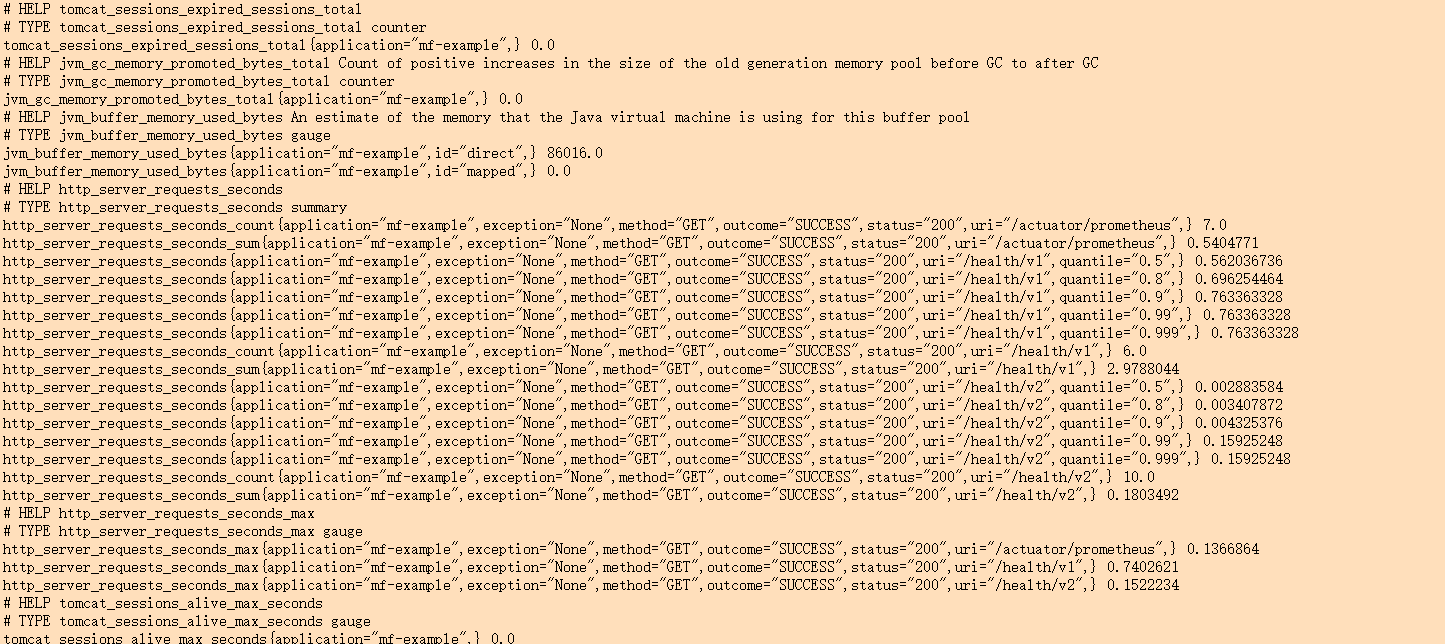
Start service, access http://localhost:8800/actuator/prometheus You can see the following service indicator data:
-
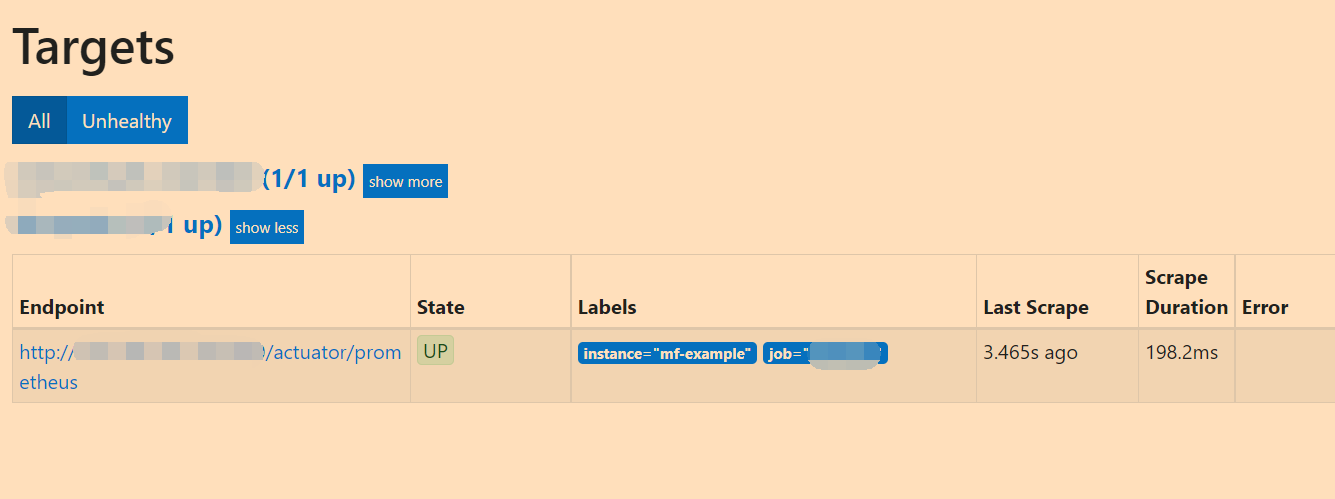
Next, you can configure Prometheus in Prometheus Add the following to YML:
# my global config
global:
  scrape_interval:     15s # Set the scrape interval to every 15 seconds. Default is every 1 minute.
  evaluation_interval: 15s # Evaluate rules every 15 seconds. The default is every 1 minute.
  # scrape_timeout is set to the global default (10s).

# Alertmanager configuration
alerting:
  alertmanagers:
  - static_configs:
    - targets:
      # - alertmanager:9093

# Load rules once and periodically evaluate them according to the global 'evaluation_interval'.
rule_files:
  # - "first_rules.yml"
  # - "second_rules.yml"

# A scrape configuration containing exactly one endpoint to scrape:
# Here it's Prometheus itself.
scrape_configs:
  # The job name is added as a label `job=<job_name>` to any timeseries scraped from this config.
  - job_name: 'mf-micrometer-example'
    scrape_interval: 5s
    metrics_path: '/actuator/prometheus'
    static_configs:
      - targets: ['127.0.0.1:8800']
        labels:
           instance: 'mf-example'
Access the Prometheus console( http://localhost:9090 ), you can see all clients currently connected to this Prometheus and their status in the Targets page.
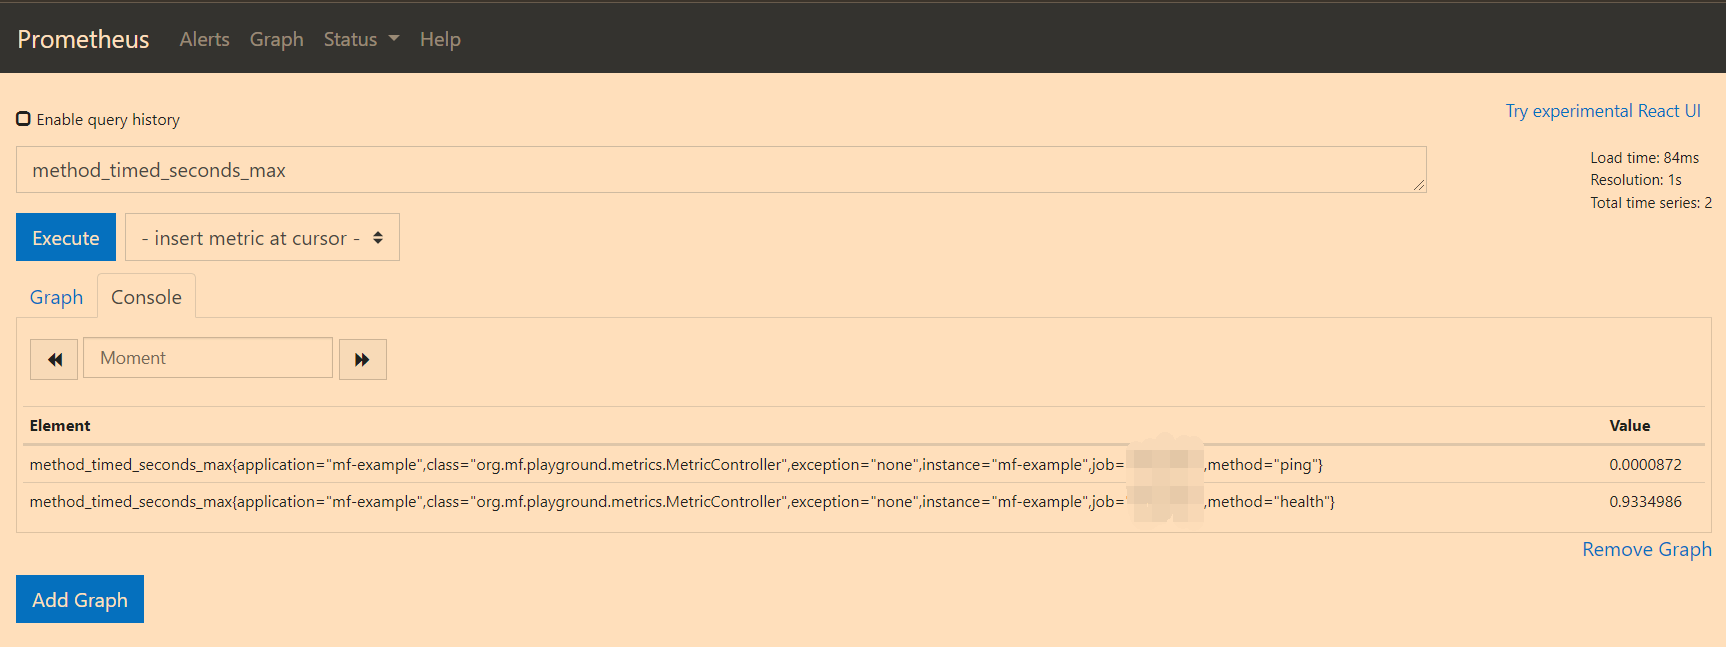
At the same time, in the Graph interface, you can query the indicator data of specified conditions through query statements:
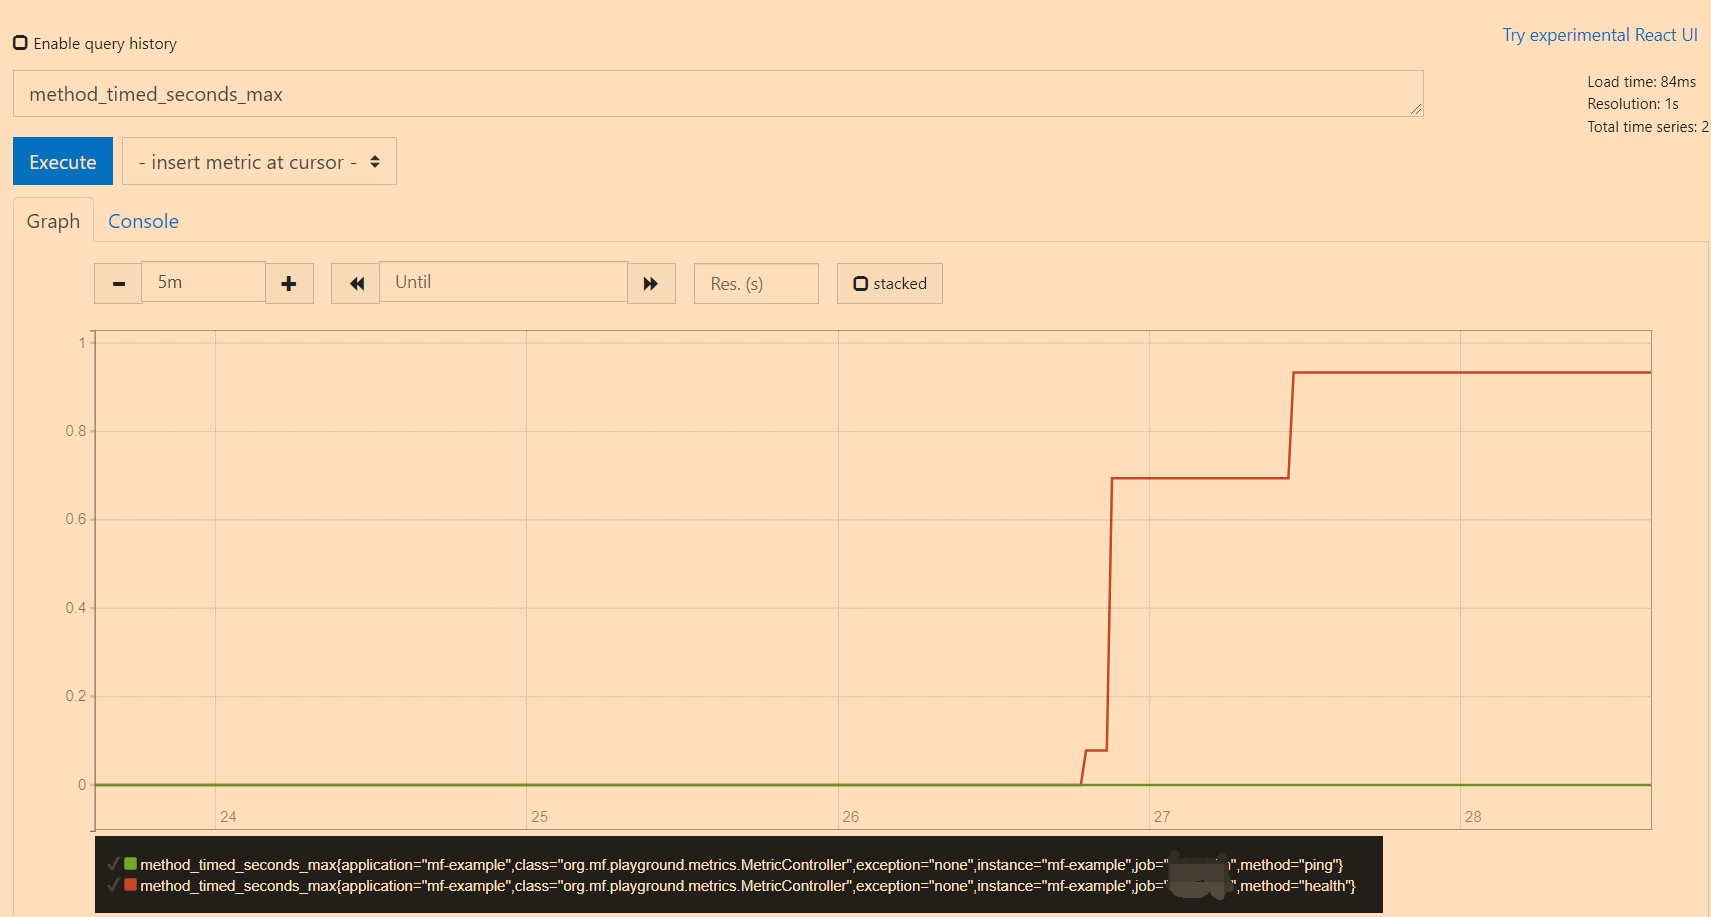
-
At this step, we have completed the measurement and capture of service indicator data. Finally, we need to graphically display the data captured by Prometheus. Here we use Grafana.
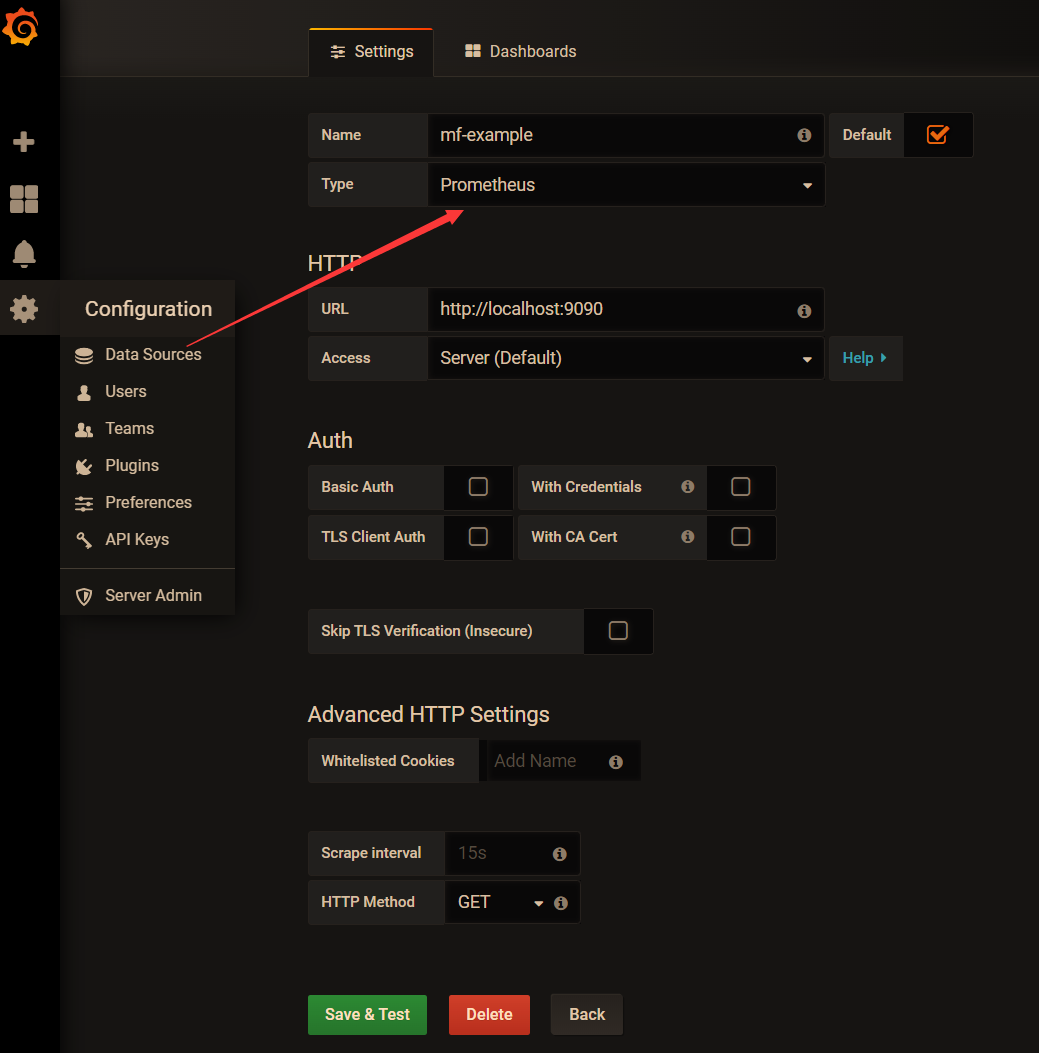
-
First, create a data source. Grafana supports multiple data source access. Here we choose Prometheus.
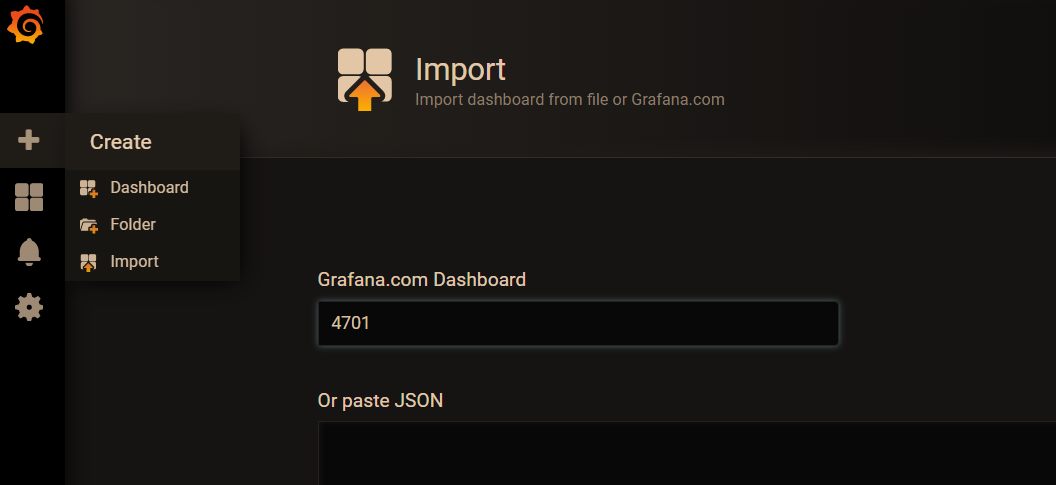
-
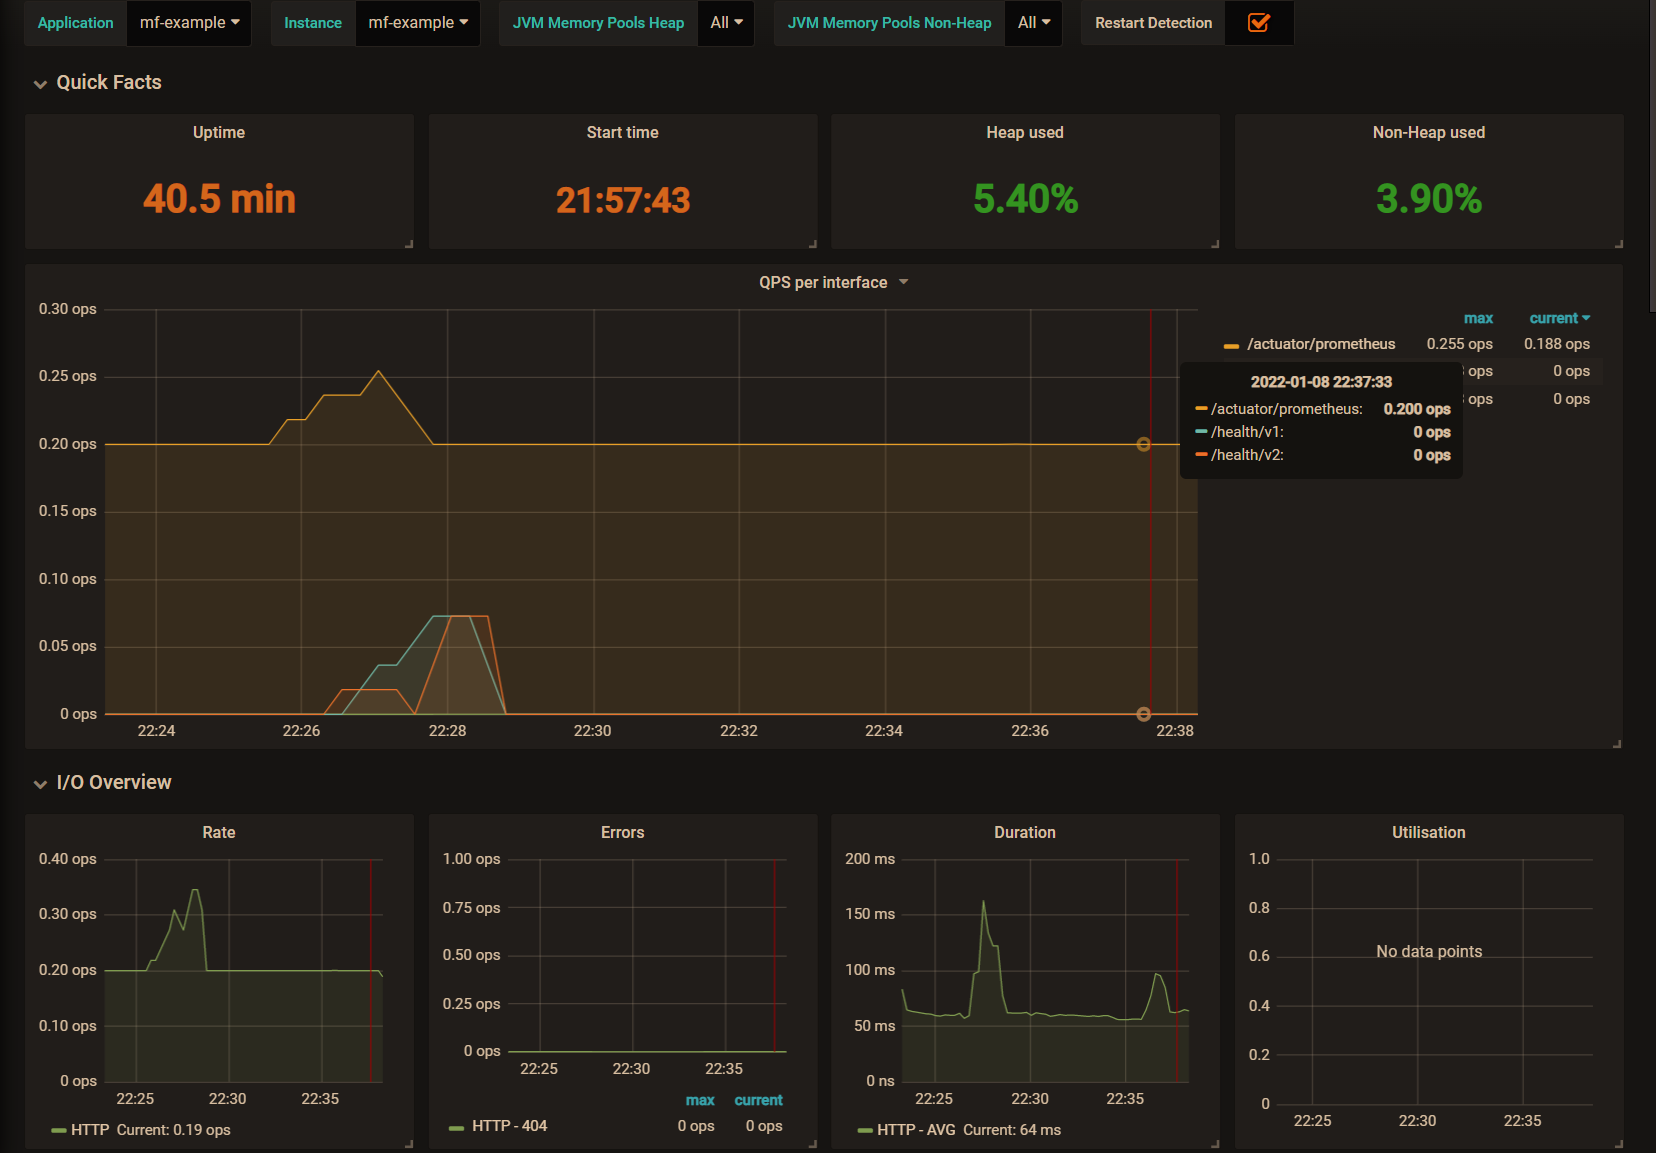
To create a Dashboard, you can customize it or use some officially released templates, such as 4701 Template. After importing the template, select the data source we just created.
It can be seen that this is the result of the graphical display of indicator data, and the service call volume can be seen very intuitively.
-
Other issues
Batch job index fetching
In addition, for temporary or batch jobs, their execution time may not be long enough, making Prometheus unable to capture indicator data. For such jobs, you can use Prometheus Pushgateway to actively push data to Prometheus (Prometheus Pushgateway manager is used to manage pushing data to Prometheus).
<dependency>
    <groupId>io.prometheus</groupId>
    <artifactId>simpleclient_pushgateway</artifactId>
</dependency>
To use the push gateway, you need to set management metrics. export. prometheus. pushgateway. enabled=true.
About @ Timed
In the previous article, we mentioned in the official document that @ Timed cannot be directly used in Spring Boot, and TimedAspect aspect support needs to be introduced. However, after actual testing, it is found that for spring MVC requests, the time-consuming of interface calls can also be recorded without introducing TimedAspect.
By analyzing the source code, it can be found that there is a WebMvcMetricsFilter class in Spring Boot Actuator. This class will intercept the request and determine whether @ Timed is added to the method and class where the interface is located.
public class WebMvcMetricsFilter extends OncePerRequestFilter {

    private void record(WebMvcMetricsFilter.TimingContext timingContext, HttpServletRequest request, HttpServletResponse response, Throwable exception) {
      Object handler = this.getHandler(request);
      // Find @ Timed annotation on class and method
      Set<Timed> annotations = this.getTimedAnnotations(handler);
      Sample timerSample = timingContext.getTimerSample();
      if(annotations.isEmpty()) {
        if(this.autoTimer.isEnabled()) {
          // Without @ Timed, the Timer is constructed with the default configuration. Here metricName="http.server.requests"
          Builder builder = this.autoTimer.builder(this.metricName);
          timerSample.stop(this.getTimer(builder, handler, request, response, exception));
        }
      } else {
        Iterator var11 = annotations.iterator();

        while(var11.hasNext()) {
          Timed annotation = (Timed)var11.next();
          // There is @ Timed on the method. Construct timer builder, where metricName="http.server.requests"
          Builder builder = Timer.builder(annotation, this.metricName);
          timerSample.stop(this.getTimer(builder, handler, request, response, exception));
        }
      }

    }


   /**
     * First, check whether the @ Timed annotation exists in the method. If not, continue to search on the class
     */
    private Set<Timed> getTimedAnnotations(HandlerMethod handler) {
        Set<Timed> methodAnnotations = this.findTimedAnnotations(handler.getMethod());
        return !methodAnnotations.isEmpty()?methodAnnotations:this.findTimedAnnotations(handler.getBeanType());
    }

}
Therefore, based on the above analysis, we remove the TimedAspect from the code, and then check the indicator data statistics again:
After adding TimedAspect, you can see that the method is recorded at the same time_ timed_ Seconds and http_server_requests_seconds is the indicator data with two names. In addition, there is a certain error in the interface time displayed by these two statistical methods. From the perspective of execution process, the calculation time using TimedAspect method is closer to the logical execution time of the method itself.