Among them, the most core problem is the operation problem caused by the distributed nature of microservices, as well as two crucial challenges:
1. Monitoring, how to comprehensively monitor all services and related indicators involved.
2. Tracing, how can we trace all requests in a three-dimensional way and identify the bottleneck of link calls in our application services?
In this article, we will introduce how to integrate Jaeger classified traces into Spring Boot MicroServices. Before parsing, let's first understand the principle of Jaeger link tracking workflow, as shown in the following reference diagram:
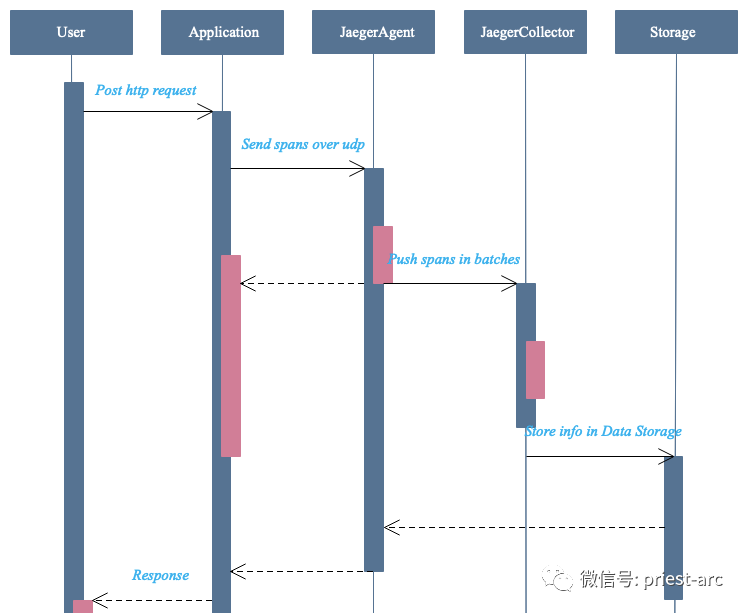
Based on the principle of Jaeger component architecture, we can see that when a trace is processed in a distributed system, the data is pushed to Jaeger collector through Jaeger agent. At this time, Jaeger collector is responsible for processing the tracking information pushed from all directions, and then storing it in the back-end system library, such as ES, database, etc. Then, users can observe these analyzed tracking information with the help of Jaeger UI graphical interface.
As for the data sampling rate, in the actual business scenario, the link tracking system itself will also cause certain low performance loss. If each request is fully recorded, it may cause great performance loss to the production environment. Therefore, we need to configure the sampling strategy according to the current situation. Up to now, five sampling rate settings can be supported, as follows: 1. Fixed sampling (sampler.type=const) Param = 1 full sampling, sampler Param = 0 no sampling 2. Sampling by percentage (sampler.type=probabilistic) Param = 0.1, one tenth of the samples will be taken randomly 3. Sampling speed limit (sampler.type=ratelimiting) Param = 2.0 samples two traces per second
4. Dynamic acquisition of sampling rate (sampler.type=remote) this policy is the default configuration. You can obtain the dynamic setting of sampling rate from the Agent through configuration 5. Adaptive Sampling is in the development plan
In the actual business scenario, in order to trace the running track of a request, usually, ideally, we need to track the whole link topology in an all-round way, so that we can respond and deal with business exceptions quickly. Therefore, the basic model reference diagram of link tracking system of Spring Cloud micro service based on VM or Container is as follows:
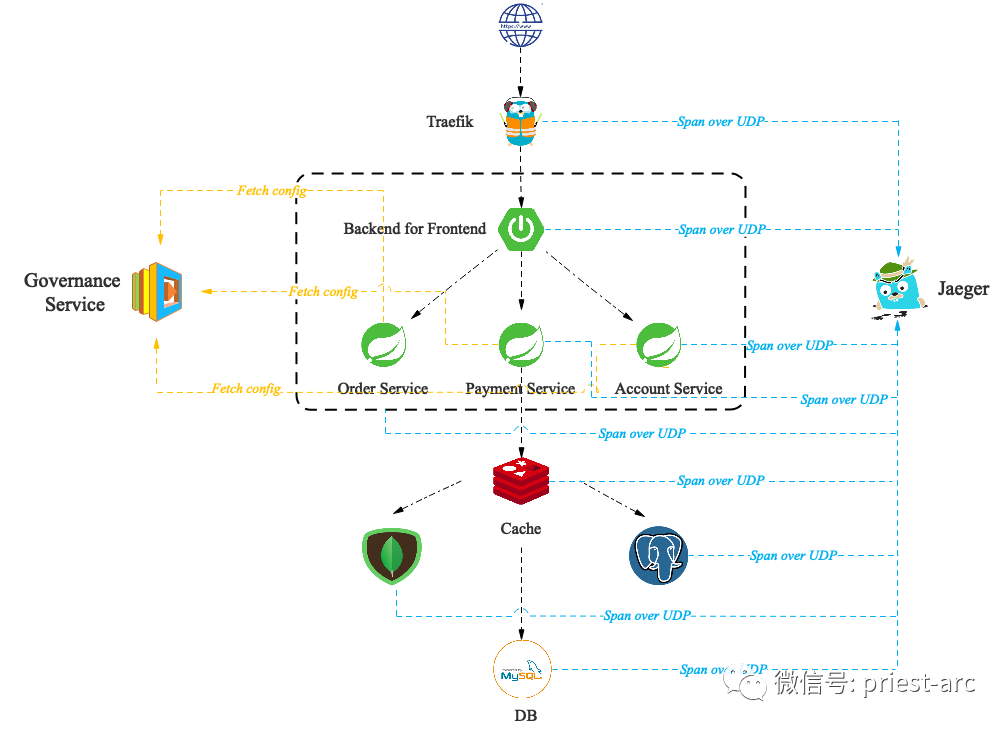
In this paper, we briefly describe the Jaeger based distributed link tracking system project in the form of "Demo". Based on the above model reference diagram, we begin to deploy relevant components.
In order to analyze the basic principles of Jaeger components in as much detail as possible, we will first deploy Jaeger components in the simplest and clear way. Build and start the image based on Jaeger's "all in one". The details are as follows:
[administrator@JavaLangOutOfMemory ~ ]% docker run -d --name jaeger \
  -e COLLECTOR_ZIPKIN_HTTP_PORT=9411 \
  -p 5775:5775/udp \
  -p 6831:6831/udp \
  -p 6832:6832/udp \
  -p 5778:5778 \
  -p 16686:16686 \
  -p 14268:14268 \
  -p 14250:14250 \
  -p 9411:9411 \
  jaegertracing/all-in-one:latest
In this article, the port definitions are as follows:
assembly | port | agreement | describe |
|---|---|---|---|
Agent | 6831 | UDP | The application sends the traced port to the agent and accepts Jaeger Thrift instead of Compact thrift protocol |
Agent | 6832 | UDP | Accept Jaeger through binary thrift protocol Thrift requires some client libraries that do not support compression |
Agent | 5775 | UDP | Receive zipkin compatible protocol data |
Agent | 5778 | HTTP | It is not recommended to use under large data traffic |
... | ... | ... | ... |
assembly | port | agreement | describe |
|---|---|---|---|
Collector | 14250 | TCP | Agent sends Proto format data |
Collector | 14267 | TCP | Agent sends Jaeger Thrift format data |
Collector | 14268 | HTTP | Accept Jaeger from client thrift |
Collector | 14269 | HTTP | health examination |
assembly | port | agreement | describe |
|---|---|---|---|
Query | 16686 | HTTP | HTTP query service in Jaeger UI |
Query | 16687 | HTTP | health examination |
... | ... | ... | ... |
From version 1.17( https://www.jaegertracing.io/docs/1.23/operator/ #From the current version), we can also deploy based on the Operator, and it supports the following business methods:
1,All-In-One Strategy
2,Production Strategy
3,Streaming Strategy
Jaeger Operator: Jaeger Operator for Kubernetes simplifies the deployment and operation of Jaeger on Kubernetes. Jaeger Operator is the implementation of Kubernetes Qperator. Technically, Qperator is a way to package, deploy, and manage Kubernetes applications. Jaeger Operator version tracks a version of Jaeger components (queries, collectors, agents). The specific deployment steps are as follows:
[administrator@JavaLangOutOfMemory ~ ]% kubectl create namespace jaeger
[administrator@JavaLangOutOfMemory ~ ]% kubectl create -n jaeger -f  https://raw.githubusercontent.com/jaegertracing/jaeger-operator/master/deploy/crds/jaegertracing.io_jaegers_crd.yaml
[administrator@JavaLangOutOfMemory ~ ]% kubectl create -n jaeger -f https://raw.githubusercontent.com/jaegertracing/jaeger-operator/master/deploy/service_account.yaml
[administrator@JavaLangOutOfMemory ~ ]% kubectl create -n jaeger -f https://raw.githubusercontent.com/jaegertracing/jaeger-operator/master/deploy/role.yaml
[administrator@JavaLangOutOfMemory ~ ]% kubectl create -n jaeger -f https://raw.githubusercontent.com/jaegertracing/jaeger-operator/master/deploy/role_binding.yaml
[administrator@JavaLangOutOfMemory ~ ]% kubectl create -n jaeger -f https://raw.githubusercontent.com/jaegertracing/jaeger-operator/master/deploy/operator.yaml
At this time, check its status. The specific commands are as follows:
[administrator@JavaLangOutOfMemory ~ ]% kubectl get all -n jaeger
Then, create the Jaeger instance and create Jaeger Yaml file to configure the ES cluster and resource restrictions, as follows: Deployment and the CPU and memory usage size of the demo prod collector container involved. The following example file defines a maximum of 10 pods.
apiVersion: jaegertracing.io/v1
kind: Jaeger
metadata:
  name: demo-prod
spec:
  strategy: production
  storage:
    type: elasticsearch
    options:
      es:
        server-urls: http://10.172.10.1:9200
        index-prefix:
  collector:
    maxReplicas: 10
    resources:
      limits:
        cpu: 500m
        memory: 512Mi
[administrator@JavaLangOutOfMemory ~ ]% kubectl apply -f jaeger.yaml -n jaeger jaeger.jaegertracing.io/demo-prod created
In the actual business scenario, if the traffic is too large, we can access the Kafka cluster to reduce the pressure on the ES repository. Therefore, the modified Jaeger The yaml file is as follows:
apiVersion: jaegertracing.io/v1
kind: Jaeger
metadata:
  name: demo-streaming
spec:
  strategy: streaming
  collector:
    options:
      kafka:
        producer:
          topic: jaeger-spans
          brokers: demo-cluster-kafka-brokers.kafka:9092   #Change to kafka address
  ingester:
    options:
      kafka:
        consumer:
          topic: jaeger-spans
          brokers: demo-cluster-kafka-brokers.kafka:9092  #Change to kafka address
      ingester:
        deadlockInterval: 5s
  storage:
    type: elasticsearch
    options:
      es:
        server-urls: http://elasticsearch:9200 # modified to ES address
At present, there are two deployment schemes for Agent, one is based on DaemonSet and the other is based on Sidecar. According to the official statement, the Agent component in Jaeger is used as the buffer between the Tracer and the Collector, so the closer the Agent is to the Tracer, the better. Usually, it should be the Tracer's Localhost. Based on this assumption, the Tracer can directly send the span to the Agent through UDP to achieve the best balance between performance and reliability.
DaemonSet's Pod runs at the node level. This form of Pod is like a daemon on each node. Kubernetes ensures that each node has and only one Agent Pod running. If deployed in DaemonSet mode, it means that this Agent will accept the data sent by all application Pods on the node, and all Pods are treated equally for the Agent. This can indeed save some memory, but an Agent may have to serve hundreds of Pods on the same node.
Sidecar adds other services to the application Pod. In Kubernetes, the service takes Pod as the basic unit, but a Pod can contain multiple containers, which can usually be used to embed some infrastructure services. Under sidecar deployment, Jaeger Agent will be used as a container in the Pod and coexist with Tarcer. Because it runs at the application level, Without additional permissions, each application can send data to different Collector backend, which can ensure better service scalability.
Through comprehensive comparative analysis, if we are based on the private cloud environment and trust the applications running on the Kubernetes cluster, it is generally recommended to use the DaemonSet for deployment. After all, this method occupies as little memory resources as possible. On the contrary, if it is a public cloud environment or wants to obtain multi tenant capability, Sidecar may be better. Because the Agent service currently does not have any security authentication means, this method does not need to expose the Agent service outside the Pod. In contrast, it is safer, although the memory occupation will be slightly more (the memory occupation of each Agent is less than 20M).
1. Deployment based on DaemonSet pattern
apiVersion: apps/v1
 kind: DaemonSet
 metadata:
   name: jaeger-agent
   labels:
     app: jaeger-agent
 spec:
   selector:
     matchLabels:
       app: jaeger-agent
   template:
     metadata:
       labels:
         app: jaeger-agent
     spec:
       containers:
         - name: jaeger-agent
           image: jaegertracing/jaeger-agent:1.12.0
           env:
             - name: REPORTER_GRPC_HOST_PORT
               value: "jaeger-collector:14250"
           resources: {}
       hostNetwork: true
       dnsPolicy: ClusterFirstWithHostNet
       restartPolicy: Always
Inject the IP information (status.hostIP) of the node into the application container in the form of environment variables through the Kubernetes Downward API.
2. Deployment based on Sidecar mode
apiVersion: apps/v1
  kind: Deployment
  metadata:
    name: myapp
    labels:
      app: myapp
  spec:
    replicas: 1
    selector:
      matchLabels:
        app: myapp
    template:
      metadata:
        labels:
          app: myapp
      spec:
        containers:
          - name: myapp
            image: example/myapp:version
          - name: jaeger-agent
            image: jaegertracing/jaeger-agent:1.12.0
            env:
              - name: REPORTER_GRPC_HOST_PORT
                value: "jaeger-collector:14250"
At this point, Jaeger service deployment is OK. For the deployment of the remaining components, please refer to the official website. Next, let's take a look at the configuration of Jaeger accessing the traifik component. By default, traifik uses Jaeger to track the back-end implementation of the system, The specific configuration is as follows:
[administrator@JavaLangOutOfMemory ~ ]% cat traefik.toml
[tracing]
  [tracing.jaeger]          # Enable jaeger's tracking support
    samplingServerURL = "http://localhost:5778/demo "# specify the http sampling address of Jaeger agent
    samplingType = "const"  # Specify the sampling type [const(const|probabilistic|rateLimiting)]
    samplingParam = 1.0      # Value of sampling parameter [1.0 (const: 0 × 1, probabilistic: 0-1, ratelimiting: number of span s per second)]
    localAgentHostPort = "127.0.0.1:6831"                    # Local agent host and port (sent to Jaeger agent)
    gen128Bit = true        # Generate 128 bit traceId, compatible with OpenCensus
    propagation = "jaeger"  # Set the header type of data transmission [jaeger(jaeger|b3 compatible with OpenZipkin)]
    traceContextHeaderName = "demo-trace-id"  # The header of the tracking context, which is used to transmit the http header name of the tracking context
  [tracing.jaeger.collector]  # Specify the collector service for jaeger
    endpoint = "http://127.0.0.1:14268/api/traces?format=jaeger.thrift"
    user = "demo-user"          # http authenticated user when submitting to collector [""]
    password = "demo-password"  # http authentication password when submitting to collector [""]

# cli configuration
--tracing.jaeger=true
--tracing.jaeger.samplingServerURL=http://localhost:5778/demo
--tracing.jaeger.samplingType=const
--tracing.jaeger.samplingParam=1.0
--tracing.jaeger.localAgentHostPort=127.0.0.1:6831
--tracing.jaeger.gen128Bit
--tracing.jaeger.propagation=jaeger
--tracing.jaeger.traceContextHeaderName=uber-trace-id
--tracing.jaeger.collector.endpoint=http://127.0.0.1:14268/api/traces?format=jaeger.thrift
--tracing.jaeger.collector.user=demo-user
--tracing.jaeger.collector.password=demo-password
For Spring Boot microservices, the following steps are mainly involved, as shown below:
1. Integrate Jaeger and introduce Maven dependency
<dependency>
    <groupId>io.opentracing.contrib</groupId>
    <artifactId>opentracing-spring-jaeger-web-starter</artifactId>
    <version>3.3.1</version>
</dependency>
2. Connection property configuration
spring.application.name=demo
opentracing.jaeger.enabled=true
opentracing.jaeger.log-spans=false
# opentracing.jaeger.enable128-bit-traces=true
3. Other parameter configurations, such as automatic configuration using JaegerAutoConfiguration and Log back log configuration file, can effectively track the service request link in all directions. Based on the log configuration file and in combination with the reference given on the official website, it mainly focuses on the user-defined parameters traceId, spanId and sampled. Of course, these parameters can also be found in new mdcsc Specified by opemanager. Builder(). Please refer to the following configuration for details:
<?xml version="1.0" encoding="UTF-8"?>
<Configuration status="INFO">
    <Appenders>
        <Console name="console" target="SYSTEM_OUT">
            <PatternLayout
                    pattern="[%-5level] %d{yyyy-MM-dd HH:mm:ss.SSS} [%t] %c{1} - %msg% traceId=%X{traceId} spanId=%X{spanId} sampled=%X{sampled}%n" />
        </Console>
    </Appenders>
    <Loggers>
        <Root level="debug" additivity="false">
            <AppenderRef ref="console" />
        </Root>
    </Loggers>
</Configuration>
Based on the above configuration, you can complete the deployment of Spring Boot microservices (Order Service, Payment Service, Account Service, Customer Service and other services) , the deployment and source code of related services will not be described in this article, but will be presented later. So far, in the whole network architecture topology, the access layer traifik and service layer Spring Boot have completed the access of Jaeger distributed link tracking system. The specific generated dependency diagram is as follows:
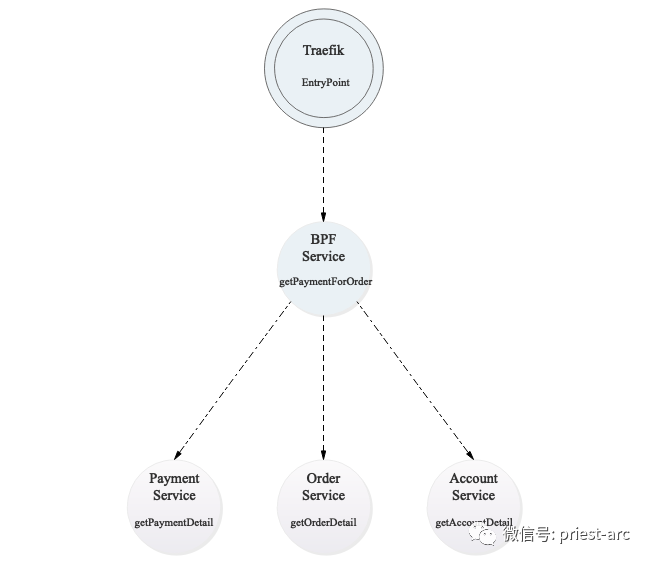
At this time, we can also see the call dependency between various services and the log of interface requests, as shown below:
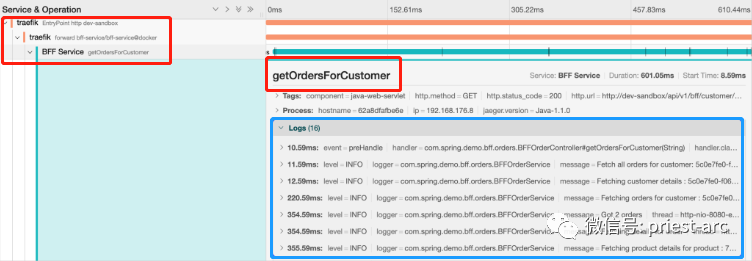
The access of components downstream of the service layer (CACHE layer, basic middleware layer, data storage layer, etc.) will be analyzed separately in subsequent articles.
To sum up, Jaeger, a link tracking system based on cloud native ecology, plays a very important role in identifying, locating and analyzing the bottleneck of link calls between services in our application network topology in the actual business scenario. Based on its "problem identification" and "information traceability" And other features, so that we can easily solve the complex dependencies between services and difficult problem analysis.