From the service gateway: Microservices series: introduction to Spring Cloud Gateway I've always learned about distributed transactions: Microservices series: distributed transaction Spring Cloud Alibaba's Seata practical chapter Today, we are finally going to end our micro service series. Not surprisingly, distributed logging will be the last article in the current microservice series, which may be supplemented in the future.
Without much to say, I will begin to learn the last article of the current microservice series.
1, Basic introduction
1. What is distributed logging
I believe that in your daily work, you will often encounter many exceptions and error messages in the production environment. You need to check the log information to check the errors. Moreover, this project is a distributed application, and the logs are scattered on different storage devices. If you manage dozens or hundreds of servers, you can also use the traditional method of logging in to each machine in turn to check the log. Does this feel cumbersome and inefficient. Therefore, we use centralized log management. Distributed log is to collect, track and process large-scale log data.
Generally, we need to conduct log analysis scenarios: you can get the information you want by directly grep and awk in the log file. However, in large-scale scenarios, this method is inefficient and faces problems, including how to archive if the log volume is too large, what to do if the text search is too slow, and how to query in multiple dimensions. Centralized log management is required, and the logs on all servers are collected and summarized. The common solution is to establish a centralized log collection system to collect, manage and access the logs on all nodes.
2. ELK distributed log
In fact, ELK is the abbreviation of three software, which are composed of Elasticsearch, Logstash and Kibana.
Elasticsearch is an open source distributed search engine based on java. Its characteristics include: distributed, zero configuration, automatic discovery, automatic index fragmentation, index copy mechanism, restful style interface, multiple data sources, automatic search load, etc.
Kibana is an open source and free tool based on nodejs. Kibana can provide log analysis friendly Web interface for Logstash and ElasticSearch, and can summarize, analyze and search important data logs.
Based on java, Logstash is an open source tool for collecting, analyzing and storing logs.
Here is how ELK works: 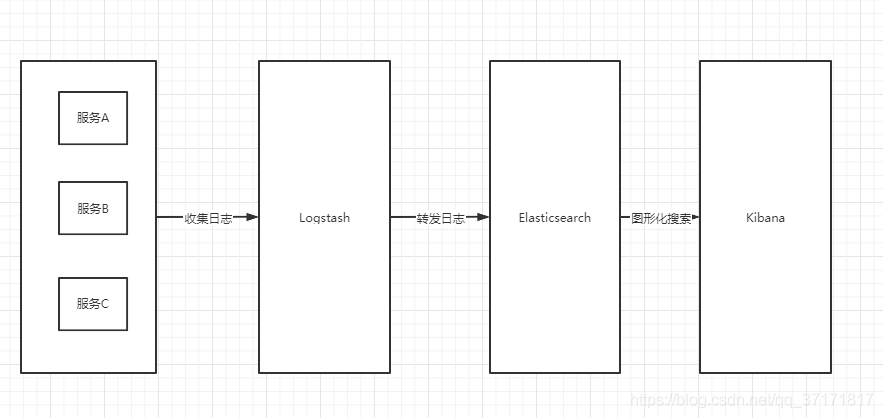
Suppose that our project is deployed on three servers. Generally, Elasticsearch should be installed on all three servers. Kibana should be installed on the server as the master node, and Logstash should be installed on one of the node servers.
Next, let's build it.
2, Build ELK
During the construction process, you must pay attention to the correspondence between versions. If the versions do not correspond, various startup errors will appear.
Version Description:
- CentOS 7.9
- JDK 1.8
- Elasticsearch-8.0.0
- Logstash-8.0.0
- Kibana-8.0.0
1. Elasticsearch
1.1 INTRODUCTION
Elasticsearch is a Lucene based search server. It provides a distributed multi-user full-text search engine based on RESTful web interface. Elasticsearch is developed in Java and released as an open source under the Apache license terms. It is a popular enterprise search engine.
1.2 installation configuration
First, go to the official website to download: Download Elasticsearch | Elastic , select the Linux version
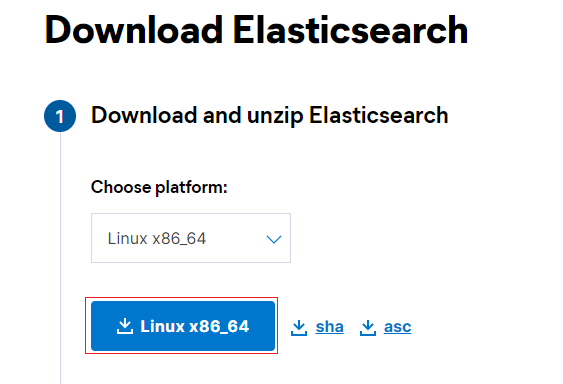
PS: the download speed of the official website is still very fast
This time I use CentOS 7 in the virtual machine. First copy the downloaded tar package to / usr/local in the virtual machine,
- decompression
tar -zxvf elasticsearch-8.0.0-linux-x86_64.tar.gz
- Modify configuration
cd /usr/local/elasticsearch-8.0.0/config/
vim elasticsearch.yml
cluster.name: my-application
node.name: node-1
path.data: /home/esuser/data	# Data file storage directory
path.logs: /home/esuser/logs	# Log file storage directory
network.host: 0.0.0.0			# Open to all IP
http.port: 9200					# Port number
discovery.seed_hosts: ["192.168.20.105"]
cluster.initial_master_nodes: ["node-1"]
Note: path Data and path The logs directory needs to be created manually mkdir
Note: these configurations are annotated by default. After modification, open the annotation
In addition, because we are only testing and learning this time, we can turn off the security related configuration from true to false
# Enable security features
xpack.security.enabled: false
xpack.security.enrollment.enabled: false
# Enable encryption for HTTP API client connections, such as Kibana, Logstash, and Agents
xpack.security.http.ssl:
  enabled: false
  keystore.path: certs/http.p12
# Enable encryption and mutual authentication between cluster nodes
xpack.security.transport.ssl:
  enabled: false
Save and exit editing after modification
- Create esuser user
Because ElasticSearch does not support direct operation by Root users, we need to create an esuser user
# Create user
useradd esuser
# Set password
passwd esuser
# Give user permission
chown -R esuser:esuser /usr/local/elasticsearch-8.0.0
1.3 startup
Switch user to esuser user for operation
su esuser
cd /usr/local/elasticsearch-8.0.0/bin
./elasticsearch -d & tail -f /home/esuser/logs/my-application.log 	# Start in the background and view the startup log
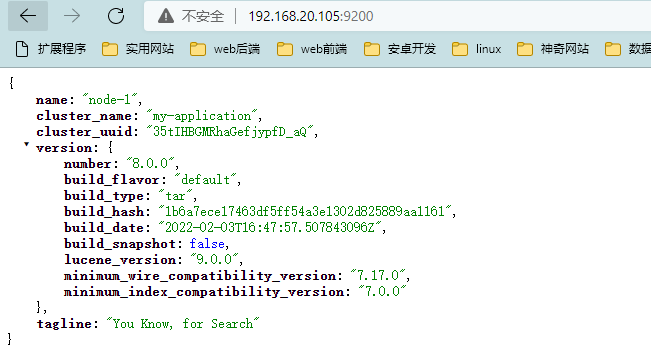
If there is no error at startup, the host browser access address is: http://192.168.20.105:9200/
192.168.20.105 is the static ip of the virtual machine. The successful access is shown in the figure below (pay attention to the firewall)
2. Logstash
2.1 introduction
Logstash is an open source server-side data processing pipeline, which can collect data from multiple sources at the same time, convert data, and then send data to the repository. Of course, our repository in this article is ElasticSearch.
2.2 installation configuration
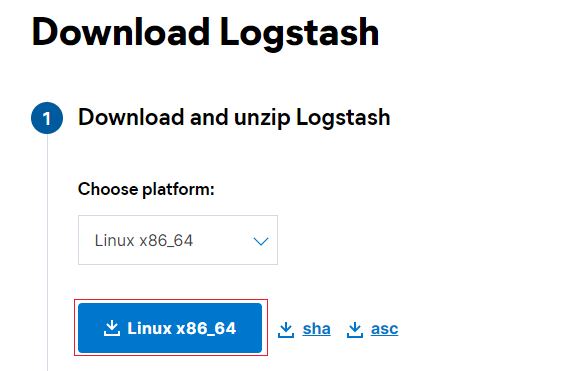
Download address of official website: Download Logstash Free | Get Started Now | Elastic
Copy the downloaded tar package to / usr/local in the virtual machine,
- decompression
tar -zxvf logstash-8.0.0-linux-x86_64.tar.gz
- New profile
cd /usr/local/logstash-8.0.0/bin
touch logstash-elasticsearch.conf
vim logstash-elasticsearch.conf
input {
	stdin {}
}
output {
	elasticsearch {
		hosts => '192.168.20.105:9200'
	}
	stdout {
		codec => rubydebug
	}
}
Note the address of elasticsearch inside
2.3 startup
At this time, it is under the root user
cd /usr/local/logstash-8.0.0/bin
nohup ./logstash -f logstash-elasticsearch.conf &		# Background start
Note: execute the background startup command to view nohup It is found that there is an error when logging out, but it seems that it has been started successfully, which will not affect the use. If nohup is not used, there will be no error.
Use jps to view all current java processes
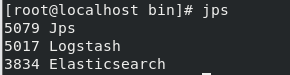
Found that the startup was successful.
3. Kibana
3.1 introduction
Kibana is an open source data analysis and visualization platform. It is one of the members of Elastic Stack and is designed to cooperate with elastic search. You can use kibana to search, view and interact with the data in Elasticsearch index. You can easily use charts, tables and maps to conduct diversified analysis and presentation of data.
3.2 installation configuration
Download address of official website: Download Kibana Free | Get Started Now | Elastic
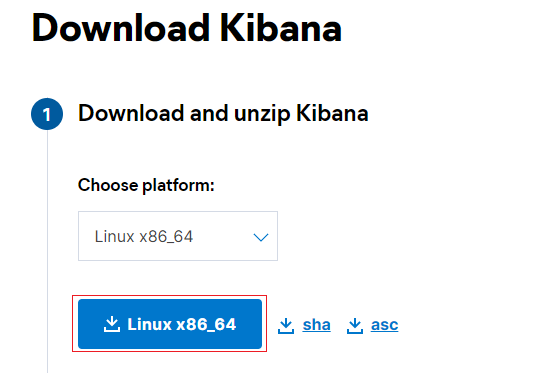
Copy the downloaded tar package to / usr/local in the virtual machine,
- decompression
tar -zxvf kibana-8.0.0-linux-x86_64.tar.gz
- Modify configuration
cd /usr/local/kibana-8.0.0/config/
vim kibana.yml
server.port: 5601			# Port number
server.host: "0.0.0.0"		# Open access to all ip addresses
server.name: "my-kibana"
elasticsearch.hosts: ["http://192.168.20.105:9200"] 		#  es address
i18n.locale: "zh-CN"	# Sinicization
Note: these configurations are annotated by default. After modification, open the annotation
- kibana can't be started by the root user, so we use the esuser user created earlier and authorize it first
chown -R esuser:esuser /usr/local/kibana-8.0.0
3.3 startup
Switch to esuser user
su esuser
Background start
/usr/local/kibana-8.0.0/bin &
Successful startup, browser access address: http://192.168.20.105:5601/
The following page appears, indicating that the startup is successful
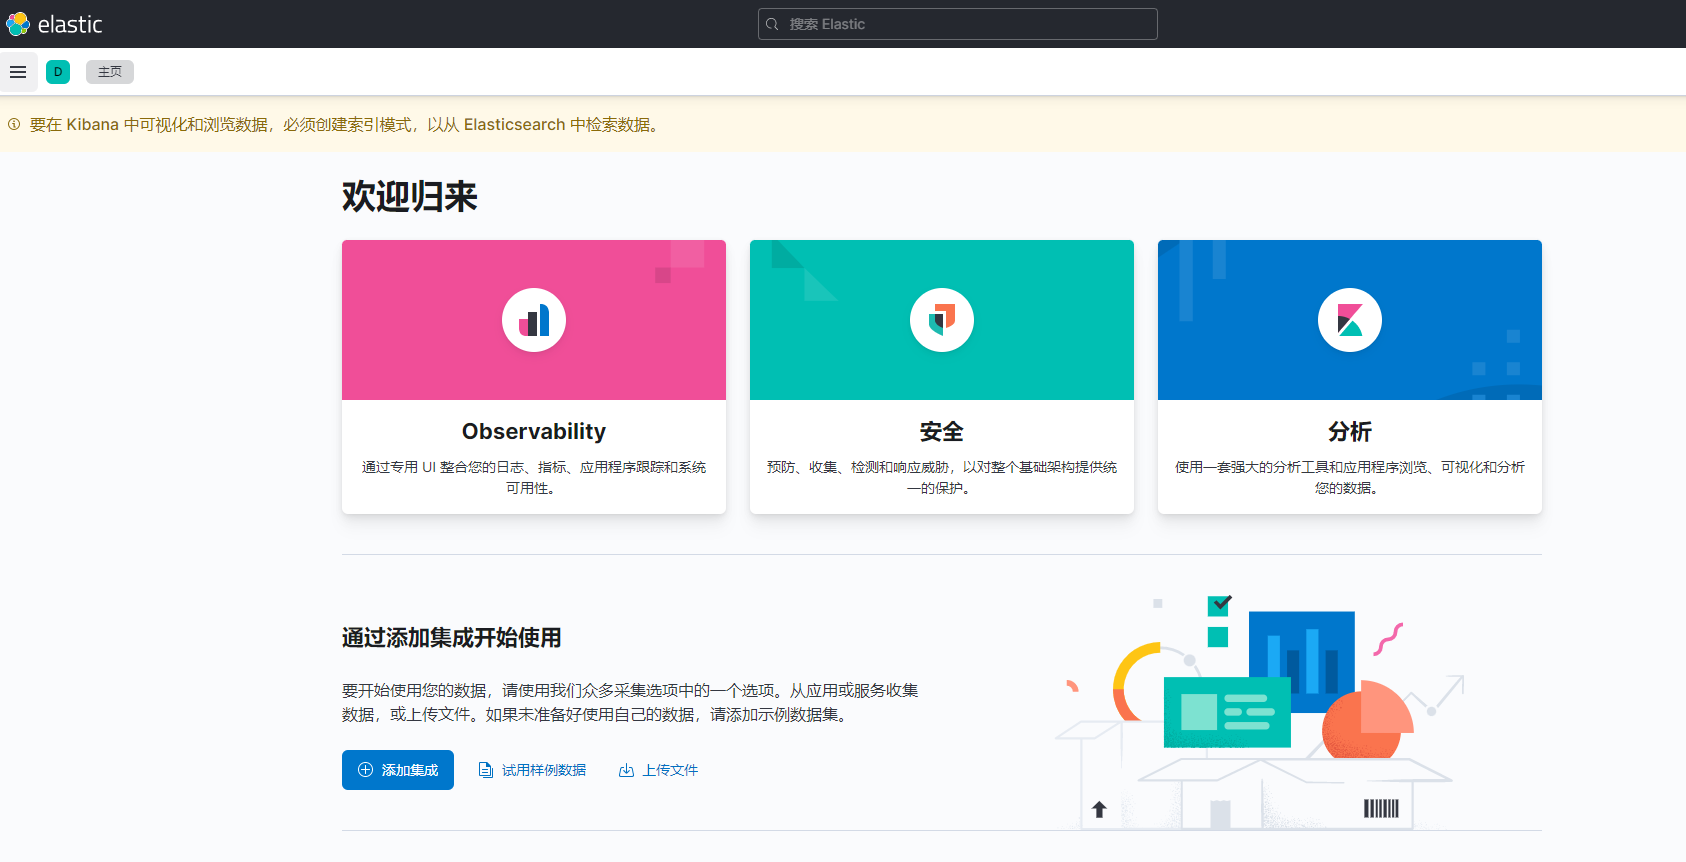
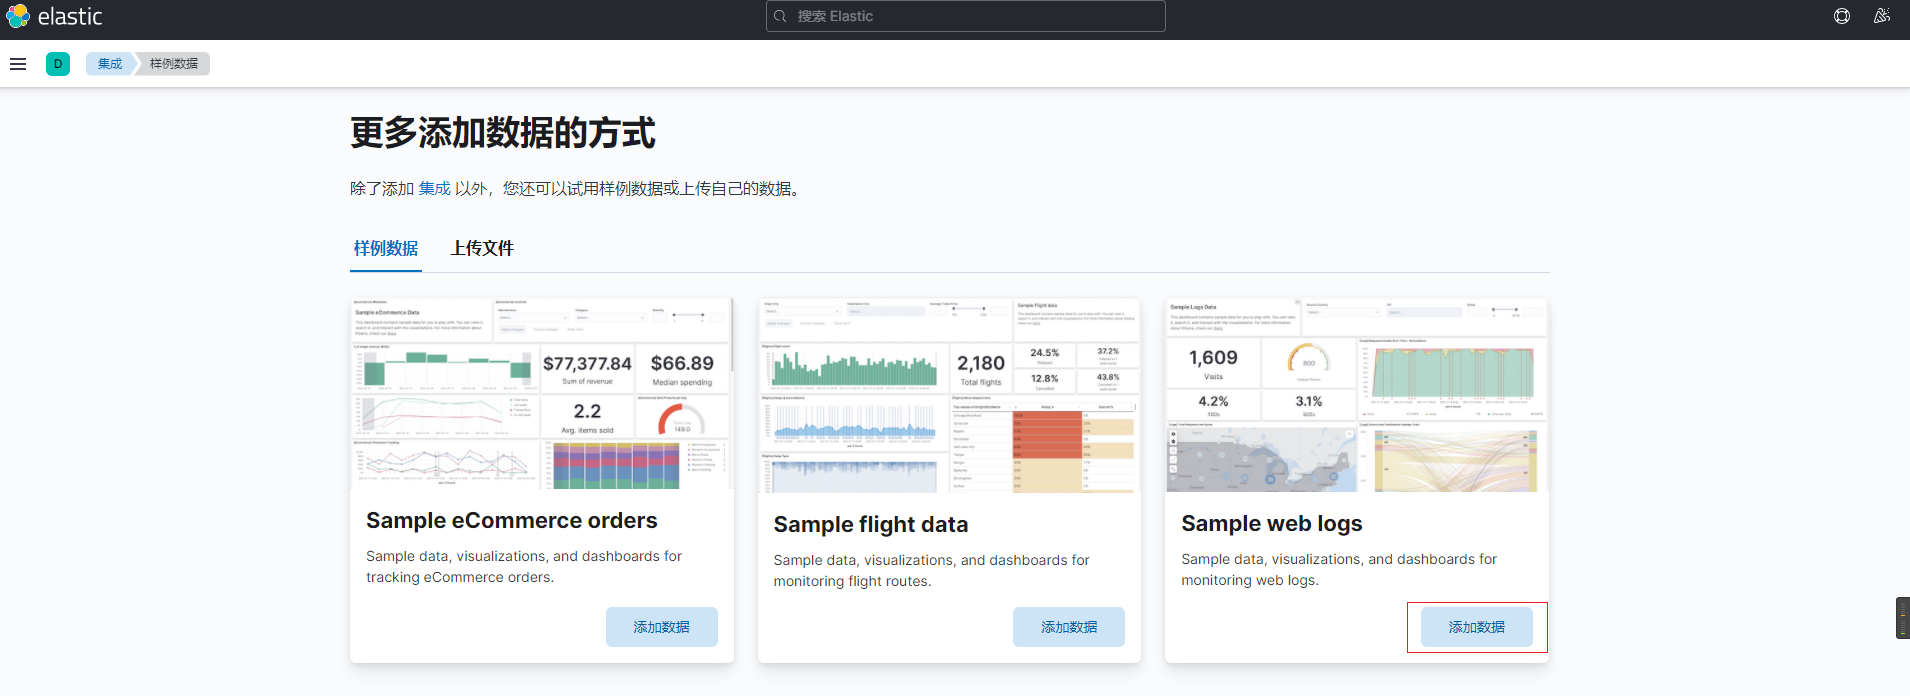
We click the applicable sample data and click add data
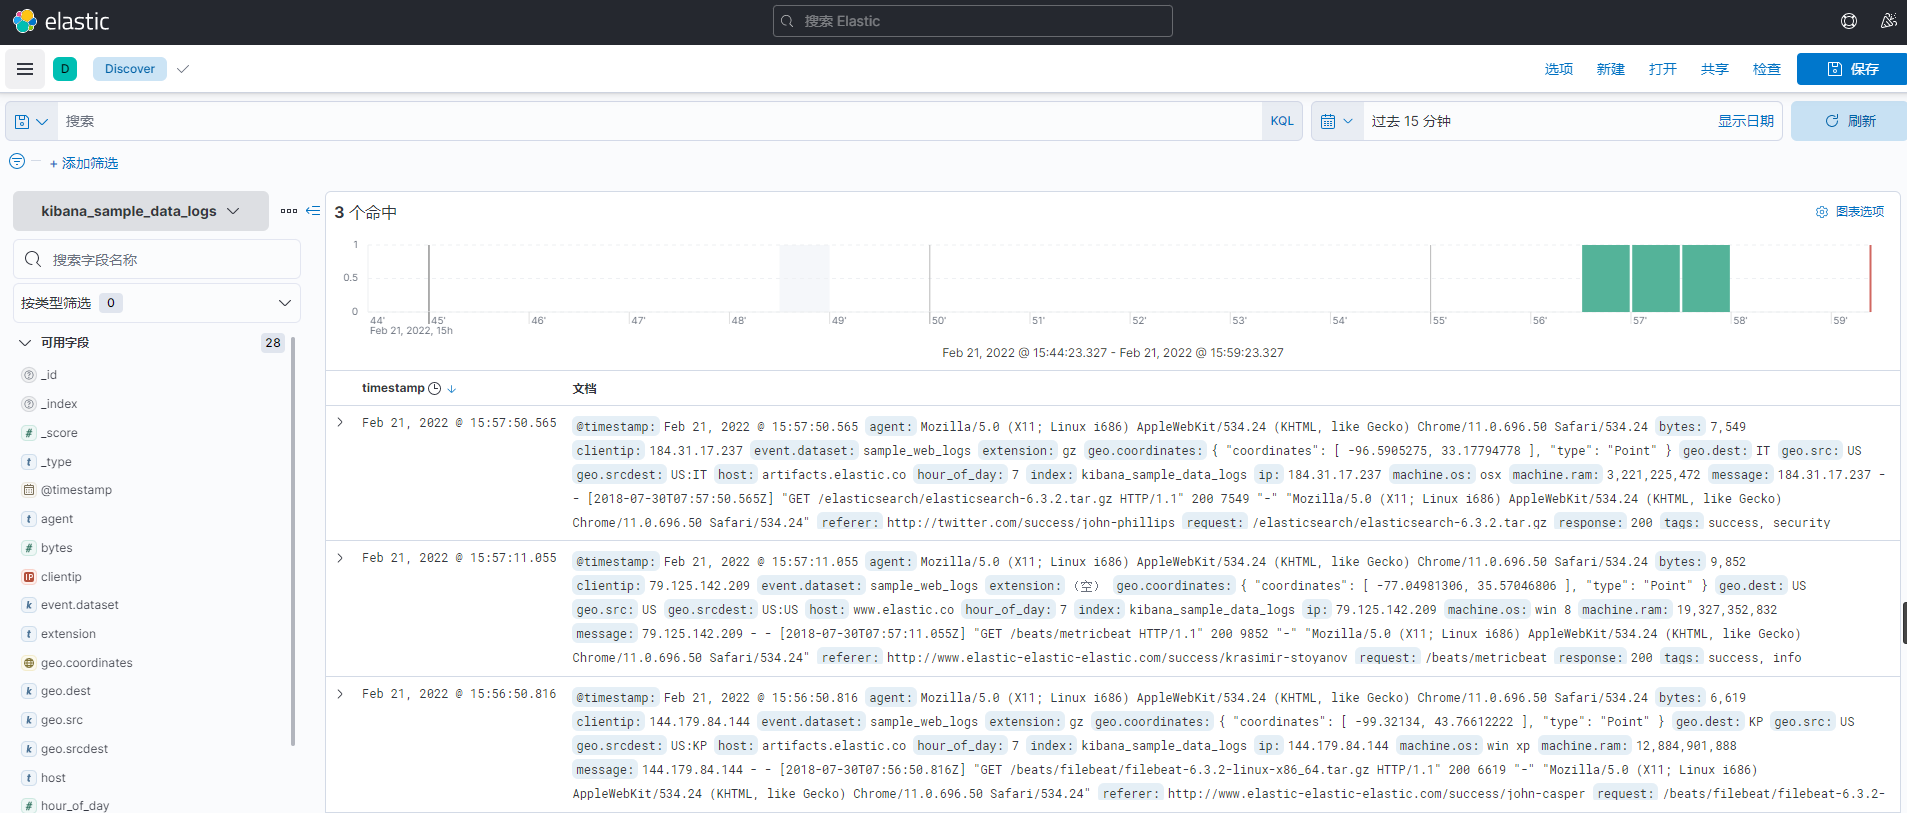
Click Discover
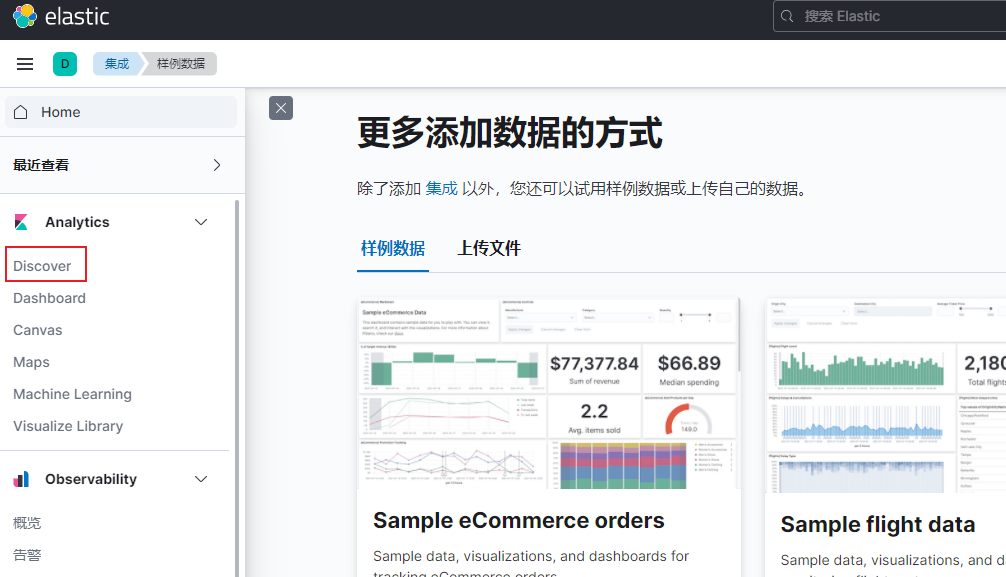
You can see the sample data
So far, the software we need for distributed logging has been installed, configured and started successfully
As for how to use it, I feel I need an article to write.