brief introduction
KNN(K Nearest Neighbors)
- It can be used for classification problems and regression problems
- Classification problem and regression problem are divided into whether to take weight or not
give an example
introduce
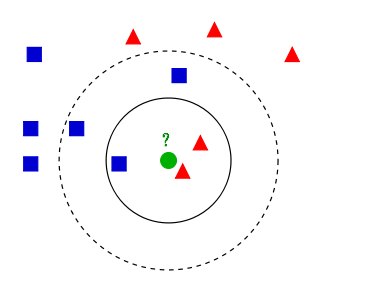
- The existing categories are red triangles and blue squares
- What type should the newly entered green dot belong to (red triangle or blue square)
- When K=3, find 1 blue square and 2 red triangles. The minority obeys the majority. It is considered that the newly entered green points are the category of red triangles
- In extreme cases, when K=1, what shape is the nearest shape to the newly input green point and what shape is the newly input green point
- In extreme cases, when K = the number of training set samples, the number of graphics in the category of the whole training set samples is the largest, and the newly entered green points belong to this shape
principle
KNN(K Nearest Neighbors)
- K nearest neighbor algorithm
- Find K nearest neighbors first, and then the minority obeys the majority
- For a new input instance, K instances that are most similar (adjacent) to the instance are found in the training data set. Most of these K instances belong to a certain category, so the input instance is classified into this category
similarity measure
similarity
- Similarity is measured by distance
- The closer the similarity, the closer the distance between the input instance and the training instance
Distance definition
Set feature space
X
X
X is an m-dimensional vector space of real numbers
R
n
R^n
Rn,
x
i
,
x
j
∈
X
x_i,x_j\in X
xi,xj∈X,
x
i
=
(
x
i
(
1
)
,
x
i
(
2
)
,
.
.
.
,
x
i
(
m
)
)
T
x_i=(x_i^{(1)},x_i^{(2)},...,x_i^{(m)})^T
xi=(xi(1),xi(2),...,xi(m))T,
x
j
=
(
x
j
(
1
)
,
x
j
(
2
)
,
.
.
.
,
x
j
(
m
)
)
T
x_j=(x_j^{(1)},x_j^{(2)},...,x_j^{(m)})^T
xj=(xj(1),xj(2),...,xj(m))T
- x i , x j x_i,x_j xi, xj L p L_p Lp # distance: L p ( x i , x j ) = ( ∑ l = 1 m ∣ x i ( l ) − x j ( l ) ∣ p ) 1 p L_p(x_i,x_j)=\Big(\sum\limits_{l=1}^m|x_i^{(l)}-x_j^{(l)}|^p\Big)^{\frac{1}{p}} Lp(xi,xj)=(l=1∑m∣xi(l)−xj(l)∣p)p1
- p = 2 p=2 p=2 Euclidean distance: L 2 ( x i , x j ) = ( ∑ l = 1 m ∣ x i ( l ) − x j ( l ) ∣ 2 ) 1 2 L_2(x_i,x_j)=\Big(\sum\limits_{l=1}^m|x_i^{(l)}-x_j^{(l)}|^2\Big)^{\frac{1}{2}} L2(xi,xj)=(l=1∑m∣xi(l)−xj(l)∣2)21
K value determination
- According to the example, when K=1 and K = the number of training set samples are not appropriate K values, how to determine a k value of appropriate size
- In application, the K value is generally a relatively small value, and the cross validation method is usually used to select the optimal K value.
code
introduce
- Using the digital data set provided by sklearn, it is composed of 1797 handwritten digital images, and each number is represented by 8x8 pixel value vector.
import numpy as np
import matplotlib.pyplot as plt
from sklearn.datasets import load_digits
from sklearn.model_selection import train_test_split

np.random.seed(1)


def get_data_set():
    # Digital data set, each number is composed of 8x8 pixels
    digits = load_digits()
    # data: 8x8 pixel image; target: the number represented by the image
    X, y = digits.data, digits.target

    # The sample shows the picture numbers from 0 to 9
    # figure width=10, height=8 "add sub figure on figure, 10 axes, each horizontal axis span = 2, and vertical axis span = 5
    # We can see the use of pyplot: figure "axes (you can draw more than one)" draw pictures on axes
    fig = plt.figure(figsize=(10, 8))
    for i in range(10):
        # Add the coordinate axis to fig. rows=2, column=5, index=i+1: indicates the number ax from left to right and from top to bottom
        ax = fig.add_subplot(2, 5, i + 1)
        # Show pictures on axes, imshow=imageshow, cmap=Colormap
        plt.imshow(X[i].reshape((8, 8)), cmap='gray')
    plt.show()

    # The data set is divided into training set and test set
    # For example: X_train.shape=(1347,64); y_train.shape=(1347,); X_test.shape=(450,64); y_test.shape=(450,)
    X_train, X_test, y_train, y_test = train_test_split(X, y)
    print('X_train.shape=', X_train.shape)
    print('y_train.shape=', y_train.shape)
    print('X_test.shape=', X_test.shape)
    print('y_test.shape=', y_test.shape)

    data_set = DataSet(X_train, y_train, X_test, y_test)
    return data_set


class DataSet(object):
    """
    X_train Training set samples
    y_train Training set sample value
    X_test Test set samples
    y_test Test set sample value
    """

    def __init__(self, X_train, y_train, X_test, y_test):
        self.X_train = X_train
        self.y_train = y_train
        self.X_test = X_test
        self.y_test = y_test


class K_NN():
    """
    k-nearest-neighbor class
    """

    def __init__(self, X, y):
        """
        :param X: X_train
        :param y: y_train
        """
        self.X = X
        self.y = y

    def euclidean_distance(self, X):
        """
        X and X_train Euclidean distance
        """
        # 10. The shape result (n,64) is n_samples=n
        print("X.shape=", X.shape)
        m, _ = X.shape
        # axis=1, line summation; axis=0, column summation
        # L2 is the matrix of (n,1)
        L2 = [np.sqrt(np.sum((self.X - X[i]) ** 2, axis=1)) for i in range(m)]
        # array to ndarray
        return np.array(L2)

    def hypothesis(self, X, k=1):
        """
        X: Data to be predicted, matrix
        k: distance X current k Objects
        """
        # step1: calculate Euclidean distance
        dists = self.euclidean_distance(X)

        # step 2: find k nearest neighbors and their categories
        # Each column is sorted from small arrival, and then the subscript of k elements of each column is taken
        idxk = np.argsort(dists)[:, :k]
        print("idxk.shape=", idxk.shape)
        # y_idxk is a matrix (n,k)
        y_idxk = self.y[idxk]
        print("y_idxk.shape=", y_idxk.shape)

        if k == 1:
            # Switch to line vector for easy display
            return y_idxk.T
        else:
            m, _ = X.shape
            # y_idxk is the array (n,k)_ Votes is an array (n,1)
            # Voting key is an anonymous function with the parameter y_idxk statistics y_ The number of occurrences of each element in idxk [i] "max" returns the element with the most occurrences (the minority obeys the majority in the whole process)
            max_votes = [max(y_idxk[i], key=list(y_idxk[i]).count) for i in range(m)]
            return max_votes


def evaluate_model(knn, X_test, y_test):
    y_p_test1 = knn.hypothesis(X_test, k=1)
    test_acc1 = np.sum(y_p_test1[0] == y_test) / len(y_p_test1[0]) * 100
    print("k=1 Test accuracy:", test_acc1)
    print("---------------------")

    y_p_test3 = knn.hypothesis(X_test, k=3)
    test_acc3 = np.sum(y_p_test3 == y_test) / len(y_p_test3) * 100
    print("k=3 Test accuracy:", test_acc3)
    print("---------------------")

    y_p_test5 = knn.hypothesis(X_test, k=5)
    test_acc5 = np.sum(y_p_test5 == y_test) / len(y_p_test5) * 100
    print("k=5 Test accuracy:", test_acc5)
    print("---------------------")


def show_result(knn, data_set):
    """
    Show training results
    """
    print("k=1,1 Nearest neighbor")
    # data_set.X_test[0] is a tuple type
    n = data_set.X_test[0].shape[0]
    # data_set.X_test[0].reshape(-1,n) converts (64,) to (1,64) matrix
    print("Forecast category:", knn.hypothesis(data_set.X_test[0].reshape(-1, n), k=1))
    print("True category:", data_set.y_test[0])
    print("---------------------")

    print("k=5,5 Nearest neighbor")
    n = data_set.X_test[20].shape[0]
    print("Forecast category:", knn.hypothesis(data_set.X_test[20].reshape(-1, n), k=5))
    print("True category:", data_set.y_test[20])
    print("---------------------")

    print("Test 10 rows of data x5~x14;k=1,1 Nearest neighbor")
    print("Forecast categories:", knn.hypothesis(data_set.X_test[5:15], k=1))
    print("Real categories:", data_set.y_test[5:15])
    print("---------------------")

    print("Test data 10 lines x5~x14;k=4,4 Nearest neighbor")
    print("Forecast categories:", knn.hypothesis(data_set.X_test[5:15], k=4))
    print("Real categories:", data_set.y_test[5:15])
    print("---------------------")


def main():
    # Get dataset divide dataset show dataset
    data_set = get_data_set()
    # Construction KNN
    knn = K_NN(data_set.X_train, data_set.y_train)
    # Evaluating models using test sets
    evaluate_model(knn, data_set.X_test, data_set.y_test)
    # Show results
    show_result(knn, data_set)


if __name__ == "__main__":
    main();