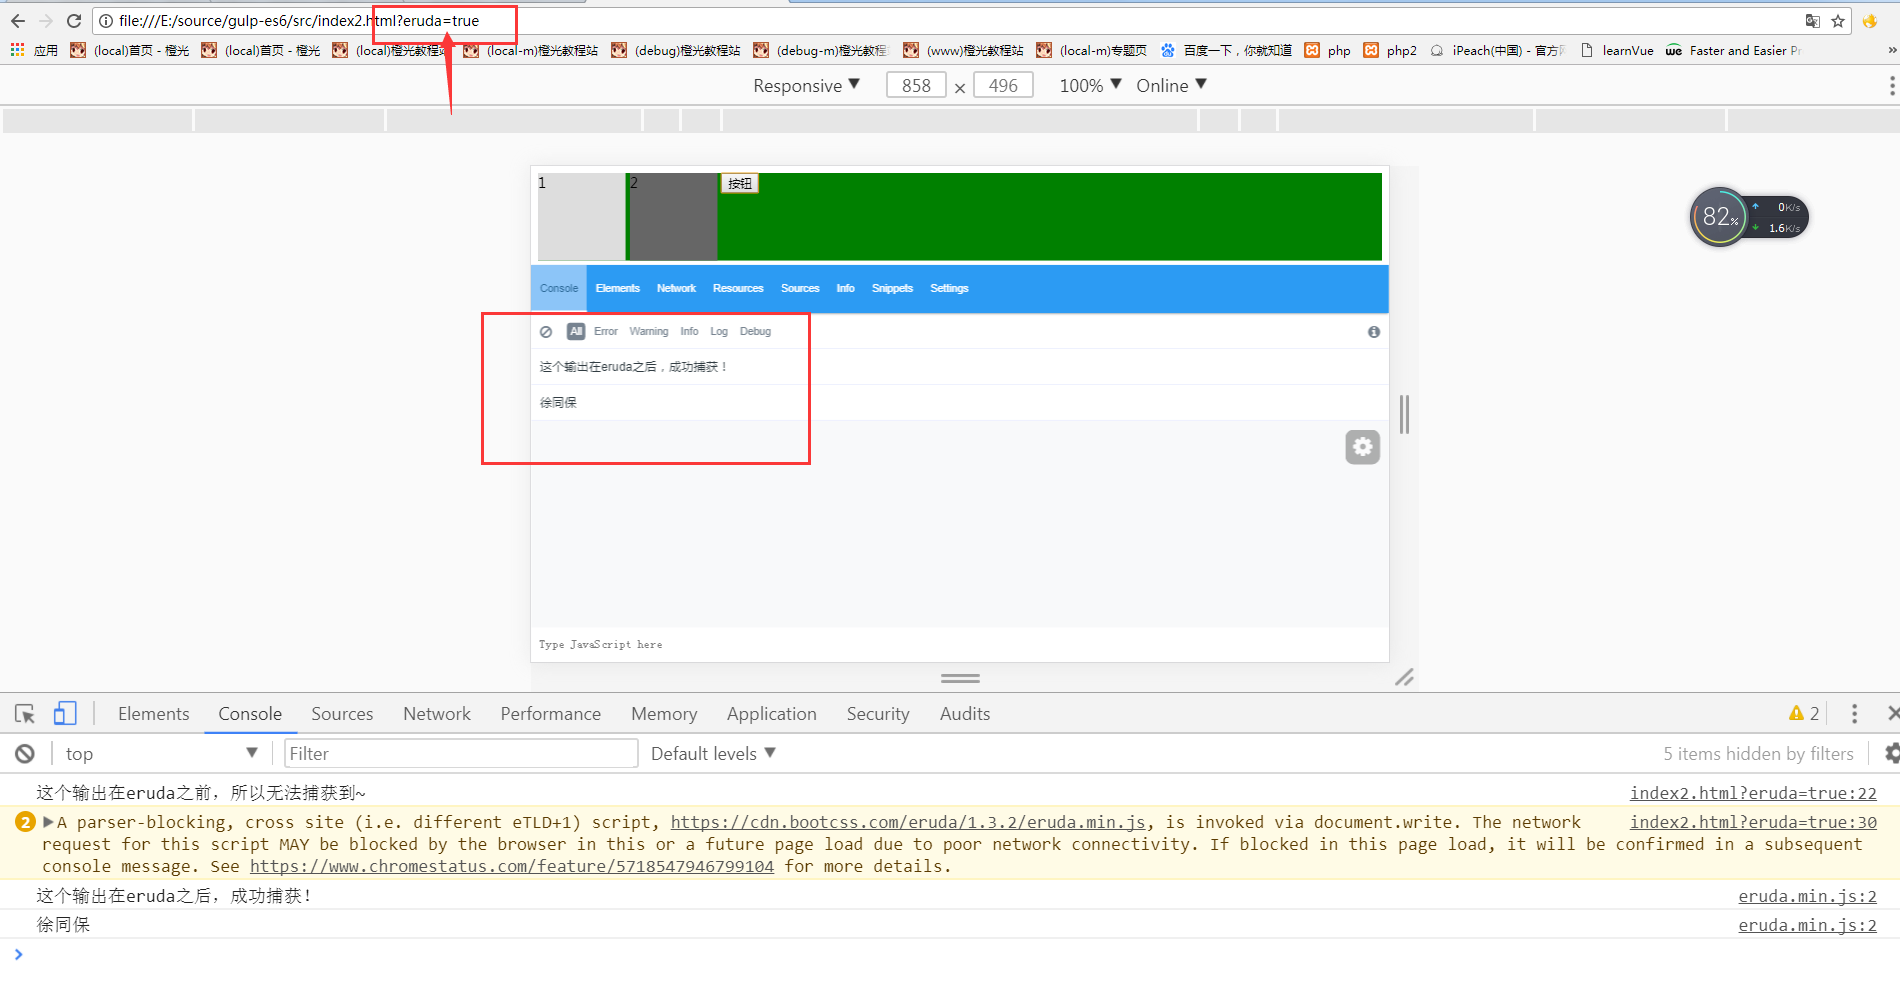
In the daily development of mobile terminal, we usually try the mobile terminal mode of Chrome browser for development and debugging. Only when chrome debugging is completed, can we go to the real machine for testing if there is no problem. This is the big problem of mobile terminal development,
Various brands and models of mobile phones, various types of browser apps in mobile phones....... Fortunately, the mobile terminal is relatively consistent, but there are always some kinds of pits, which makes it painful. It is clear that chrome debugging tools are normal,
Once in a browser, it will explode. What can I do? I can't use the debugging tools in chrome for debugging. I can only use the alert() pop-up window for debugging. What can I do to debug as clearly and visually as on a PC?
Today, I found a cool mobile debugging tool for fried chicken eruda , a little bit of history;
Eruda is a debugging panel specially designed for the front end of mobile web pages, similar to the mini version of devitools. Its main functions include: capturing console logs, checking element status, displaying performance indicators, capturing XHR requests, displaying local storage and Cookie information, browser feature testing, etc.
<!DOCTYPE html>
<html lang="en">
<head>
    <meta charset="UTF-8">
    <title>Mobile debugging artifact( eruda)</title>
    <style type="text/css">
      .test{background: green;}
      .one{display: inline-block; width:100px;height: 100px;background: #ddd;}
      .two{display: inline-block; width:100px;height: 100px;background: #666;}
    </style>
</head>
<body>

<div class="test">
  <div class="one">1</div>
  <div class="two">2</div>
  <button id="btn">Button</button>
</div>

<script src="https://cdn.bootcss.com/jquery/3.2.1/jquery.js"></script>
<script type="text/javascript">
  console.log('This output is in eruda Before, so we can't capture~');
</script>
<script type="text/javascript">
(function () {
    //var src = 'http://eruda.liriliri.io/eruda.min.js';
    //var src = 'https://cdn.jsdelivr.net/npm/eruda';
    var src = 'https://cdn.bootcss.com/eruda/1.3.2/eruda.min.js';

    //To add the following code, you need to fill in "eruda=true" in the url to start eruda
    //if (!/eruda=true/.test(window.location)) return;

    document.write('<scr' + 'ipt src="' + src + '"></scr' + 'ipt>');
    document.write('<scr' + 'ipt>eruda.init();</scr' + 'ipt>');
})();
</script>
<script type="text/javascript">
  console.log('This output is in eruda After that, capture successfully!');
  $('#btn').on('click', function() {
    console.log('Xu Tongbao');
  });
</script>
</body>
</html> 