There are many ways to measure the performance of the model. The index to evaluate the performance of the classifier is generally the classification accuracy, which is defined as the ratio of the number of samples correctly classified by the classifier to the total number of samples for a given test data set.
The commonly used evaluation indexes for binary classification problems are precision and recall. Usually, the concerned classes are positive and the other classes are negative. The classifier's prediction on the test data set is correct or incorrect, which can be divided into the following categories:
TP -- predict positive category as positive category
FN -- predict the positive category into the negative category
FP -- predict negative category as positive category
TN -- predict negative category as negative category
Accuracy is defined as:
P = TP/ TP+FP
It means the proportion of samples whose real category is positive among all the samples predicted to be positive
Recall rate is defined as:
R = TP /TP+FN
Its meaning is the proportion of all positive samples (denominator meaning), which is predicted to be positive samples
In addition, due to the contradiction between P and R indicators in some cases, a new evaluation index - F-Score is introduced
F1 is a kind of F-Score. At this time, the parameter beta=1 represents the harmonic average of accuracy rate and recall rate:
F1 = 2TP / 2TP+FP+FN
The higher F1, the better the performance of the model
Create a regression model and evaluate the model using the above indicators:
from sklearn import datasets
from sklearn import metrics
from sklearn.metrics import accuracy_score
from sklearn.model_selection import train_test_split
from sklearn.preprocessing import StandardScaler
import numpy as np
import matplotlib.pyplot as plt
from hyperopt import fmin, tpe, hp, Trials
from sklearn.svm import SVC
from sklearn.linear_model import LogisticRegression
# Import handwritten dataset
mnist = datasets.load_digits()
# Data standardization
mnist.data = StandardScaler().fit_transform(mnist.data)
# Stratified sampling
X_train, X_test, y_train, y_test = train_test_split(mnist.data, mnist.target
                                                    , test_size=0.3, random_state=0)

# Logistic regression creates instances and trains data
model = LogisticRegression().fit(X_train, y_train)
y_pre = model.predict(X_test)
# Classification accuracy
acc = accuracy_score(y_test, y_pre)
# Macro precision
macro = metrics.precision_score(y_test, y_pre, average="macro")
# Micro precision
micro = metrics.precision_score(y_test, y_pre, average="micro")
# Calculate different F1
f1 = metrics.f1_score(y_test, y_pre, average="macro")
# weighting
f1_weight = metrics.f1_score(y_test, y_pre, average="weighted")
# F-BETA
fbeta = metrics.fbeta_score(y_test, y_pre, average="macro", beta=1)
print(acc, macro, micro, f1, f1_weight, fbeta)
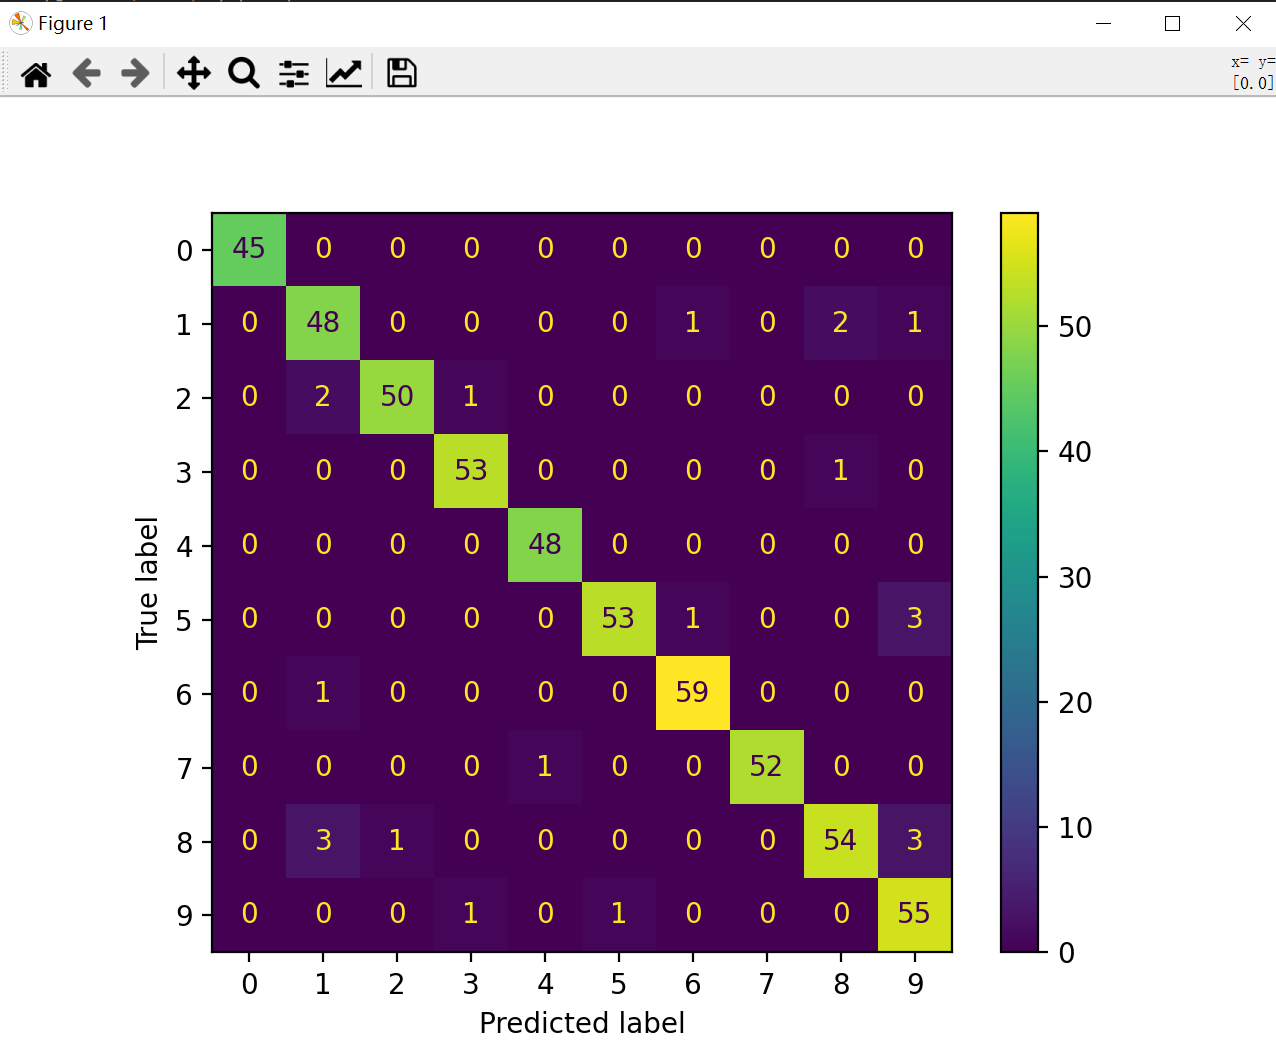
By drawing the confusion matrix, you can intuitively see the distribution of predicted value and real value:
Official documents: https://scikit-learn.org/stable/modules/generated/sklearn.metrics.confusion_matrix.html#sklearn.metrics.confusion_matrix
Note: version change removes an original version function
from sklearn.metrics import confusion_matrix, plot_confusion_matrix
from sklearn.metrics import ConfusionMatrixDisplay
# Draw confusion matrix
"""This method will be implemented in 1.2 For removal after version, the following presentation method is recommended
plot_confusion_matrix(model, X_test, y_test)
plt.show()
"""
cm = confusion_matrix(y_test, y_pre, labels=model.classes_)
disp = ConfusionMatrixDisplay(cm, display_labels=model.classes_)
disp.plot()
plt.show()
# Confusion matrix printout
print(cm)
Matrix shape:

For the confusion matrix output above, it can be seen that the number on the diagonal represents the number of correctly predicted samples, and if it is no longer on the diagonal, it represents the number of predicted negative samples (FN):
Then the accuracy P can be solved by the confusion matrix
P = TP / TP+FN
The total number of samples for each column on the horizontal axis is the total number of samples predicted to be positive under the current positive category, while the number of samples on the diagonal represents TP (positive category predicted to be positive)
Accordingly, when the denominator becomes the sum of row samples, it becomes R (recall rate)
# Calculate the precision using the confusion matrix
precision = np.diag(cm) / np.sum(cm, axis=0)
# Calculate recall rate
recall = np.diag(cm) / np.sum(cm, axis=1)
# Calculate f1
f1_score = 2*precision*recall / (precision+recall)
print("precision: \n", precision, "\nrecall: \n", recall)
Print accuracy and recall:

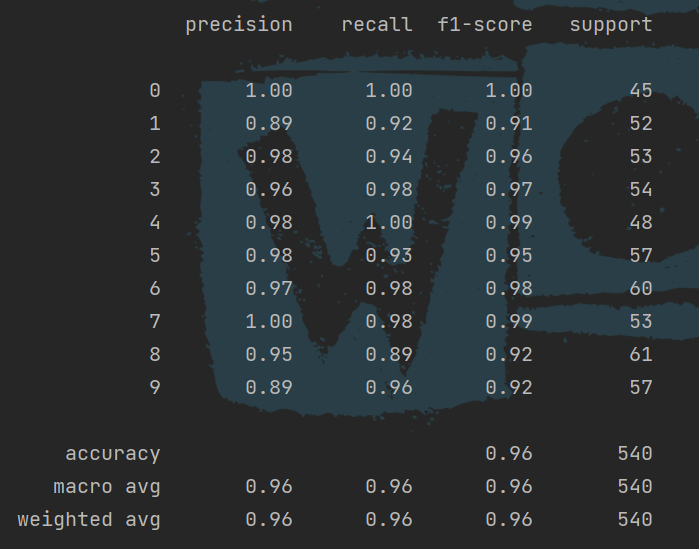
The use of classification report function, the import package is:
from sklearn.metrics import confusion_matrix, plot_confusion_matrix, classification_report
# Classification Report
cr = classification_report(y_test, y_pre)
print(cr)
The tool can easily calculate the accuracy rate, recall rate and so on:

In addition, you can use pandas to package and output data:
prfs = metrics.precision_recall_fscore_support(y_test, y_pre)
score_data = pd.DataFrame(prfs, index=["precision", "recall", "fscore", "support"])
print(score_data)
The effect is shown in the figure:

Full code:
import pandas as pd
from sklearn import datasets
from sklearn import metrics
from sklearn.metrics import accuracy_score
from sklearn.model_selection import train_test_split
from sklearn.preprocessing import StandardScaler
import numpy as np
import matplotlib.pyplot as plt
from hyperopt import fmin, tpe, hp, Trials
from sklearn.svm import SVC
# Import confusion matrix
from sklearn.metrics import confusion_matrix, plot_confusion_matrix, classification_report
from sklearn.metrics import ConfusionMatrixDisplay
from sklearn.linear_model import LogisticRegression

# Import handwritten dataset
mnist = datasets.load_digits()
# Data standardization
mnist.data = StandardScaler().fit_transform(mnist.data)
# Stratified sampling
X_train, X_test, y_train, y_test = train_test_split(mnist.data, mnist.target
                                                    , test_size=0.3, random_state=0)

# Logistic regression creates instances and trains data
model = LogisticRegression().fit(X_train, y_train)
y_pre = model.predict(X_test)
"""# Classification accuracy
acc = accuracy_score(y_test, y_pre)
# Macro precision
macro = metrics.precision_score(y_test, y_pre, average="macro")
# Micro precision
micro = metrics.precision_score(y_test, y_pre, average="micro")
# Calculate different F1
f1 = metrics.f1_score(y_test, y_pre, average="macro")
# weighting
f1_weight = metrics.f1_score(y_test, y_pre, average="weighted")
# F-BETA
fbeta = metrics.fbeta_score(y_test, y_pre, average="macro", beta=1)
print(acc, macro, micro, f1, f1_weight, fbeta)"""
# Draw confusion matrix
"""This method will be implemented in 1.2 For removal after version, the following presentation method is recommended
plot_confusion_matrix(model, X_test, y_test)
plt.show()
"""

cm = confusion_matrix(y_test, y_pre, labels=model.classes_)
disp = ConfusionMatrixDisplay(cm, display_labels=model.classes_)
"""disp.plot()
plt.show()"""
# Confusion matrix printout
"""print(cm)
# Classification Report
cr = classification_report(y_test, y_pre)
print(cr)"""
"""
prfs = metrics.precision_recall_fscore_support(y_test, y_pre)
score_data = pd.DataFrame(prfs, index=["precision", "recall", "fscore", "support"])
print(score_data)"""
# Calculate the precision using the confusion matrix
precision = np.diag(cm) / np.sum(cm, axis=0)
# Calculate recall rate
recall = np.diag(cm) / np.sum(cm, axis=1)
# Calculate f1
f1_score = 2*precision*recall / (precision+recall)
support = np.sum(cm, axis=1)
support_all = np.sum(cm)
accuracy = np.sum(np.diag(cm)) / support_all
weight = support /support_all
# Macro precision, macro recall, macro F1
macro_avg = [precision.mean(), recall.mean(), f1_score.mean()]
# Weighted precision, recall. F1
weight_avg = [np.sum(weight*precision), np.sum(weight*recall),
              np.sum(weight*f1_score)]
metrics1 = pd.DataFrame(np.array([precision, recall, f1_score, support]).T,
                        columns=["precision", "recall", "f1_score", "support"])
metrics2 = pd.DataFrame([["", "", "", ""], ["", "", accuracy, support_all],
                         np.hstack([macro_avg, support_all]),
                         np.hstack([weight_avg, support_all])],
                        columns=["precision", "recall", "f1_score", "support"])
metrics_total = pd.concat([metrics1, metrics2], ignore_index=False)
print(metrics_total)