1.1 problems
In this case, you are required to be familiar with the common commands for viewing the Linux system status and prepare for further specific monitoring tasks:
- View memory information
- View swap partition information
- View disk information
- View CPU Information
- View network card information
- View port information
- View network connection information
1.2 scheme
The purpose of general enterprise monitoring is to report the system status in real time and find the system problems in advance.
The monitored resources can be divided into common data (HTTP, FTP, etc.) and private data (CPU, memory, number of processes, etc.).
The monitoring software can use the commands provided by the system, Cacti monitoring system, Nagios monitoring system and Zabbix monitoring system.
1.3 steps
To implement this case, you need to follow the following steps.
Step 1: use the command to view the computer status data
1) View memory and swap partition information
[root@proxy ~]# free                                     #View memory information
              total        used        free      shared  buff/cache   available
Mem:       16166888     8017696      720016      106504     7429176     7731740
Swap:       4194300      218268     3976032
[root@proxy ~]# free | awk '/Mem/{print $4}'                #View remaining memory capacity
720928
[root@proxy ~]# swapon -s                                #View swap partition information
 file name                type            size        Used        jurisdiction
/dev/sda3             partition        4194300    218268    -1
Step 2: check disk and CPU utilization
1) View disk information
[root@proxy ~]# df                                     #View usage of all disks
 file system           1K-block      Used      available         Used% Mount point
/dev/sda2        476254208    116879624    335159084    26%        /
/dev/sda1        198174        133897        49737        73%        /boot
[root@proxy ~]# df | awk '/\/$/{print $5}'            #View the utilization of the root partition
2) View average CPU load
[root@proxy ~]# uptime                             #View CPU load (1, 5, 15 minutes)
 23:54:12 up 38 days, 14:54,  9 users,  load average: 0.00, 0.04, 0.05
[root@proxy ~]# uptime |awk '{print $NF}'            #View only the 15 minute average load of the CPU
0.05
Step 2: View network card information, port information and network connection information
1) Check the network card information (the network card name is for reference only). If there is no ifconfig command, you need to install the net tools package.
[root@proxy ~]# ifconfig eth0
eth0: flags=4163<UP,BROADCAST,RUNNING,MULTICAST>  mtu 1500
        inet 192.168.4.5  netmask 255.255.255.0  broadcast 172.25.0.255
        inet6 fe80::5054:ff:fe00:b  prefixlen 64  scopeid 0x20<link>
        ether 52:54:00:00:00:0b  txqueuelen 1000  (Ethernet)
        RX packets 62429  bytes 10612049 (10.1 MiB)
        RX errors 0  dropped 0  overruns 0  frame 0
        TX packets 5674  bytes 4121143 (3.9 MiB)
        TX errors 0  dropped 0 overruns 0  carrier 0  collisions 0
[root@proxy ~]# ifconfig eth0 |awk '/inet /{print $2}'        #View IP address information
192.168.4.5
[root@proxy ~]# ifconfig eth0 |awk '/RX p/{print $5}'        #Network card accepts packet traffic
10625295
[root@proxy ~]# ifconfig eth0 |awk '/TX p/{print $5}'        #Packet traffic sent by network card
4130821
2) View port information
[root@proxy ~]# ss -ntulp                                #View all ports monitored by this machine
#-n displays the port number in numbers
#-Tdisplay tcp connec t ions
#-u show udp connections
#-p displays the program name corresponding to the listening port
3) View network connection information
[root@proxy ~]# ss -antup                                #View all network connection information
#-a view all connection status information
2. Deploy Zabbix monitoring platform
2.1 problems
This case requires the deployment of a Zabbix monitoring server and a monitored host to prepare for further implementation of specific monitoring tasks:
- Install LNMP environment
- Source code installation Zabbix
- Install the monitoring host and modify the basic configuration
- Initialize Zabbix monitoring Web page
- Modify the PHP configuration file to meet the needs of Zabbix
- Install the monitored end host and modify the basic configuration
2.2 scheme
Use a Linux virtual machine, install and deploy LNMP environment, Zabbix and related dependent packages, configure database, and initialize Zabbix monitoring platform. Use 2 Linux monitored terminals and install Zabbix Agent with the source code. To complete the Zabbix experiment, we need to build an experimental environment. The topology is shown in TABLE-1.
TABLE-1 experimental topology (network card name is for reference only and cannot be copied)

2.3 steps
To implement this case, you need to follow the following steps.
Step 1: deploy the monitoring server
1) Install LNMP environment
Zabbix monitoring management console needs to be displayed through Web pages, and MySQL needs to be used to store data. Therefore, it is necessary to prepare the basic LNMP environment for Zabbix first.
[root@zabbixserver ~]# yum -y install gcc pcre-devel  openssl-devel
[root@zabbixserver ~]# tar -xf nginx-1.12.2.tar.gz
[root@zabbixserver ~]# cd nginx-1.12.2
[root@zabbixserver nginx-1.12.2]# ./configure --with-http_ssl_module
[root@zabbixserver nginx-1.12.2]# make && make install
[root@zabbixserver ~]# yum -y  install  php  php-mysql  php-fpm
[root@zabbixserver ~]# yum -y  install  mariadb  mariadb-devel  mariadb-server
2) Modify Nginx configuration file
Configure Nginx to support PHP dynamic websites. Because a large number of PHP scripts need to be executed, you also need to open various fastcgi caches of Nginx to speed up the execution of PHP scripts.
[root@zabbixserver ~]# vim /usr/local/nginx/conf/nginx.conf
... ...
http{
... ...
    fastcgi_buffers 8 16k;              #Cache the page content generated by php, 8 16k
    fastcgi_buffer_size 32k;              #Cache header information produced by php, 32k
    fastcgi_connect_timeout 300;         #Timeout for connecting to PHP, 300 seconds
    fastcgi_send_timeout 300;             #Timeout for sending request, 300 seconds
    fastcgi_read_timeout 300;            #Timeout for read request, 300 seconds
location ~ \.php$ {
                root           html;
                fastcgi_pass   127.0.0.1:9000;
                fastcgi_index  index.php;
                include        fastcgi.conf;   #[be careful not to make mistakes here]
        }
... ...
3) Start service
Start Nginx, PHP FPM and MariaDB services, and close SELinux and firewall.
[root@zabbixserver ~]# systemctl start  mariadb        #Start service
[root@zabbixserver ~]# systemctl start  php-fpm        #Start service
[root@zabbixserver ~]# systemctl enable  mariadb        #Set startup and self startup
[root@zabbixserver ~]# systemctl enable  php-fpm        #Set startup and self startup
[root@zabbixserver ~]# /usr/local/nginx/sbin/nginx        #Start service
[root@zabbixserver ~]# echo /usr/local/nginx/sbin/nginx  >> /etc/rc.local
[root@zabbixserver ~]# chmod +x /etc/rc.local
#By RC Local set startup and self startup
[root@zabbixserver ~]# firewall-cmd --set-default-zone=trusted
[root@zabbixserver ~]# setenforce 0
[root@zabbixserver ~]# sed -i '/SELINUX/s/enforcing/permissive/' /etc/selinux/config
Step 2: deploy the monitoring server Zabbix Server
1) Source code installation Zabbix Server
Most source packages need dependent packages, and zabbix is the same. Before compiling the source code, you need to install the relevant dependent packages.
[root@zabbixserver lnmp_soft]# yum -y install  net-snmp-devel \
curl-devel autoconf libevent-devel
#Install dependent packages
[root@zabbixserver lnmp_soft]# tar -xf zabbix-3.4.4.tar.gz
[root@zabbixserver lnmp_soft]# cd zabbix-3.4.4/
[root@zabbixserver zabbix-3.4.4]# ./configure  --enable-server \
 --enable-proxy --enable-agent --with-mysql=/usr/bin/mysql_config \
 --with-net-snmp --with-libcurl
# --Enable server installs and deploys zabbix server-side software
# --Enable agent installs and deploys zabbix monitored end software
# --Enable proxy installs and deploys zabbix proxy related software
# --With MySQL specifies mysql_config path
# --With net snmp allows zabbix to monitor other devices (such as switches, routers, etc.) through snmp protocol
# --With libcurl installs the relevant curl library files, so that zabbix can connect to http and other services through curl to test the status of the monitored host services
[root@zabbixserver zabbix-3.4.4]# make && make install
2) Create and initialize the database (root has no password by default)
[root@zabbixserver ~]# mysql
mysql> create database zabbix character set utf8;
#Create a database named zabbix. character set utf8 supports Chinese character sets
mysql> grant all on zabbix.* to zabbix@'localhost' identified by 'zabbix';
#Create an account and password that can access the database. The user name is zabbix and the password is zabbix
mysql> exit
#Exit database
[root@zabbixserver ~]# cd lnmp_soft/zabbix-3.4.4/database/mysql/
[root@zabbixserver mysql]# mysql -uzabbix -pzabbix zabbix < schema.sql
[root@zabbixserver mysql]# mysql -uzabbix -pzabbix zabbix < images.sql
[root@zabbixserver mysql]# mysql -uzabbix -pzabbix zabbix < data.sql
#Just created is an empty database. Under the zabbix source package directory, there is data prepared in advance
#Use mysql to import these data (pay attention to the import order)
#-u specifies the database user name and - p specifies the database password
 How to test?
[root@zabbixserver ~]# mysql -uzabbix -pzabbix -h localhost zabbix
#-u specifies the user name, - p specifies the password, - h specifies the server IP, and the last zabbix is the database name
#Use the zabbix account (password zabbix) to connect to the zabbix database on the localhost server
mysql> show tables;
#See if there is a data table
mysql> exit
#Exit database
3) Modify zabbix_server configure and start monitoring service
Modify Zabbix_server configuration file, set database related parameters, and start Zabbix_server service
[root@zabbixserver ~]# vim /usr/local/etc/zabbix_server.conf
DBHost=localhost
# Line 85 defines which host is the database host and localhost is the local host
DBName=zabbix
#Line 95, set database name
DBUser=zabbix
#Line 111, set the database account
DBPassword=zabbix
#Line 119, set the database password
LogFile=/tmp/zabbix_server.log
#Line 38, the location of the log. It is used for troubleshooting. This line can only be viewed
[root@zabbixserver ~]# useradd -s /sbin/nologin zabbix
#The service is not allowed to be started as root. The service cannot be started without creating a user (the user does not need to log in to the system)
#Create a zabbix user to start the service as a zabbix user
#After starting the service, you can check the identity of the user who started the process through ps aux
Manage the zabbix service by creating a service file.
[root@zabbixserver ~]# vim /usr/lib/systemd/system/zabbix_server.service
[Unit]
Description=zabbix server
After=network.target remote-fs.target nss-lookup.target
[Service]
Type=forking
PIDFile=/tmp/zabbix_server.pid
ExecStart=/usr/local/sbin/zabbix_server
ExecStop=/bin/kill $MAINPID
[Install]
WantedBy=multi-user.target
[root@zabbixserver ~]# systemctl  enable  zabbix_server  --now
[root@zabbixserver ~]# ss -ntulp |grep zabbix_server     #Confirm the connection status, port 10051
tcp LISTEN 0 128 *:10051 *:* users:(("zabbix_server",pid=23275,fd=4),("zabbix_server",pid=23274,fd=4)
- Modify Zabbix_agent configuration file, start Zabbix_agent service
[root@zabbixserver ~]# vim /usr/local/etc/zabbix_agentd.conf
Server=127.0.0.1,192.168.2.5            #Line 93, which hosts are allowed to monitor this machine
ServerActive=127.0.0.1,192.168.2.5        #134 line, which hosts are allowed to monitor this machine through active mode
Hostname=zabbix_server                #145 line, set the local host name (the name can be any)
LogFile=/tmp/zabbix_agentd.log            #Set log file (no modification required)
UnsafeUserParameters=1                #Line 280, allow user-defined monitoring and parameter transfer
Write zabbix_agentd's service file manages services through systemd.
[root@zabbixserver ~]# vim /usr/lib/systemd/system/zabbix_agentd.service
[Unit]
Description=zabbix agent
After=network.target remote-fs.target nss-lookup.target
[Service]
Type=forking
PIDFile=/tmp/zabbix_agentd.pid
ExecStart=/usr/local/sbin/zabbix_agentd
ExecStop=/bin/kill $MAINPID
[Install]
WantedBy=multi-user.target
[root@zabbixserver ~]# systemctl enable zabbix_agentd --now
[ root@zabbixserver ~]# ss -ntulp |grep zabbix_agentd # view port information as 10050
tcp LISTEN 0 128 *:10050 : users:(("zabbix_agentd",pid=23505,fd=4),("zabbix_agentd",pid=23504,fd=4)
5)go online Zabbix of Web page
```shell
[root@zabbixserver ~]# cd lnmp_soft/zabbix-3.4.4/frontends/php/
[root@zabbixserver php]# cp -r * /usr/local/nginx/html/
[root@zabbixserver php]# chown -R  apache.apache /usr/local/nginx/html/
#Modify owner usage here: or Fine.
#The reasons for modifying permissions are as follows:
#The account of PHP FPM is apache. Later, we need PHP FPM to read and write the website directory,
#While / usr/local/nginx/html is owned by root by default, only root has write permission, and PHP FPM has no write permission
Browser access to ZABBIX_ Web page for server
Firefox browser access[ firefox http://192.168.2.5/index.php ]
#On the first visit, the initialization PHP page will check whether the computer environment meets the requirements. If not, it will give modification suggestions
#By default, you will be prompted that the PHP configuration does not meet the environmental requirements and you need to modify the PHP configuration file
According to the error prompt, install the dependency and modify the PHP configuration file to meet Zabbix_server environment requirements.
[root@zabbixserver ~]# yum -y install  php-gd  php-xml
[root@zabbixserver ~]# yum -y install  php-bcmath  php-mbstring
[root@zabbixserver ~]# vim /etc/php.ini
date.timezone = Asia/Shanghai                #Line 878, set time zone
max_execution_time = 300                    #384 lines, maximum execution time, seconds
post_max_size = 32M                        #672 lines, maximum capacity of POST data
max_input_time = 300                        #Line 394, the time limit for the server to receive data
[root@zabbixserver ~]# systemctl restart php-fpm
After modifying the PHP configuration file, if you use the browser to access the server again, you will be prompted as shown in figure-1 and figure-2.
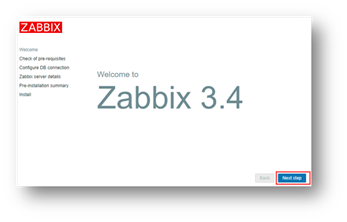
Figure-1
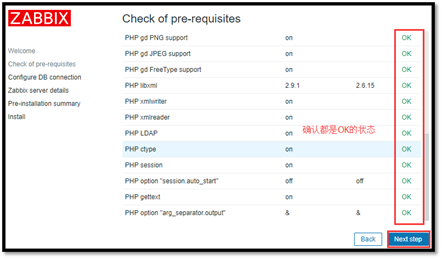
Figure-2
Note: there is a PHP LDAP warning status here. There is no problem!
On the initialize database page, fill in the database related parameters, as shown in figure-3.
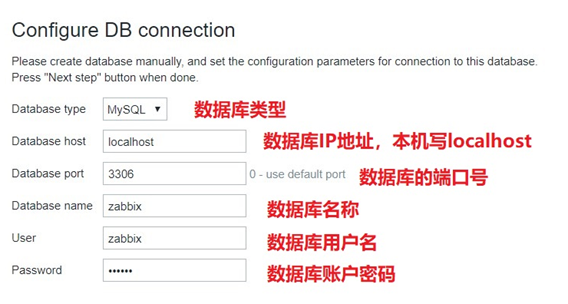
Figure-3
On the login page, log in with user (admin) and password (zabbix), and set the language environment to Chinese after login, as shown in figure-4 and figure-5.
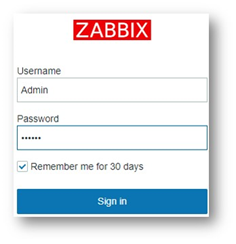
Figure-4
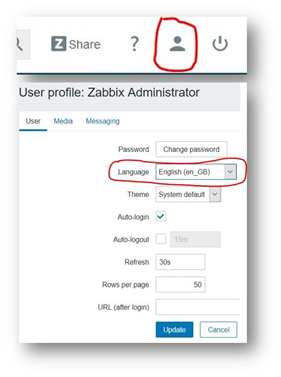
Figure-5
Step 3: deploy the monitored host Zabbix Agent
1) Source code: install Zabbix agent software
Do the same operation on 2.100 and 2.200 (take web1 as an example).
[root@web1 ~]# useradd -s /sbin/nologin  zabbix
[root@web1 ~]# yum -y install gcc pcre-devel autoconf
[root@web1 ~]# tar -xf zabbix-3.4.4.tar.gz
[root@web1 ~]# cd zabbix-3.4.4/
[root@web1 zabbix-3.4.4]# ./configure --enable-agent
[root@web1 zabbix-3.4.4]# make && make install
2) Modify the agent configuration file and start the agent
[root@web1 ~]# vim /usr/local/etc/zabbix_agentd.conf
Server=127.0.0.1,192.168.2.5                #Line 93, who can monitor the machine (passive monitoring mode)
ServerActive=127.0.0.1,192.168.2.5            #Line 134, who can monitor the machine (active monitoring mode)
Hostname=web1                                    #145 line, the host name of the monitored end
EnableRemoteCommands=1
#Line 69, after monitoring the exception, whether to allow the server to remotely execute commands, such as restarting a service
UnsafeUserParameters=1                    #Line 280, allow user-defined key parameter transfer
[root@web1 ~]# firewall-cmd --set-default-zone=trusted
[root@web1 ~]# sed -i  '/SELINUX/s/enforcing/permissive/' /etc/selinux/config
[root@web1 ~]# setenforce 0
[root@web1 ~]# vim /usr/lib/systemd/system/zabbix_agentd.service
[Unit]
Description=zabbix agent
After=network.target remote-fs.target nss-lookup.target
[Service]
Type=forking
PIDFile=/tmp/zabbix_agentd.pid
ExecStart=/usr/local/sbin/zabbix_agentd
ExecStop=/bin/kill $MAINPID
[Install]
WantedBy=multi-user.target
[root@web1 ~]# systemctl enable  zabbix_agentd   --now
#Start the server and set the boot self boot
3. Configure and use Zabbix monitoring system
3.1 problems
Following exercise 1, use the Zabbix monitoring platform to monitor the Linux server to achieve the following objectives:
- Monitor CPU
- Monitor memory
- Monitoring process
- Monitor network traffic
- Monitoring hard disk
3.2 scheme
Through the Zabbix monitoring platform, add the monitored web1 host (192.168.2.100) and link the monitoring template. The Zabbix default template can monitor CPU, memory, process, network, disk and other items.
3.3 steps
To implement this case, you need to follow the following steps.
Step 1: add monitoring host
Host is the basis of Zabbix monitoring. All Zabbix monitoring is based on host.
Log in using Firefox http://192.168.2.5/index.php , add the monitored Linux host through Configuration - > hosts - > create host, as shown in Figure - 7.
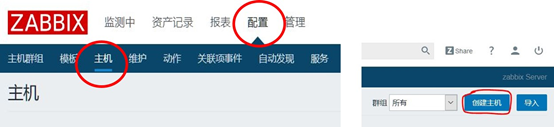
Figure-7
When adding a monitored host, you need to enter the host name of the monitored Linux host (preferably consistent with the host name of the computer, but it is also allowed to be inconsistent), host group, IP address and other parameters according to the prompt, as shown in figure-8.
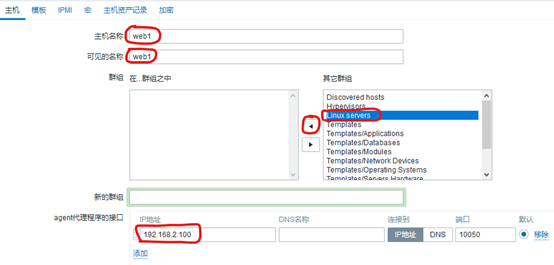
Figure-8
Step 2: add a monitoring template for the monitored host
Click < template >, Zabbix implements specific monitoring functions on the monitoring objects through the monitoring template, and defines what data needs to be monitored according to the template. For the monitoring of Linux server, Zabbix has bui lt-in relevant template (Template OS Linux). Select the template and link it to the host, as shown in figure-9.
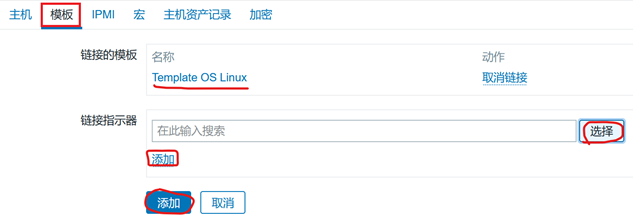
Figure-9
Step 3: View monitoring data
Check the monitoring data, log in to the Zabbix Web console, click monitoring - > latest data, fill in the filter conditions, and select which monitoring data to view according to the monitoring group and monitoring host, as shown in figure-10.
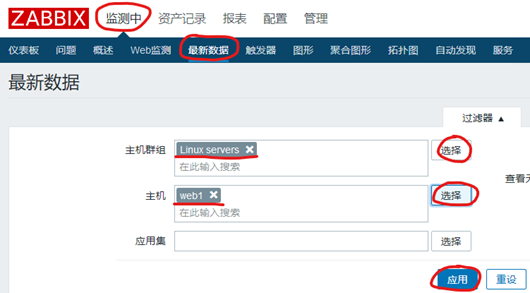
Figure-10
After finding the data to be monitored, you can click the following Graph to view the monitoring Graph, as shown in figure-11.
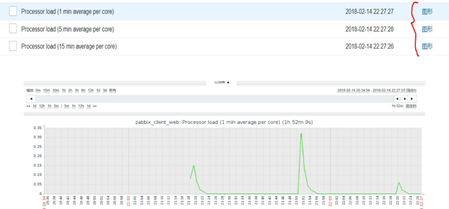
Figure-11
4. Customize Zabbix monitoring items
4.1 problems
Follow exercise 2 and use Zabbix to achieve custom monitoring to achieve the following objectives:
- Monitor the number of Linux server system accounts
4.2 scheme
You need to use Zabbix custom key to realize custom monitoring. Refer to the following steps:
- Create a custom key
- Create monitoring items
- Create monitoring graphics
- Associate a monitoring template to a host
4.3 steps
To implement this case, you need to follow the following steps.
Step 1: the monitored host creates a user-defined key (operated on 192.168.2.100)
1) Create a custom key
Custom key syntax format: UserParameter = custom key name, command.
Custom key files are generally stored in / usr/local/etc/zabbix_agentd.conf.d/ directory, and ZABBIX needs to be modified here_ agentd. Conf file, which allows you to customize the monitoring key to read all files in this directory.
[root@web1 ~]# vim /usr/local/etc/zabbix_agentd.conf
Include=/usr/local/etc/zabbix_agentd.conf.d/             #Line 264, load the configuration file directory
[root@web1 ~]# cd /usr/local/etc/zabbix_agentd.conf.d/
[root@web1 zabbix_agentd.conf.d]# vim count.line.passwd
UserParameter=count.line.passwd,sed -n '$=' /etc/passwd
#Custom key syntax format:
#UserParameter = user defined key name, command
2) Test whether the custom key works normally
[root@web1 ~]# systemctl restart  zabbix_agentd                #Restart agent service
[root@web1 ~]# zabbix_get -s 127.0.0.1 -k count.line.passwd
21
Note: e.g. zabbix_get command execution error, prompt Check access restrictions in Zabbix agent configuration, then check whether the agent configuration file is correct:
[root@web1 ~]# vim /usr/local/etc/zabbix_agentd.conf
Server=127.0.0.1,192.168.2.5
ServerActive=127.0.0.1,192.168.2.5
Step 2: create a monitoring template
Refer to figure-12 for the relationship between template, application set and monitoring items
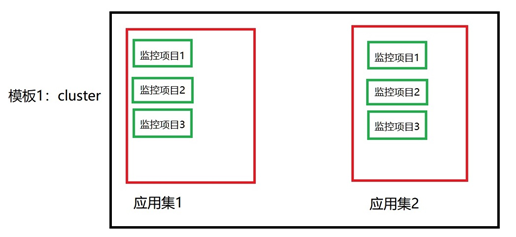
Figure-12
1) Add monitoring template
Log in to the Zabbix Web monitoring console, fill in the template name through configuration - > template - > create template, and create a new template group, as shown in figure-13.
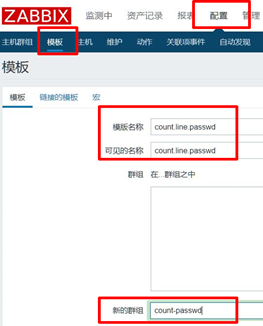
Figure-13
After the template is created, there are no application sets, monitoring items, triggers, graphics, etc. in the default template, as shown in figure-14.

Figure-14
2) Create application set
After the template is created, there are no Application sets, monitoring items, triggers, graphics and other resources in the default template. Here, you need to click the Application link behind the template to open the page of creating Application set, as shown in figure-15.

Figure-15
After clicking Application set, the page shown in figure-16 will be refreshed, and click the Create application button on this page.

Figure-16
Set the application set name, which can be any, as shown in figure-17.

Figure-17
3) Create monitoring item
Like creating an application set, you also need to create monitoring items in the template, as shown in figure-18. Click items and select Create items in the refreshed new page to Create items, as shown in figure-19.

Figure-18

Figure-19
Next, you also need to set the name of the project (the name can be arbitrary) and the corresponding user-defined key (which must be consistent with the previously customized monitoring key name), as shown in figure-20.
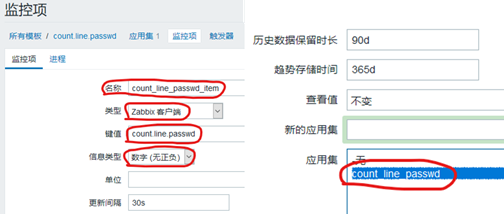
Figure-20
4) Link template to monitored host
After making the complete monitoring template, you can link the template to the host to realize the monitoring function. First, find the monitored host Configuration - > hosts, as shown in figure-21.
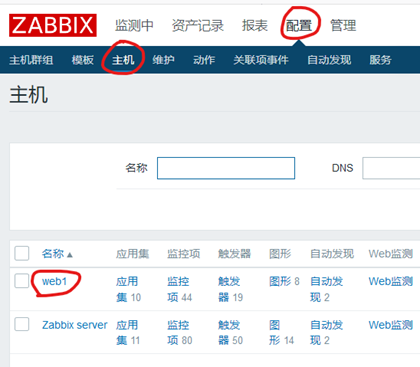
Figure-21
Click the required monitored host link to open the monitoring host setting page, select the Template to be linked to the host in the Template page, and select the newly created Template count_line.passwd here to add, as shown in figure-22.
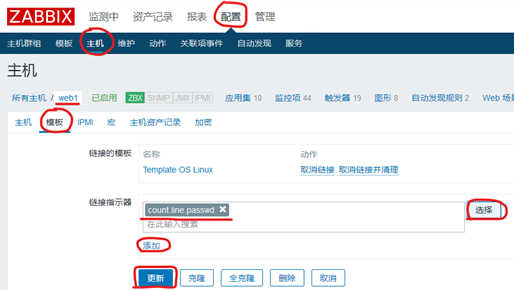
Figure-22
6) View monitoring data graph
Click monitoring - > latest data, select conditions as required, and view the monitoring graph, as shown in Figure - 23 and figure - 24.
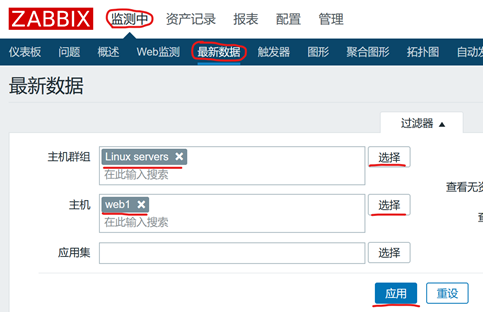
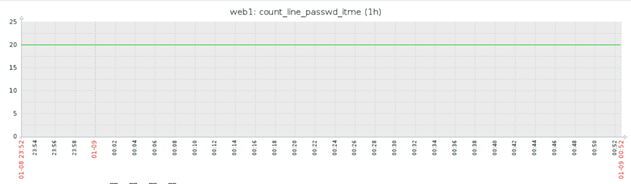
Figure-24
Additional mind map, as shown in figure-25:
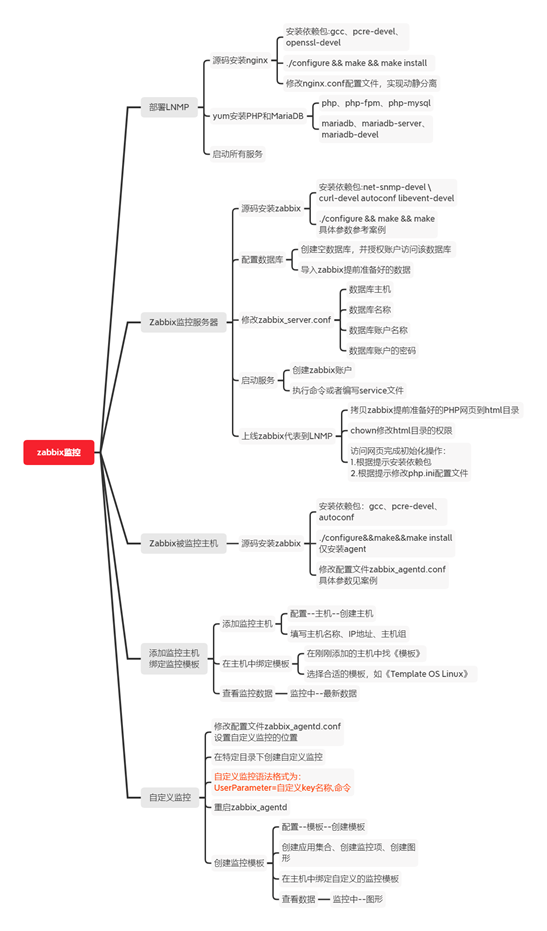
Figure-25
Exercise
1 briefly describe what monitoring functions Zabbix has
- It has the functions of common commercial monitoring software
- Host performance monitoring, network equipment monitoring, database monitoring, etc
- Support multiple alarm mechanisms
- Support automatic discovery of network devices and servers
- This can be achieved by configuring auto discovery server rules
- It supports distributed, and can display and manage distributed monitoring points
- It is easy to write plug-ins, and you can customize monitoring items
- With real-time drawing function
2. Briefly describe the operation steps of source code compilation and installation of Zabbix platform
[root@zabbixserver ~]# tar  zabbix-2.2.1.tar.gz -C /usr/src
[root@zabbixserver ~]# cd /usr/src/zabbix-2.2.1/
[root@zabbixserver zabbix-2.2.1]# ./configure \
>--prefix=/usr/local/zabbix --enable-server --enable-proxy \
>--enable-agent --with-mysql=/usr/bin/mysql_config \
> --with-net-snmp --with-libcurl
[root@zabbixserver zabbix-2.2.1]# make && make install
3 what items can be monitored using the Template OS Linux template
- Monitor CPU
- Monitor memory
- Monitoring process
- Monitor network traffic
- Monitoring hard disk
4 Zabbix_ What is the name of the agent configuration file
zabbix_agentd.conf.
In case of infringement, please contact the author to delete