1. Front
Prometheus + Grafana are deployed in docker mode. If there is no docker, the following content will be very difficult
The length is a little long, but there must be no problem following the steps. There will be a corresponding directory on the left or right, as well as at the beginning of the article
The renderings are in 7, 8 and 9. You can directly click the renderings to jump to view them
Finally, each document will be listed, as well as the corresponding instructions and points needing attention
edition:
docker pull prom/prometheus:latest # Probably v2 29.*
docker pull grafana/grafana:latest # About 7.5*

Spring Boot: 2.2.5.RELEASE
spring-boot-starter-actuator: 2.2.5.RELEASE
micrometer-registry-prometheus: 1.3.5
druid-spring-boot-starter: 1.1.24
2. Run project
pom.xml
<parent>
   <groupId>org.springframework.boot</groupId>
    <artifactId>spring-boot-starter-parent</artifactId>
    <version>2.2.5.RELEASE</version>
    <relativePath/> <!-- lookup parent from repository -->
</parent>

<!-- Blog test cases, The package was not introduced, If monitoring druid, This must be dripping -->
<!--introduce druid rely on
<dependency>
    <groupId>com.alibaba</groupId>
    <artifactId>druid-spring-boot-starter</artifactId>
    <version>1.1.24</version>
</dependency>-->

<dependency>
    <groupId>org.springframework.boot</groupId>
    <artifactId>spring-boot-starter-actuator</artifactId>
</dependency>

<dependency>
    <groupId>io.micrometer</groupId>
    <artifactId>micrometer-registry-prometheus</artifactId>
</dependency>
application.yml:
server:
  port: 8080
  tomcat:
    # tomcat detection. If it is not enabled, the indicators of tomcat may not be obtained
    mbeanregistry:
      enabled: true

management:
  endpoints:
    web:
      exposure:
        include: "*"
  server:
    port: 8088
Run the project and this step is over
3. Deploy Prometheus
1.prometheus.yml
# my global config
global:
  scrape_interval:     60s # Set the scrape interval to every 15 seconds. Default is every 1 minute.
  evaluation_interval: 60s # Evaluate rules every 15 seconds. The default is every 1 minute.
  # scrape_timeout is set to the global default (10s).

# Alertmanager configuration
alerting:
  alertmanagers:
  - static_configs:
    - targets:
      # - alertmanager:9093

# Load rules once and periodically evaluate them according to the global 'evaluation_interval'.
rule_files:
  # - "first_rules.yml"
  # - "second_rules.yml"

# A scrape configuration containing exactly one endpoint to scrape:
# Here it's Prometheus itself.
scrape_configs:
  - job_name: Test
     # How often do you collect data
    scrape_interval: 15s
    # Timeout during collection
    scrape_timeout: 10s
    # Acquisition path
    metrics_path: '/actuator/prometheus'
    # The address of the collection service is set to the specific address of the server where the Springboot application is located
    # 8088: management. Is specified server.port is the value. If it is not specified, it is server port
    static_configs:
    - targets: ['192.168.1.30:8088']
How and where to find this file:
https://prometheus.io/docs/prometheus/latest/installation/
Classify using pre compiled binaries and click download section. After decompression, a Prometheus will appear yml
perhaps
# Run prometheus first
docker run -p 9090:9090 --name prometheus -d prom/prometheus
# Copy from container
# E: / / the windows path is the Linux path/***/***
docker cp prometheus:/etc/prometheus/prometheus.yml E://
2. Operation
1. docker run mode
docker run --name prometheus -p 9090:9090 -v E:\Docker\prometheus\prometheus\prometheus.yml:/etc/prometheus/prometheus.yml  -d prom/prometheus

# -v will Prometheus Mount the YML file
# Linux will e: \ docker \ Prometheus \ Prometheus \ Prometheus Replace YML with local Prometheus Path corresponding to YML / * * / * * / Prometheus yml
2. docker compose mode
docker-prometheus.yaml:
# Compose Version 2 supports more instructions. Version 1 will be deprecated in the future.
version: "3"

# Define service
services:

  # Define services for project
  prometheus:
    # The image name or image ID of the service. If the image does not exist locally, Compose will attempt to pull the image
    image: prom/prometheus
    # Configure port - "host port: container exposed port"
    ports:
      - 9090:9090
    # mount
    # Linux will e: \ docker \ Prometheus \ Prometheus \ Prometheus Replace YML with local Prometheus Path corresponding to YML / * * / * * / Prometheus yml
    volumes:
      - "E://Docker/prometheus/prometheus/prometheus.yml:/etc/prometheus/prometheus.yml"
    # Specify a custom container name instead of the generated default name.
    container_name: prometheus
# docker-prometheus.yaml corresponding path, or specify a good path, just like Linux
docker-compose -f docker-prometheus.yaml up -d
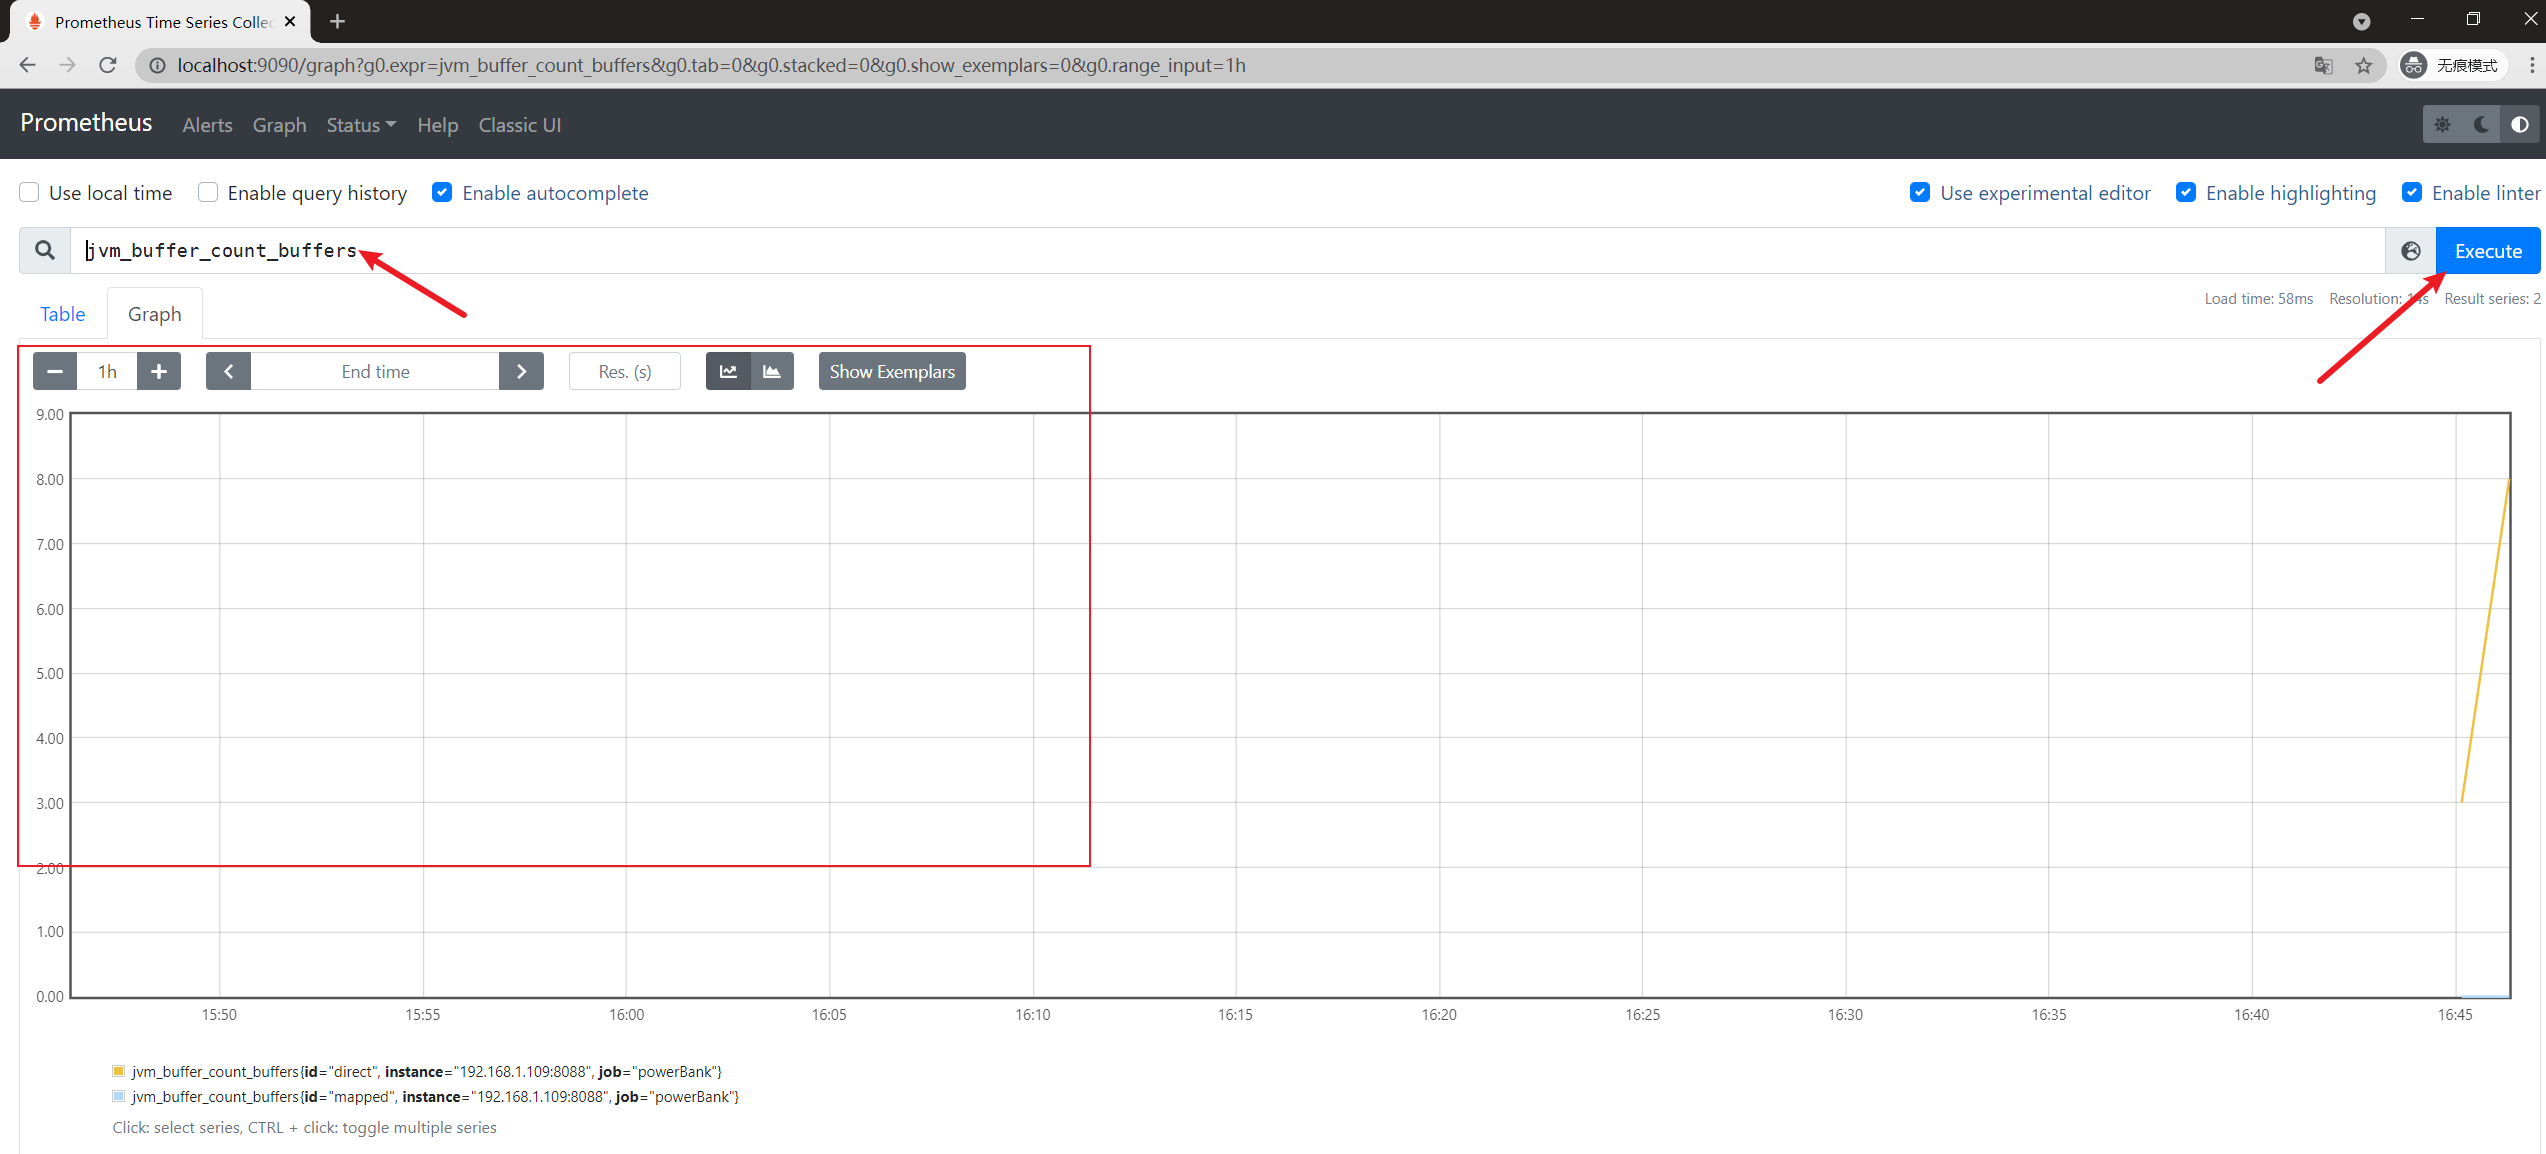
3. Inspection
1. View log
docker logs -f prometheus
2. Check whether data is obtained
browser: http://localhost:9090/
4. Deploy Grafana
1. Create a folder
It is used to save data. For example, we delete the container and then run it. As long as we mount the folder into it, we can restore it
The official website also has detailed instructions: https://grafana.com/docs/grafana/v7.5/installation/docker/
E:\Docker\grafana\grafana
# Linux
/docker/grafana
2. Operation
1. docker run mode
docker run --name grafana -p 3000:3000 -v E:\Docker\grafana\grafana:/var/lib/grafana  -d grafana/grafana

# -v mount the grafana folder
# Linux changes E:\Docker\grafana\grafana to the local corresponding path / * * / * * / grafana
2. docker compose mode
docker-grafana.yaml:
# Compose Version 2 supports more instructions. Version 1 will be deprecated in the future.
version: "3"

# Define service
services:

  # Define services for project
  grafana:
    # The image name or image ID of the service. If the image does not exist locally, Compose will attempt to pull the image
    image: grafana/grafana
    # Configure port - "host port: container exposed port"
    ports:
      - 3000:3000
    # mount
    # Linux changes E:\Docker\grafana\grafana to the local corresponding path / * * / * * / grafana
    volumes:
      - "E://Docker/grafana/grafana:/var/lib/grafana"
    # Specify a custom container name instead of the generated default name.
    container_name: grafana
# docker-grafana.yaml corresponding path, or specify a good path, just like Linux
docker-compose -f docker-grafana.yaml up -d
3. Inspection
1. View log
docker logs -f grafana
2. Check whether data is obtained
browser: http://localhost:3000/
Account password: admin
The first login will force the password to be changed
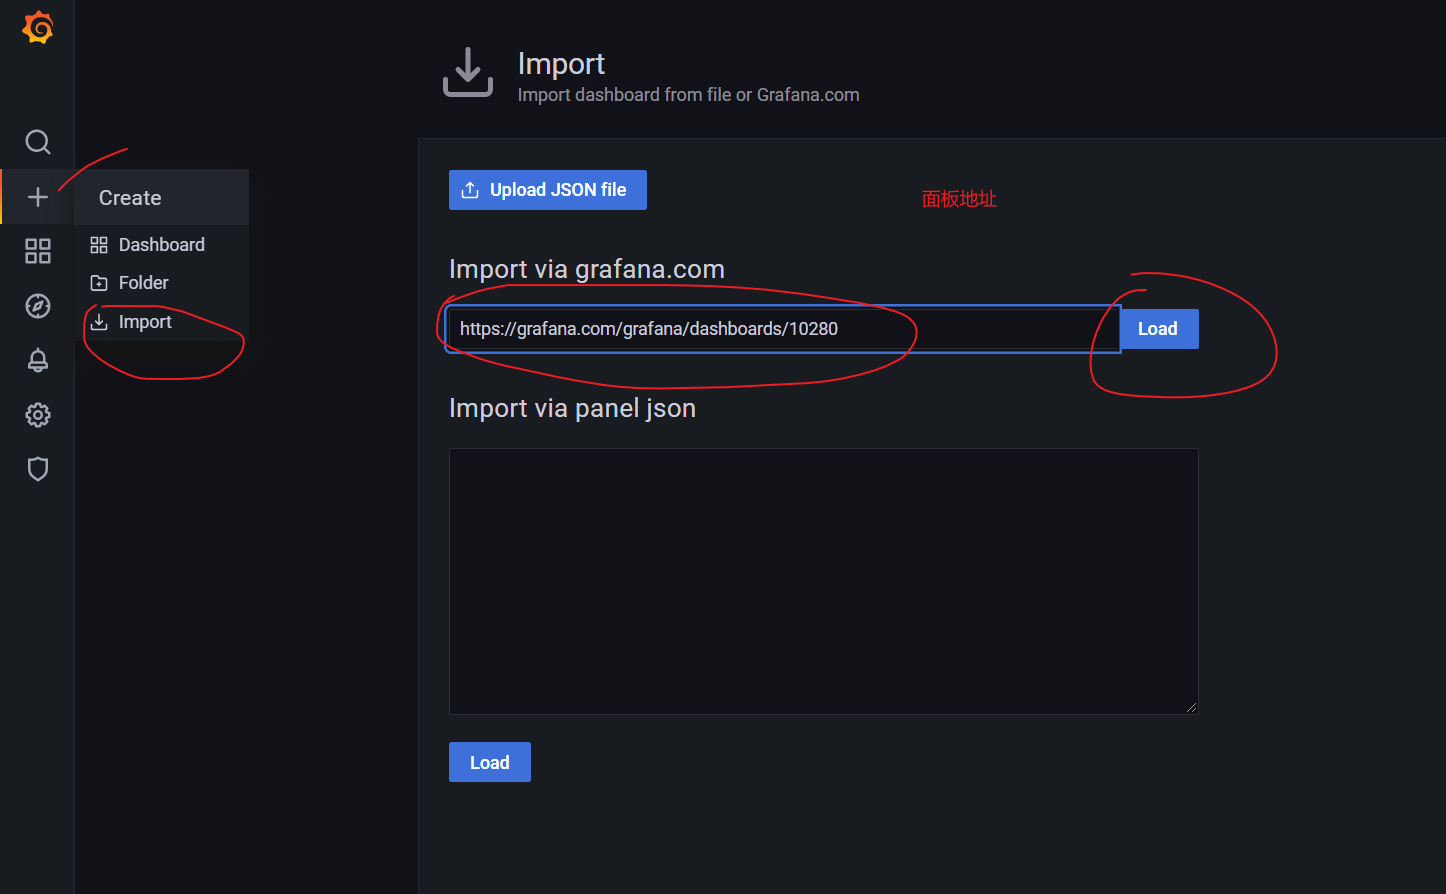
5. Monitoring panel selection
Panel selection: https://grafana.com/grafana/dashboards
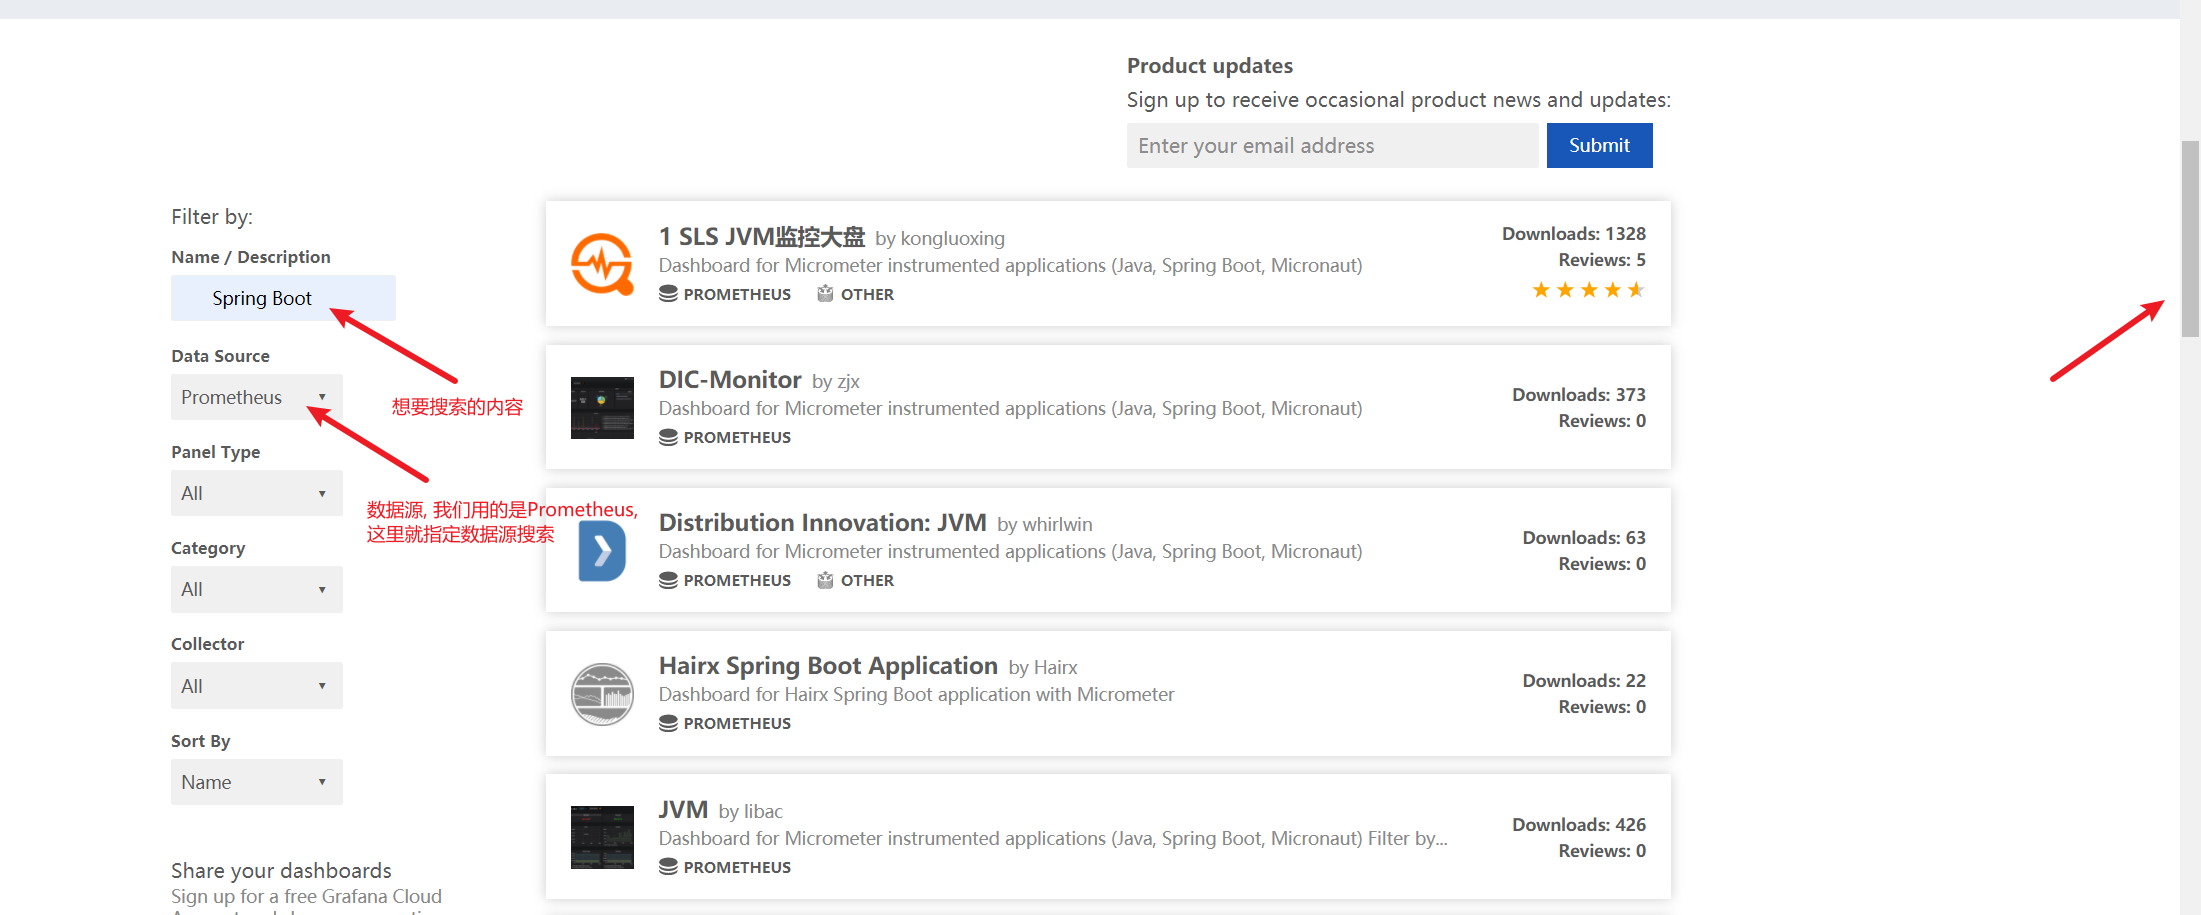
My final choice of three panels:
Spring Boot: 	https://grafana.com/grafana/dashboards/10280
JVM: 			https://grafana.com/grafana/dashboards/12856
Druid: 			https://grafana.com/grafana/dashboards/11157
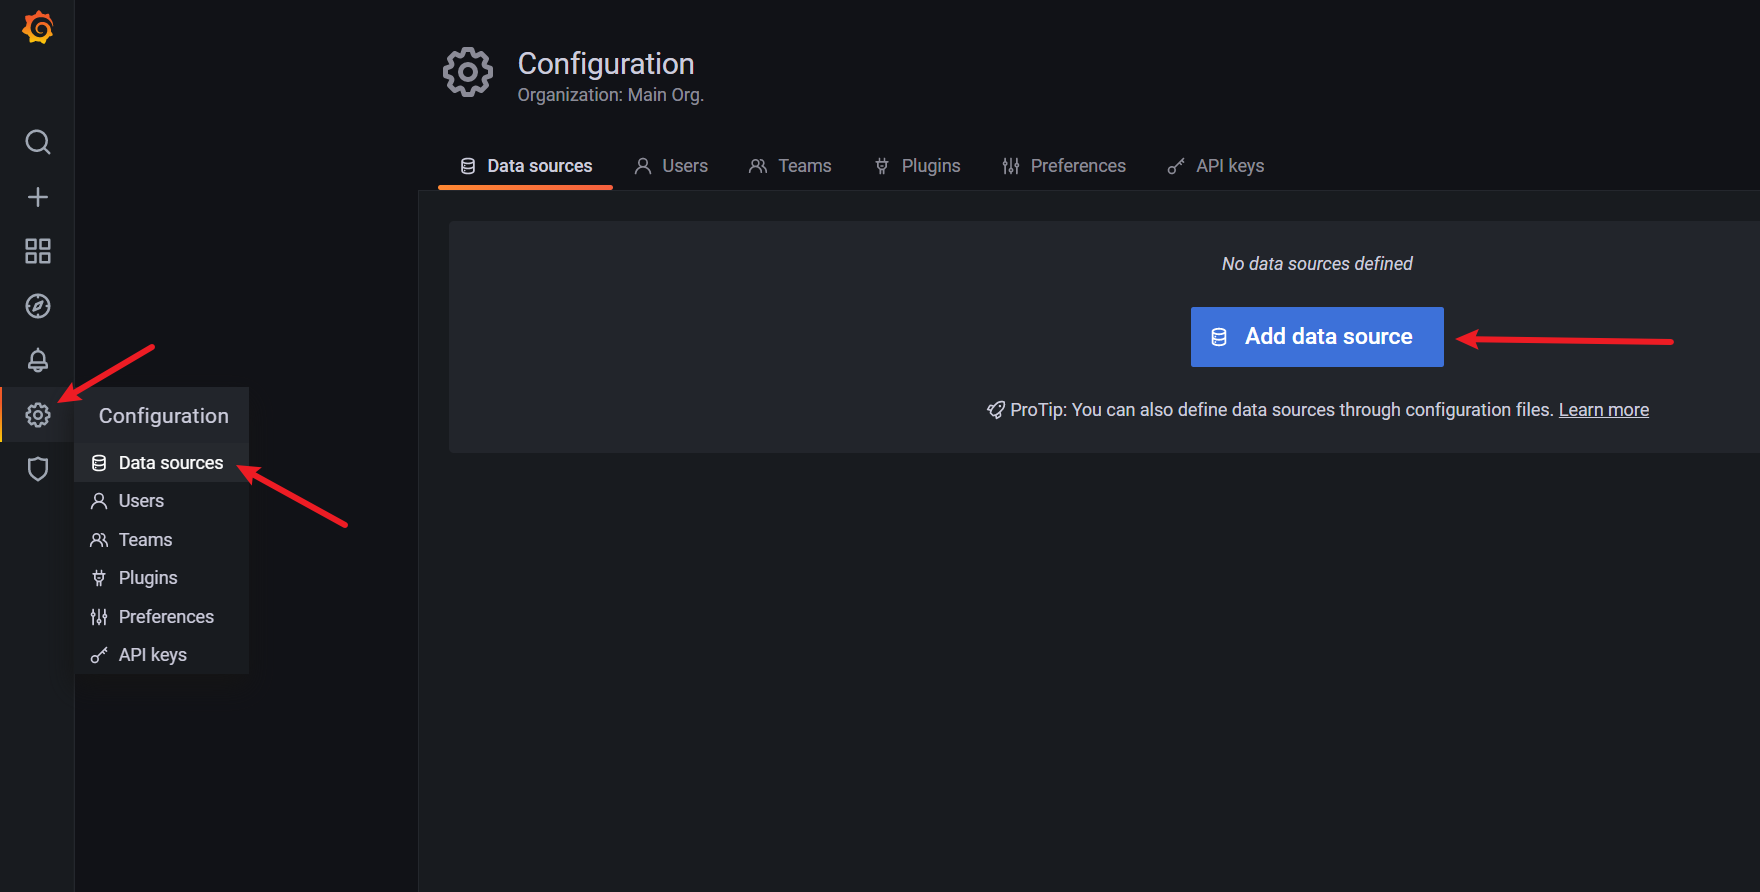
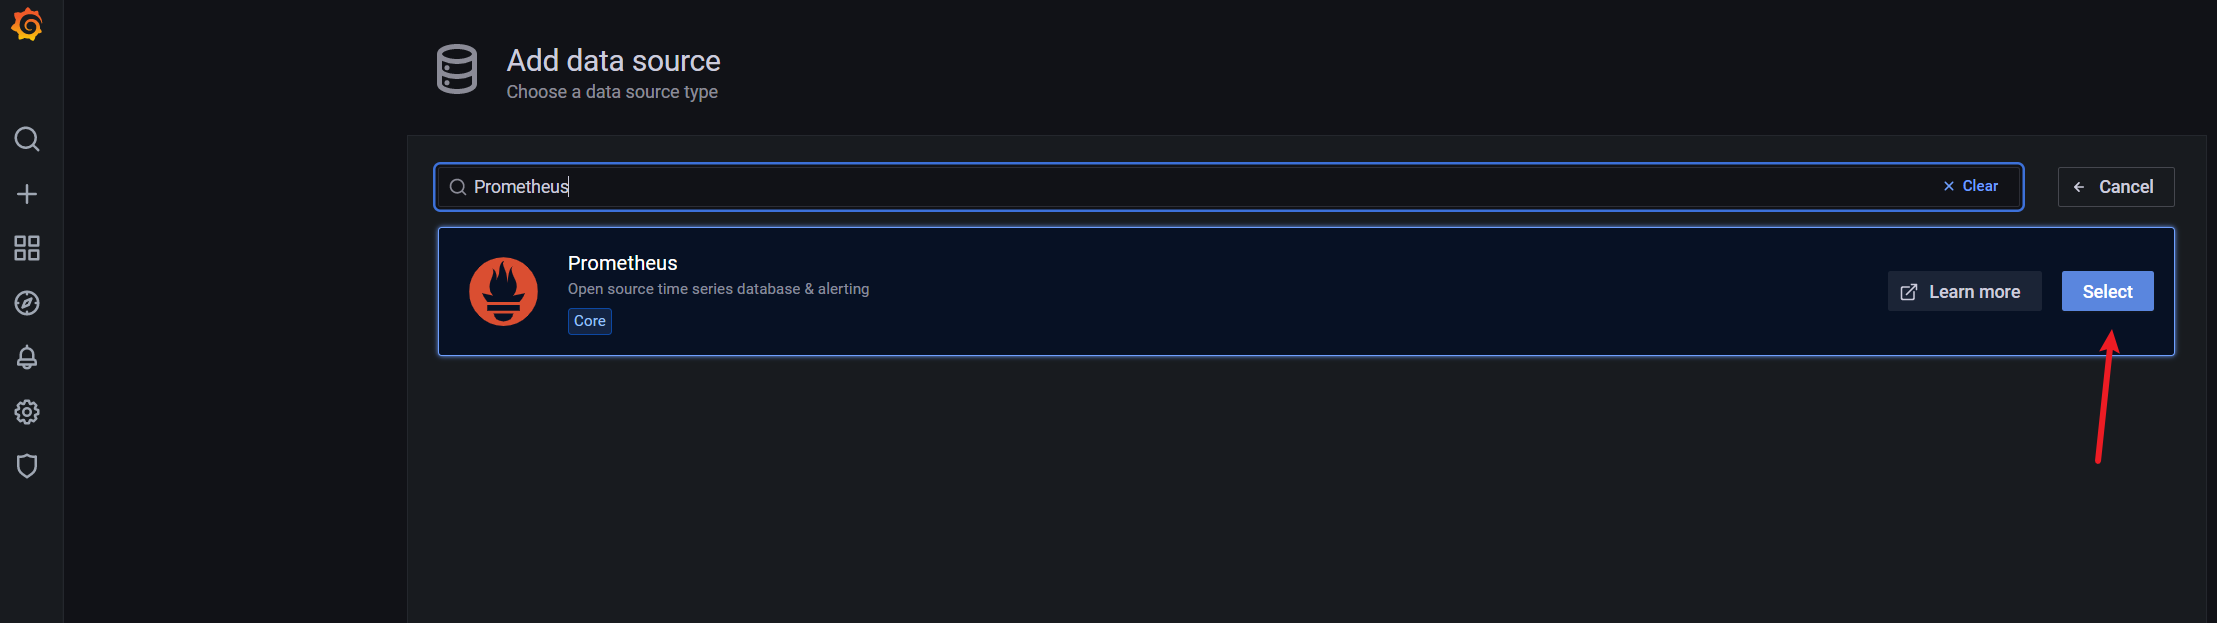
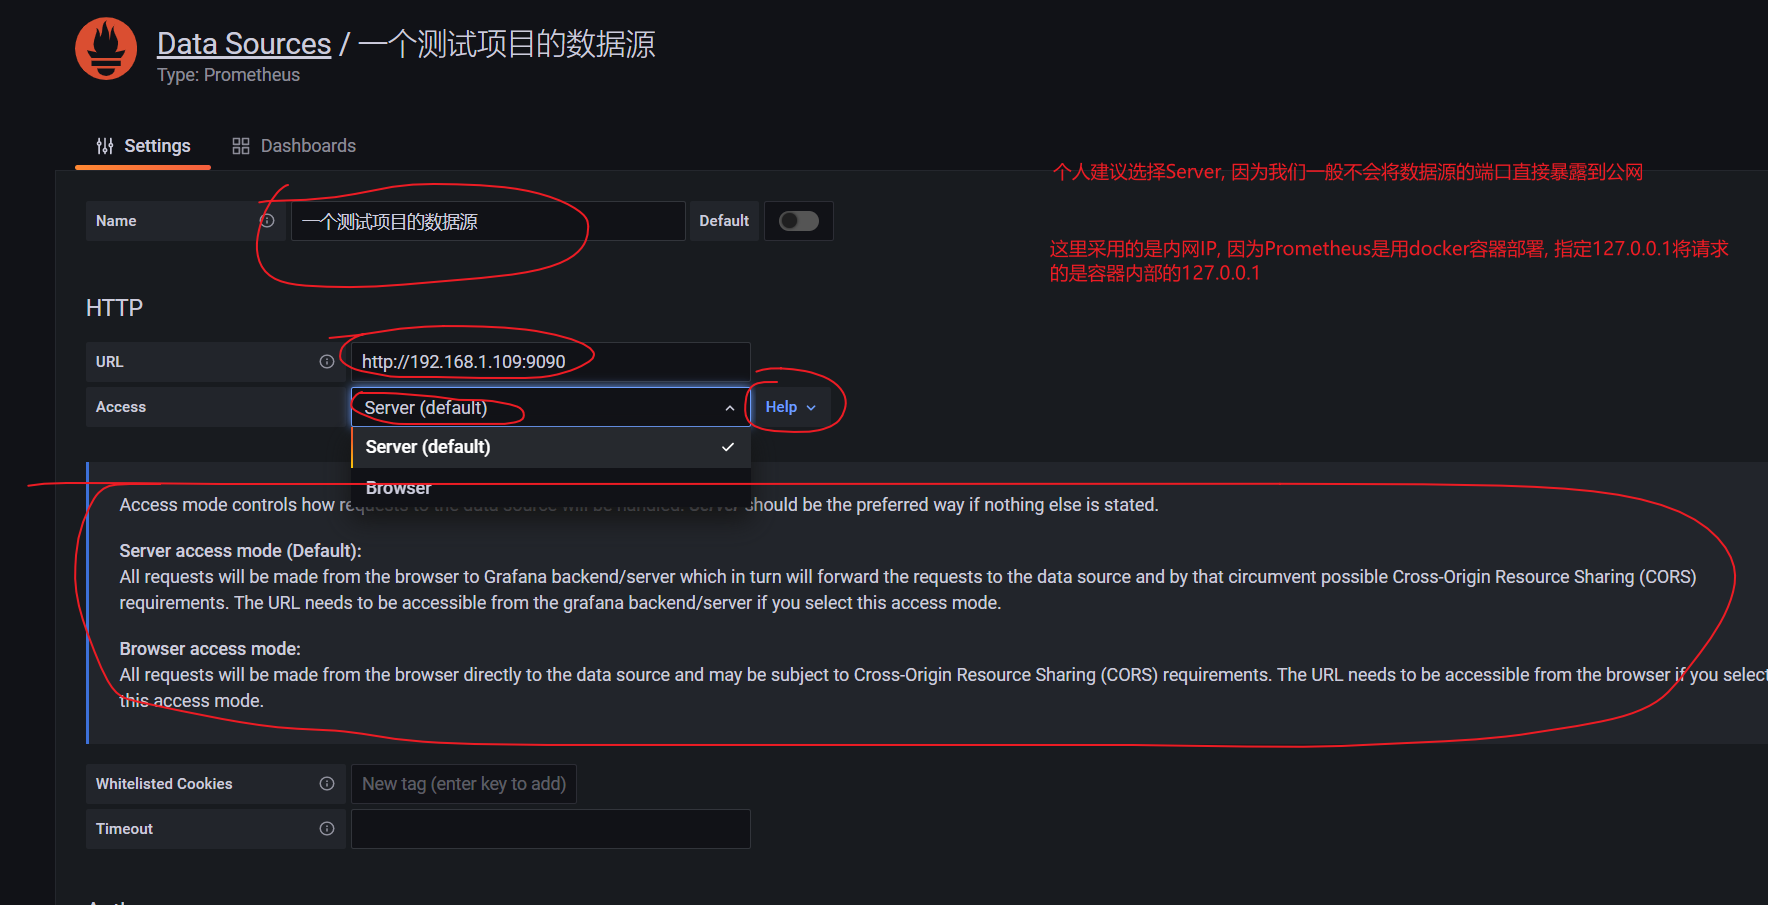
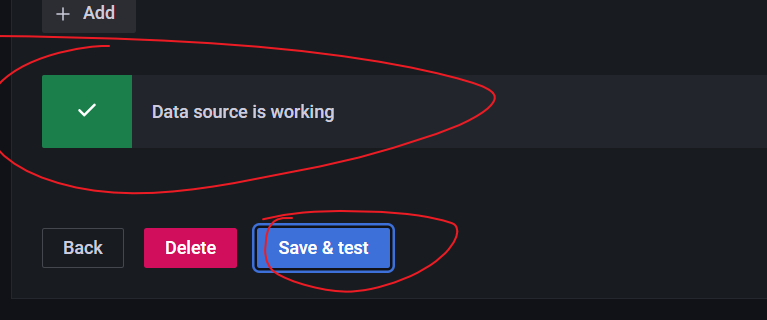
6. Configuring Grafana data sources
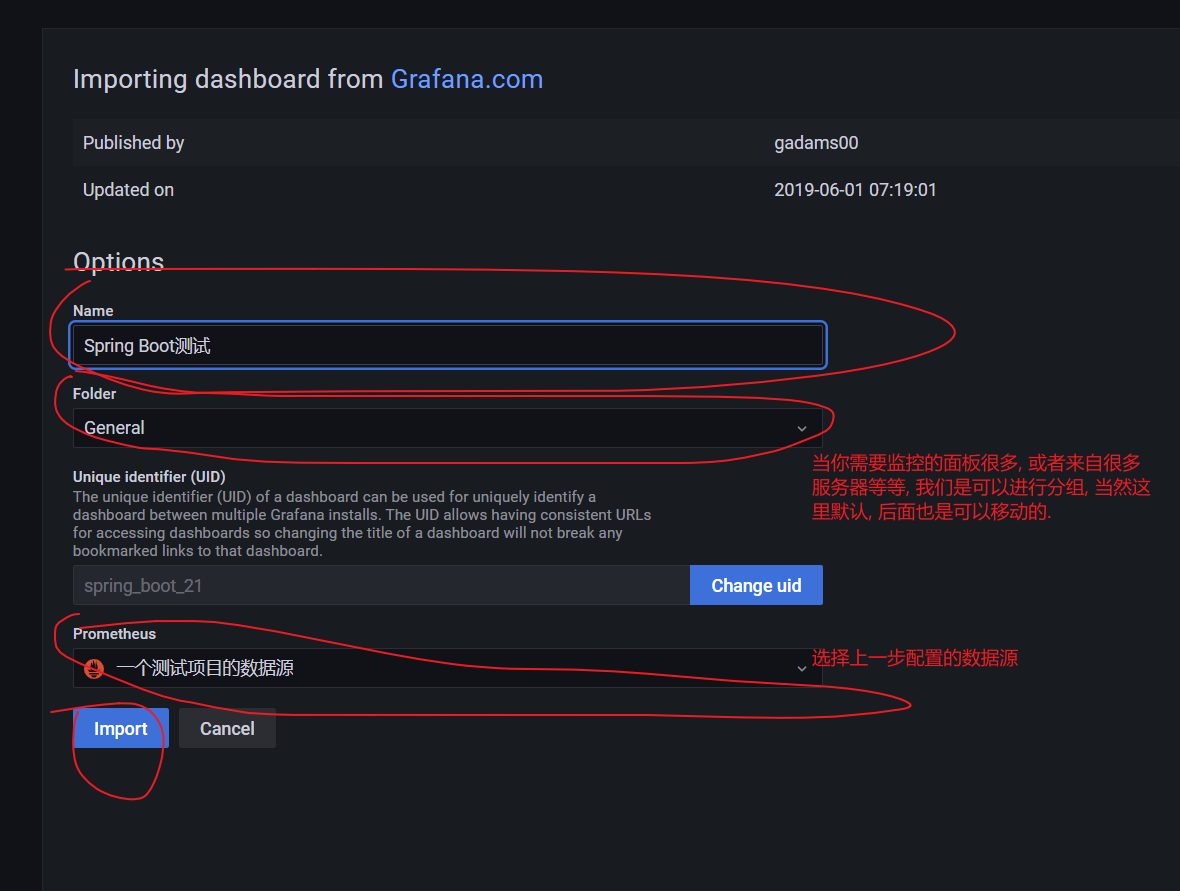
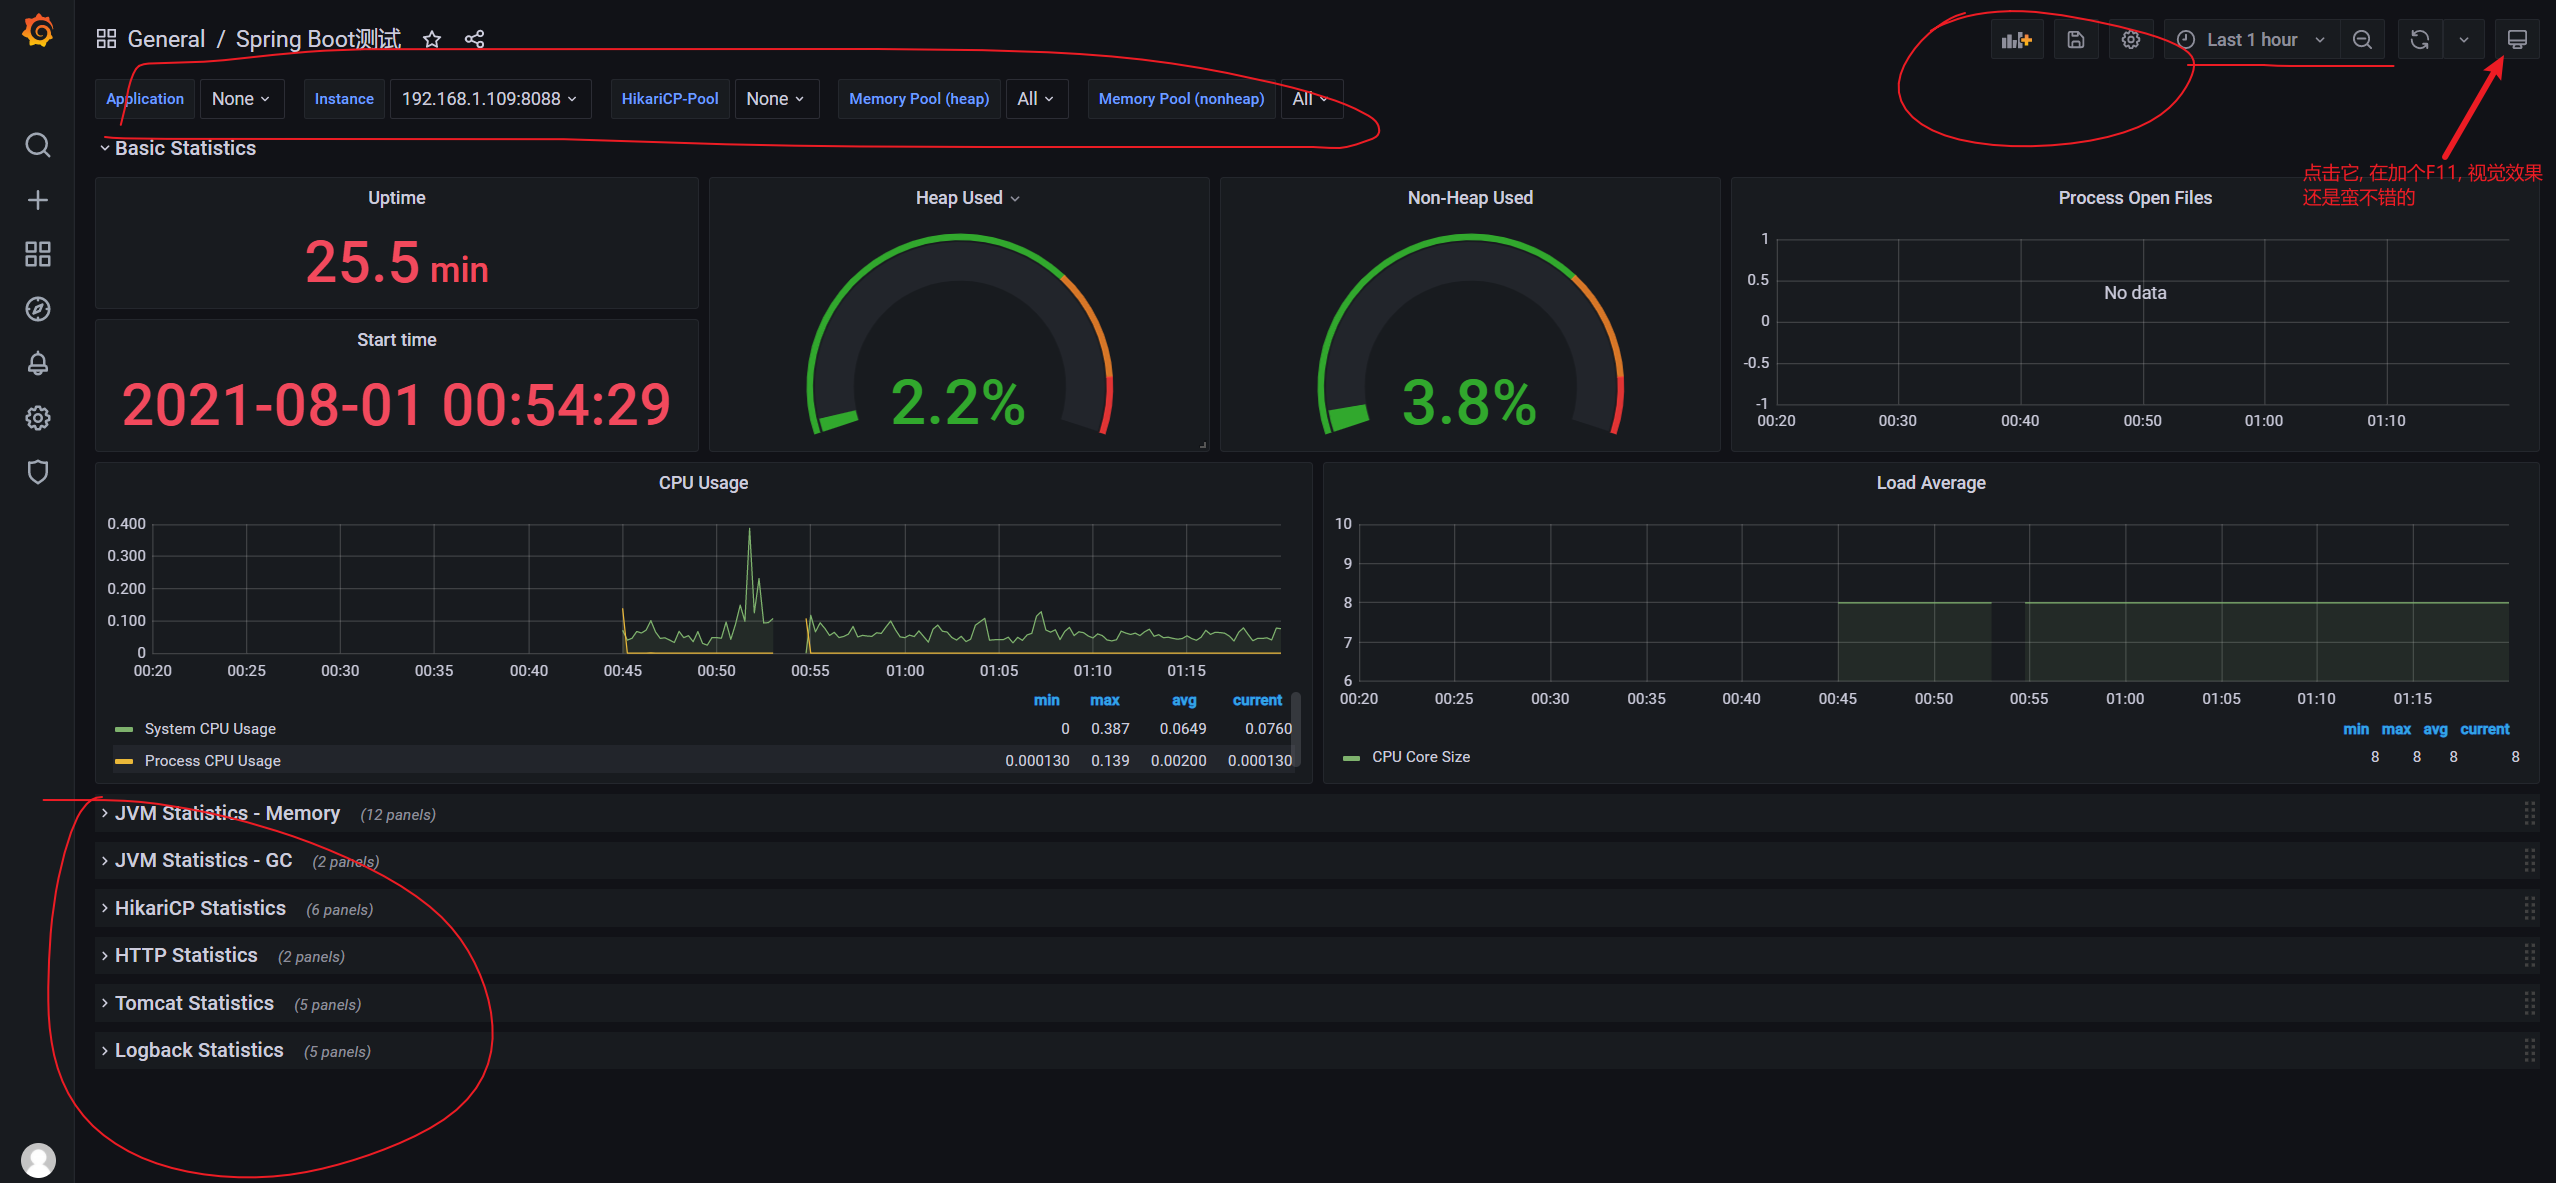
7. Configure Spring Boot panel
1. Disposition
2. Renderings
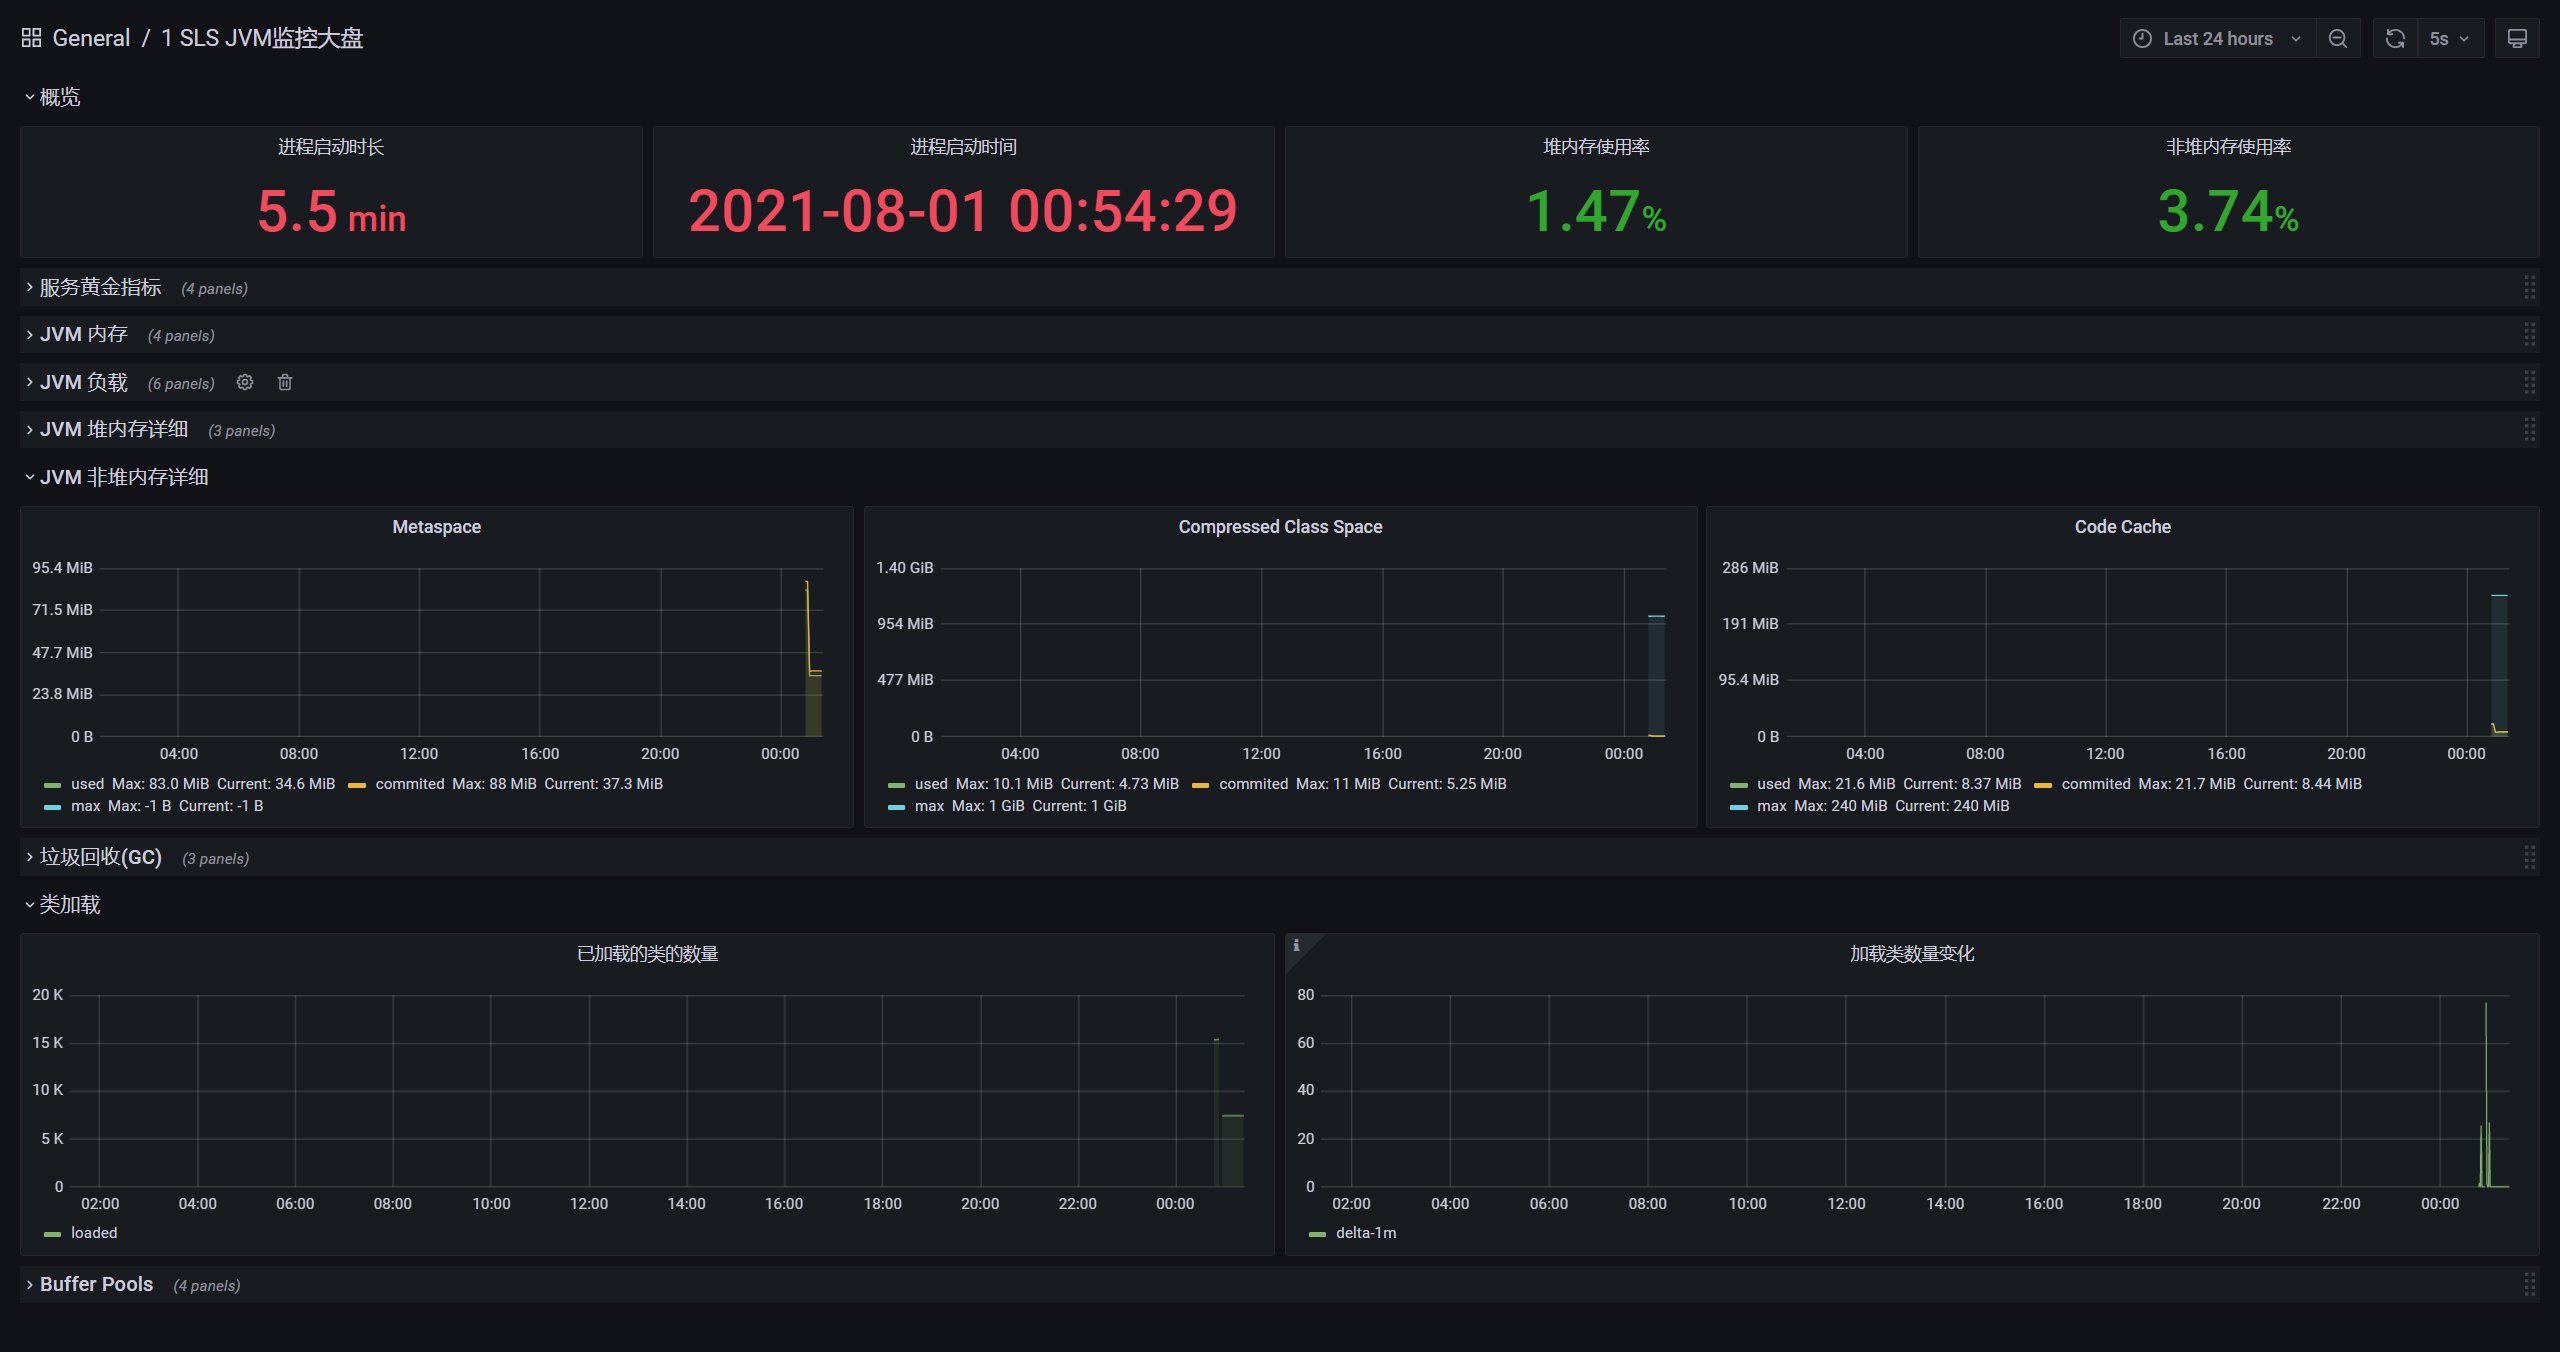
8. Configure JVM panel
Consistent with Spring Boot steps
1. Renderings
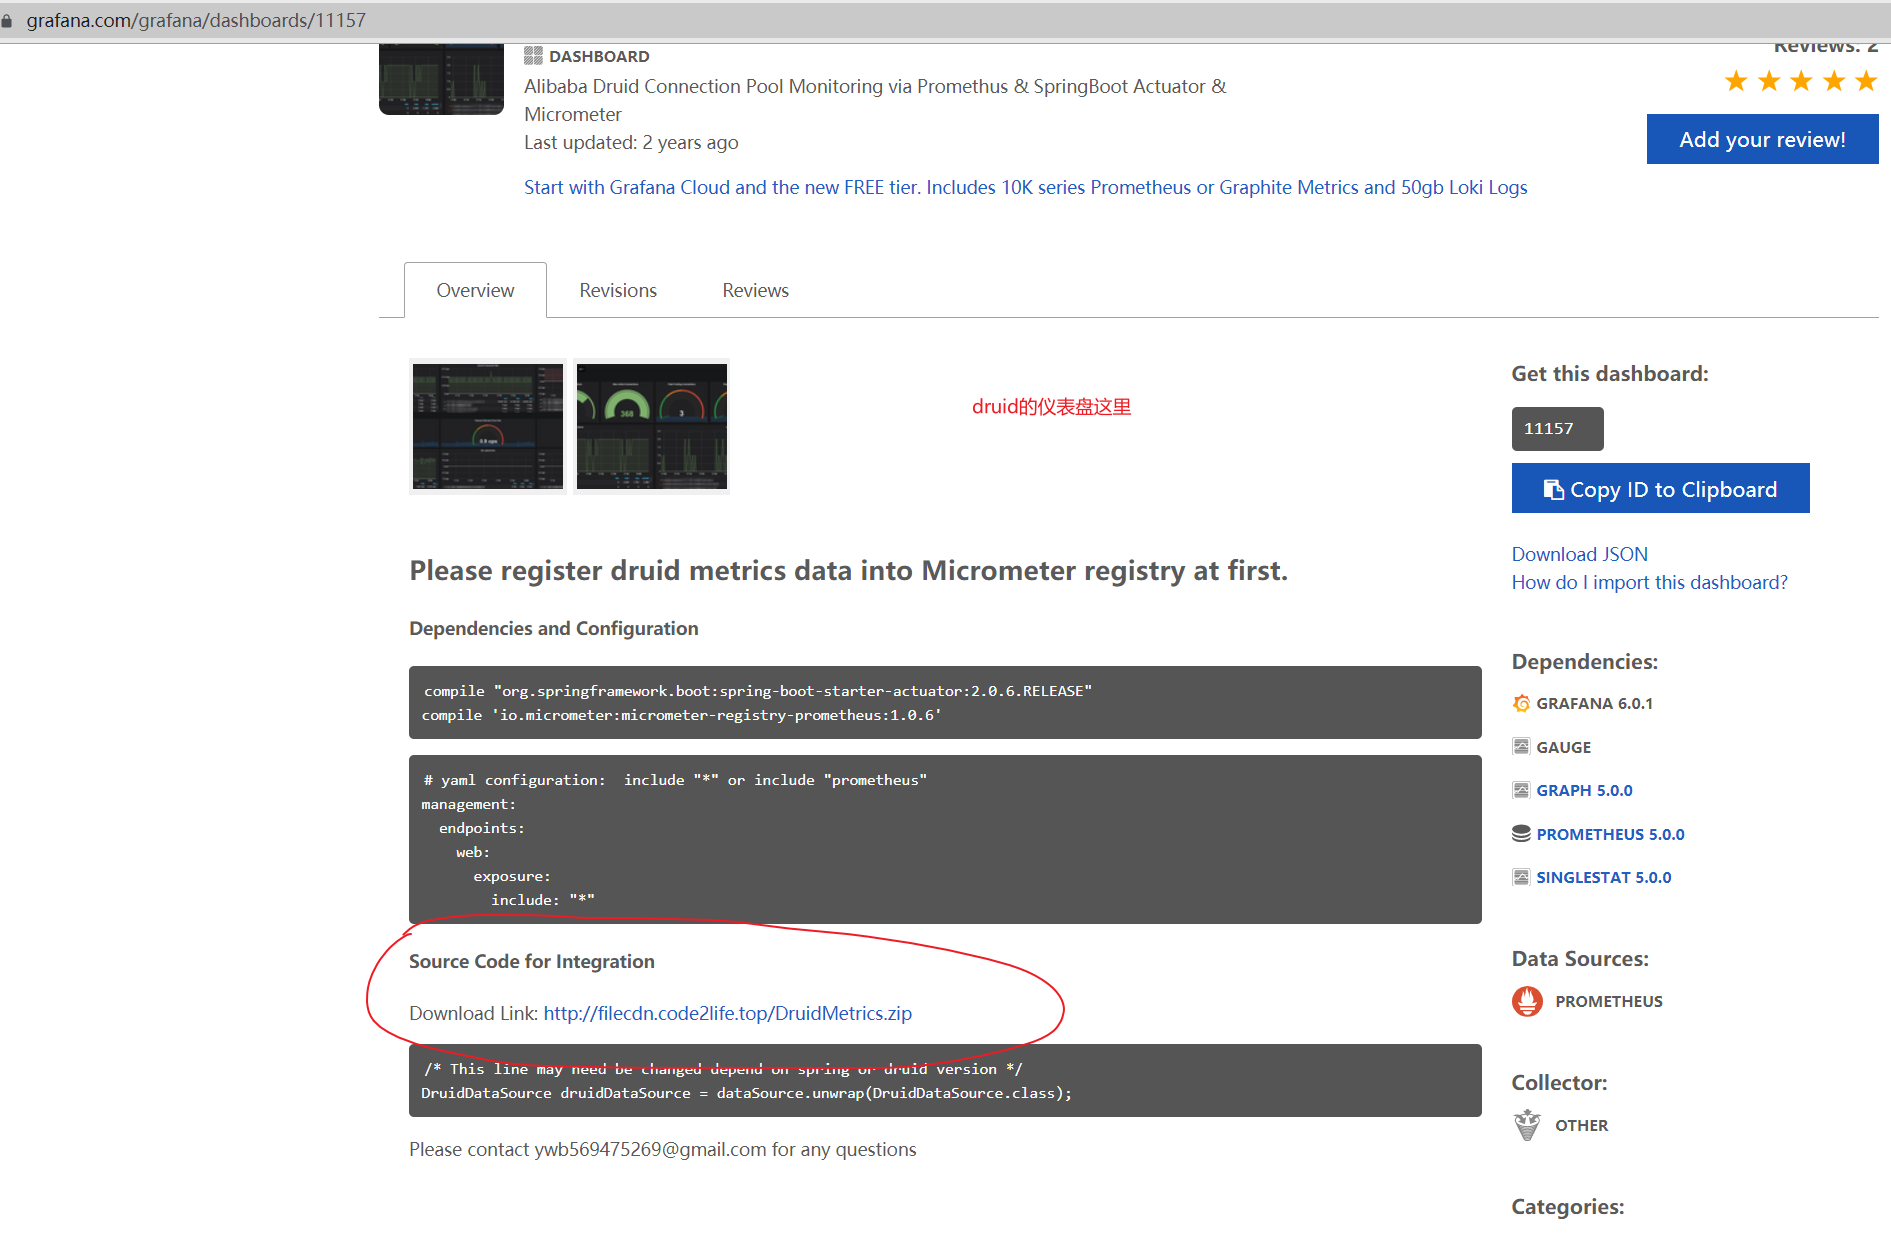
9. Configure Druid panel
1. Disposition
The steps are the same as those of Spring Boot, but it should be noted that it needs to integrate the source code. The code is introduced in the druid panel, address: http://filecdn.code2life.top/DruidMetrics.zip
package ---

import com.alibaba.druid.pool.DruidDataSource;
import io.micrometer.core.instrument.Gauge;
import io.micrometer.core.instrument.MeterRegistry;

import java.util.List;
import java.util.function.ToDoubleFunction;

class DruidCollector {

    private static final String LABEL_NAME = "pool";

    private final List<DruidDataSource> dataSources;

    private final MeterRegistry registry;

    DruidCollector(List<DruidDataSource> dataSources, MeterRegistry registry) {
        this.registry = registry;
        this.dataSources = dataSources;
    }

    void register() {
        this.dataSources.forEach((druidDataSource) -> {
            // basic configurations
            createGauge(druidDataSource, "druid_initial_size", "Initial size", (datasource) -> (double) druidDataSource.getInitialSize());
            createGauge(druidDataSource, "druid_min_idle", "Min idle", datasource -> (double) druidDataSource.getMinIdle());
            createGauge(druidDataSource, "druid_max_active", "Max active", datasource -> (double) druidDataSource.getMaxActive());

            // connection pool core metrics
            createGauge(druidDataSource, "druid_active_count", "Active count", datasource -> (double) druidDataSource.getActiveCount());
            createGauge(druidDataSource, "druid_active_peak", "Active peak", datasource -> (double) druidDataSource.getActivePeak());
            createGauge(druidDataSource, "druid_pooling_peak", "Pooling peak", datasource -> (double) druidDataSource.getPoolingPeak());
            createGauge(druidDataSource, "druid_pooling_count", "Pooling count", datasource -> (double) druidDataSource.getPoolingCount());
            createGauge(druidDataSource, "druid_wait_thread_count", "Wait thread count", datasource -> (double) druidDataSource.getWaitThreadCount());

            // connection pool detail metrics
            createGauge(druidDataSource, "druid_not_empty_wait_count", "Not empty wait count", datasource -> (double) druidDataSource.getNotEmptyWaitCount());
            createGauge(druidDataSource, "druid_not_empty_wait_millis", "Not empty wait millis", datasource -> (double) druidDataSource.getNotEmptyWaitMillis());
            createGauge(druidDataSource, "druid_not_empty_thread_count", "Not empty thread count", datasource -> (double) druidDataSource.getNotEmptyWaitThreadCount());

            createGauge(druidDataSource, "druid_logic_connect_count", "Logic connect count", datasource -> (double) druidDataSource.getConnectCount());
            createGauge(druidDataSource, "druid_logic_close_count", "Logic close count", datasource -> (double) druidDataSource.getCloseCount());
            createGauge(druidDataSource, "druid_logic_connect_error_count", "Logic connect error count", datasource -> (double) druidDataSource.getConnectErrorCount());
            createGauge(druidDataSource, "druid_physical_connect_count", "Physical connect count", datasource -> (double) druidDataSource.getCreateCount());
            createGauge(druidDataSource, "druid_physical_close_count", "Physical close count", datasource -> (double) druidDataSource.getDestroyCount());
            createGauge(druidDataSource, "druid_physical_connect_error_count", "Physical connect error count", datasource -> (double) druidDataSource.getCreateErrorCount());

            // sql execution core metrics
            createGauge(druidDataSource, "druid_error_count", "Error count", datasource -> (double) druidDataSource.getErrorCount());
            createGauge(druidDataSource, "druid_execute_count", "Execute count", datasource -> (double) druidDataSource.getExecuteCount());
            // transaction metrics
            createGauge(druidDataSource, "druid_start_transaction_count", "Start transaction count", datasource -> (double) druidDataSource.getStartTransactionCount());
            createGauge(druidDataSource, "druid_commit_count", "Commit count", datasource -> (double) druidDataSource.getCommitCount());
            createGauge(druidDataSource, "druid_rollback_count", "Rollback count", datasource -> (double) druidDataSource.getRollbackCount());

            // sql execution detail
            createGauge(druidDataSource, "druid_prepared_statement_open_count", "Prepared statement open count", datasource -> (double) druidDataSource.getPreparedStatementCount());
            createGauge(druidDataSource, "druid_prepared_statement_closed_count", "Prepared statement closed count", datasource -> (double) druidDataSource.getClosedPreparedStatementCount());
            createGauge(druidDataSource, "druid_ps_cache_access_count", "PS cache access count", datasource -> (double) druidDataSource.getCachedPreparedStatementAccessCount());
            createGauge(druidDataSource, "druid_ps_cache_hit_count", "PS cache hit count", datasource -> (double) druidDataSource.getCachedPreparedStatementHitCount());
            createGauge(druidDataSource, "druid_ps_cache_miss_count", "PS cache miss count", datasource -> (double) druidDataSource.getCachedPreparedStatementMissCount());
            createGauge(druidDataSource, "druid_execute_query_count", "Execute query count", datasource -> (double) druidDataSource.getExecuteQueryCount());
            createGauge(druidDataSource, "druid_execute_update_count", "Execute update count", datasource -> (double) druidDataSource.getExecuteUpdateCount());
            createGauge(druidDataSource, "druid_execute_batch_count", "Execute batch count", datasource -> (double) druidDataSource.getExecuteBatchCount());

            // none core metrics, some are static configurations
            createGauge(druidDataSource, "druid_max_wait", "Max wait", datasource -> (double) druidDataSource.getMaxWait());
            createGauge(druidDataSource, "druid_max_wait_thread_count", "Max wait thread count", datasource -> (double) druidDataSource.getMaxWaitThreadCount());
            createGauge(druidDataSource, "druid_login_timeout", "Login timeout", datasource -> (double) druidDataSource.getLoginTimeout());
            createGauge(druidDataSource, "druid_query_timeout", "Query timeout", datasource -> (double) druidDataSource.getQueryTimeout());
            createGauge(druidDataSource, "druid_transaction_query_timeout", "Transaction query timeout", datasource -> (double) druidDataSource.getTransactionQueryTimeout());
        });
    }

    private void createGauge(DruidDataSource weakRef, String metric, String help, ToDoubleFunction<DruidDataSource> measure) {
        Gauge.builder(metric, weakRef, measure)
                .description(help)
                .tag(LABEL_NAME, weakRef.getName())
                .register(this.registry);
    }
}
package ---

import com.alibaba.druid.pool.DruidDataSource;
import io.micrometer.core.instrument.MeterRegistry;
import lombok.extern.slf4j.Slf4j;
import org.springframework.beans.factory.annotation.Autowired;
import org.springframework.boot.autoconfigure.condition.ConditionalOnClass;
import org.springframework.context.annotation.Configuration;

import javax.sql.DataSource;
import java.sql.SQLException;
import java.util.ArrayList;
import java.util.Collection;
import java.util.List;

@Configuration
@ConditionalOnClass({DruidDataSource.class, MeterRegistry.class})
@Slf4j
public class DruidMetricsConfiguration {

    private final MeterRegistry registry;

    public DruidMetricsConfiguration(MeterRegistry registry) {
        this.registry = registry;
    }

    @Autowired
    public void bindMetricsRegistryToDruidDataSources(Collection<DataSource> dataSources) throws SQLException {
        List<DruidDataSource> druidDataSources = new ArrayList<>(dataSources.size());
        for (DataSource dataSource : dataSources) {
            DruidDataSource druidDataSource = dataSource.unwrap(DruidDataSource.class);
            if (druidDataSource != null) {
                druidDataSources.add(druidDataSource);
            }
        }
        DruidCollector druidCollector = new DruidCollector(druidDataSources, registry);
        druidCollector.register();
        log.info("finish register metrics to micrometer");
    }
}
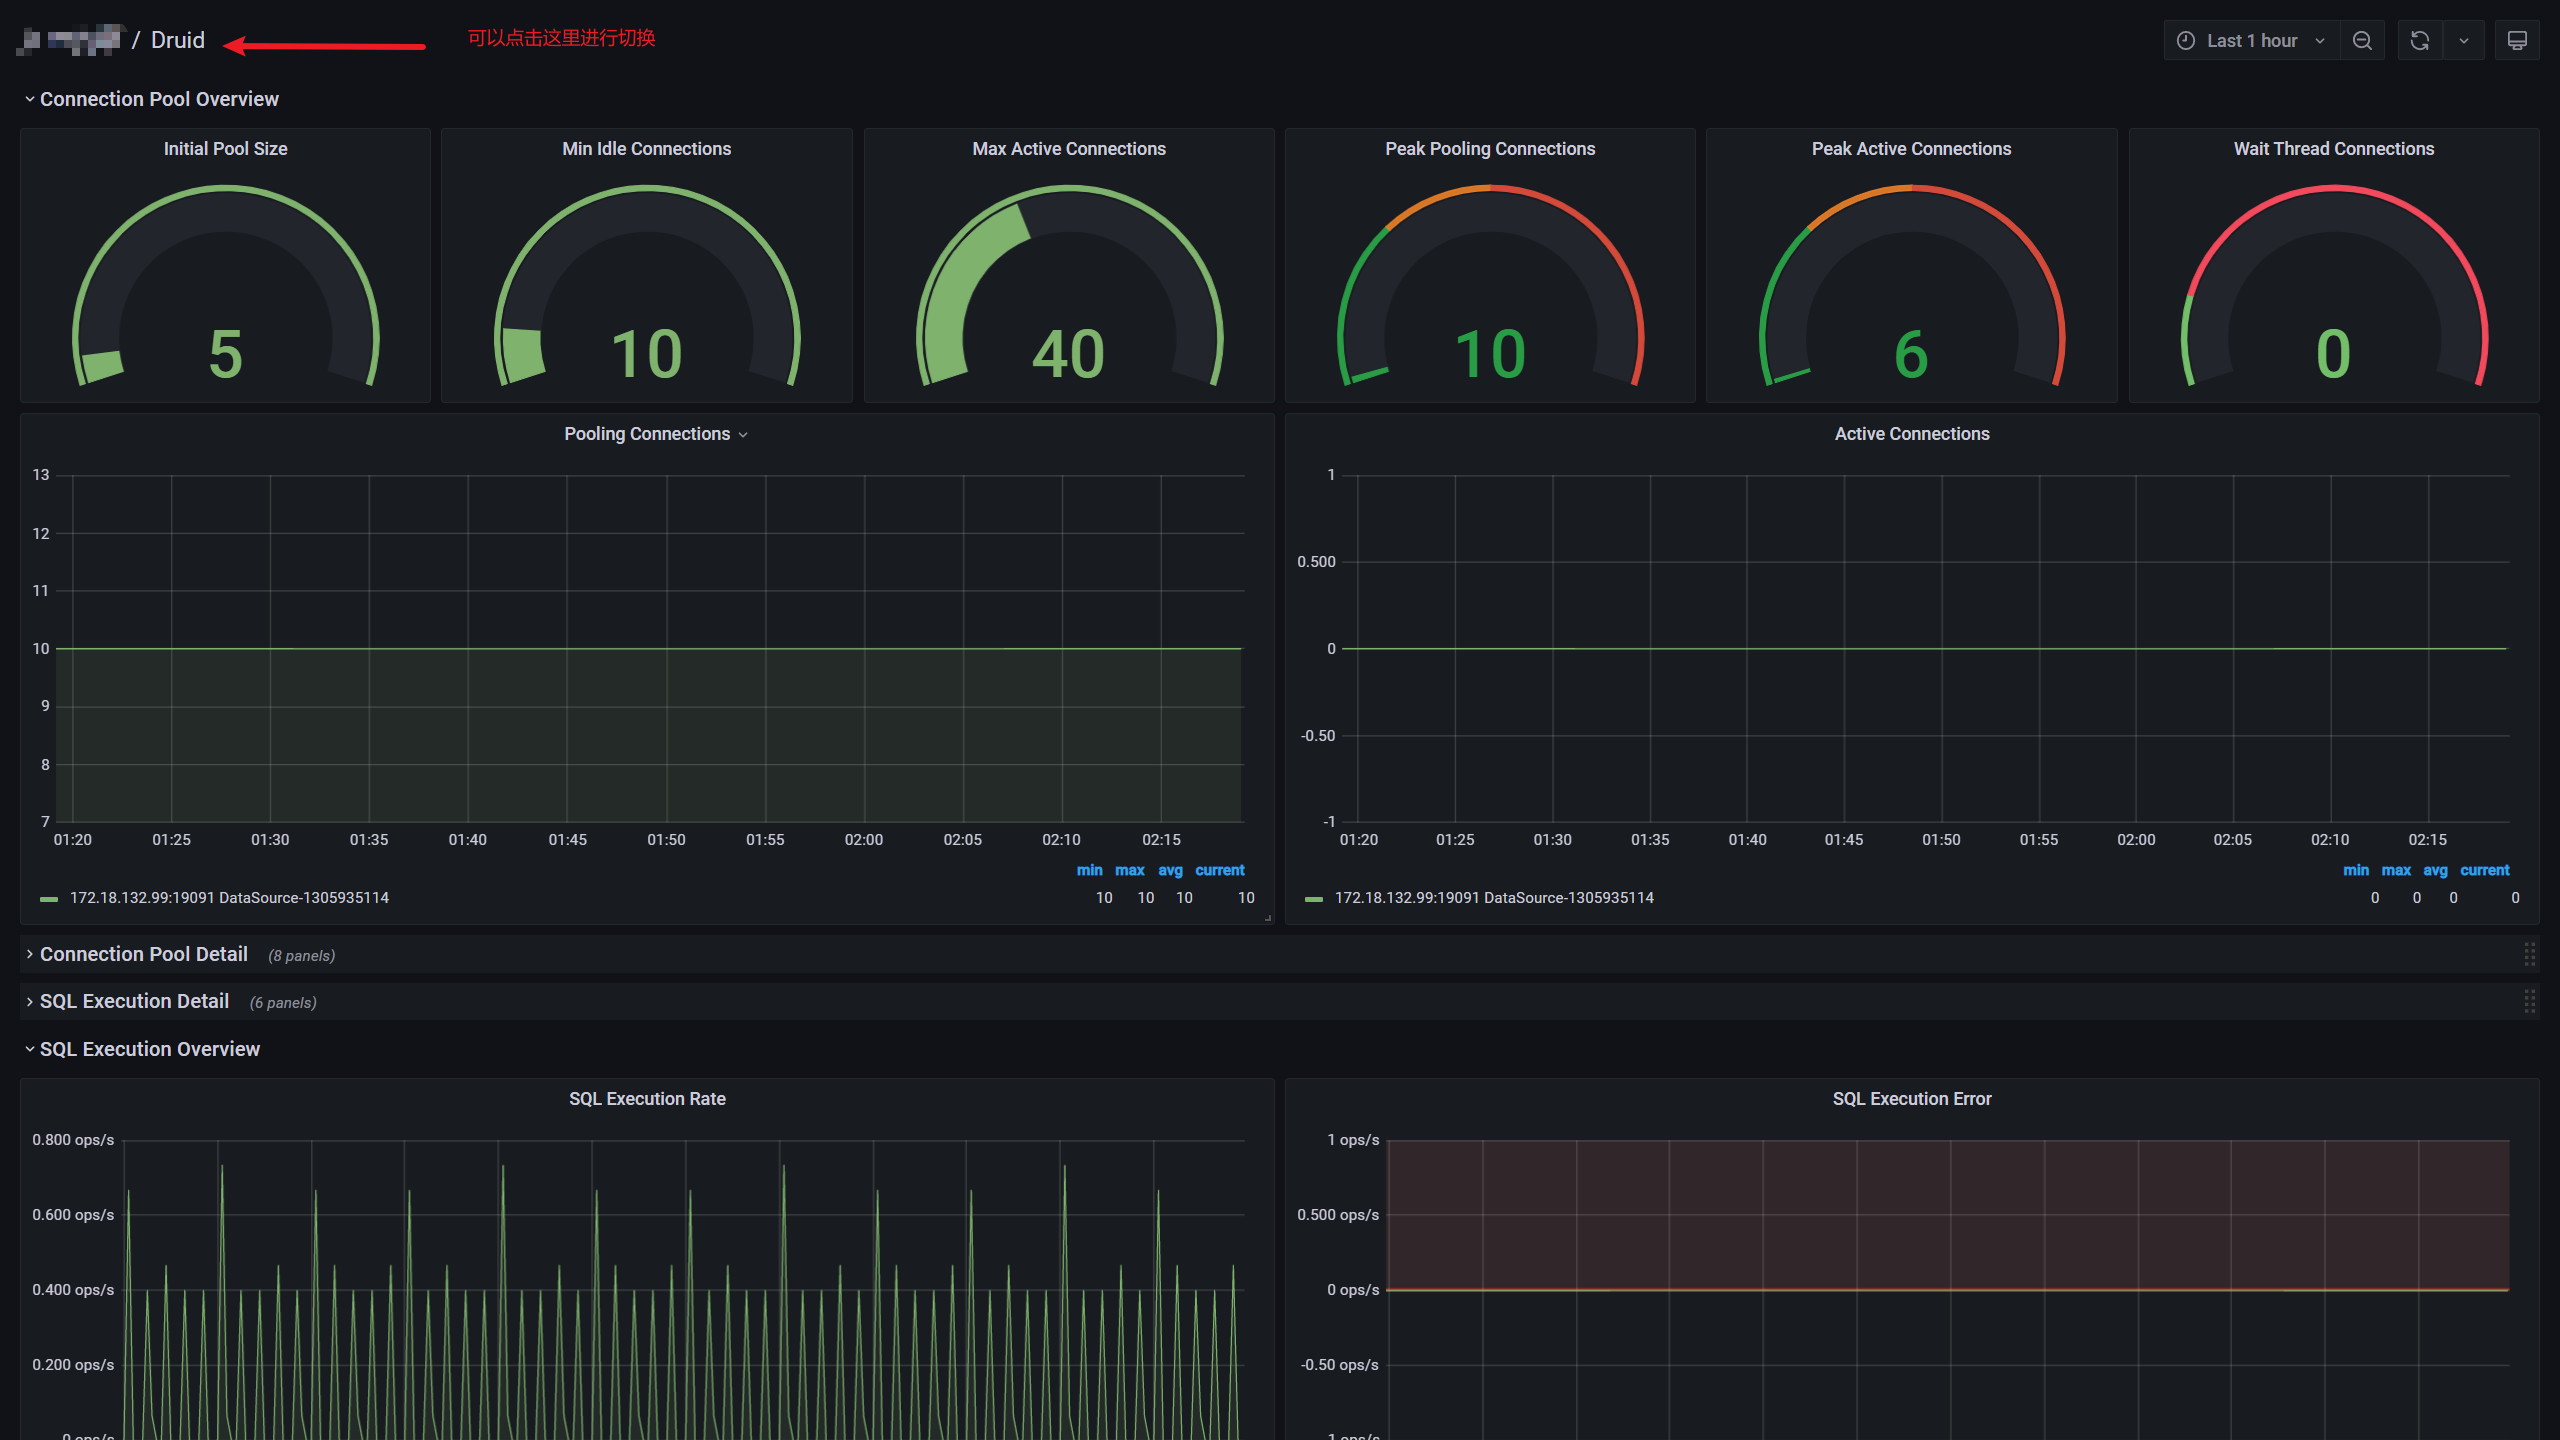
2. Renderings
10. Remarks
grafana official website: https://grafana.com/docs/grafana/latest/installation/docker/
prometheus official website: https://prometheus.io/docs/prometheus/latest/installation/
prometheus' GitHub: https://github.com/prometheus/prometheus
Panel selection of grafana: https://grafana.com/grafana/dashboards
Druid's panel: https://grafana.com/grafana/dashboards/11157
Spring Boot panel: https://grafana.com/grafana/dashboards/10280
JVM panel: https://grafana.com/grafana/dashboards/12856
Because (Prometheus + Grafana + project) is deployed in docker mode, the IP configured by me is based on Intranet IP. 127.0.0.1 only points to the address inside the container. When our network is not specially set
I deploy Grafana on one server (Project + Prometheus) and another server. The health monitoring port 8088 of the project is not exposed, and the port 9090 of Prometheus is only exposed to the server corresponding to Grafana Setting the port (or firewall) in the project can avoid many problems in the later stage, whether it is technology or pre-sales and after-sales
They are all panel based operations. Just play more. By the way, the monitoring panel interface has a great visual effect of + F11 in the upper right corner and can be switched in the upper left corner
The monitoring of docker and Redis will be added later in the column, based on Prometheus + Grafana