Personal understanding and source code analysis of MOT indicators:
Official website indicators:
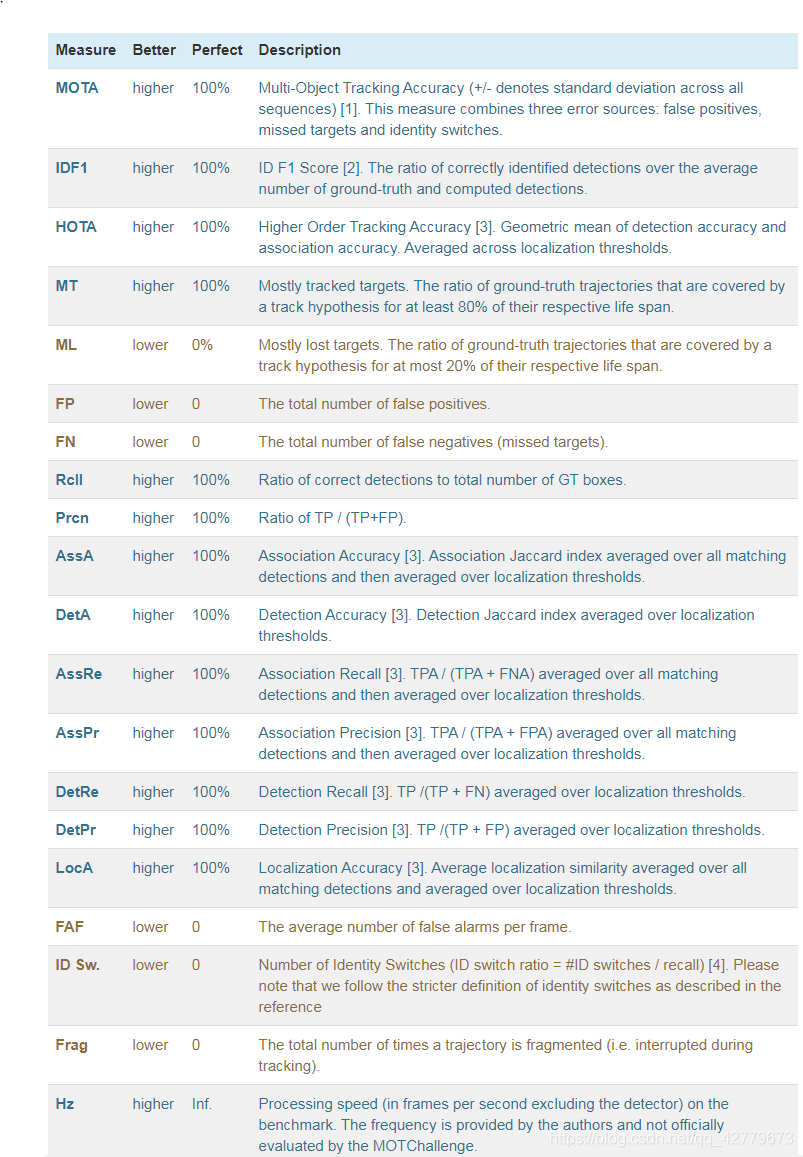
Indicators on the official website
There is also a good Chinese Blog: Blog
However, I still don't have a special understanding of some of the details, so I carefully read the paper and the source code of calculation and evaluation indicators officially given by MOT, and summarize and record it here.
preface
Detection object: the target detected by the detector in this frame
Tracking object: all current tracks (composed of successfully matched detection targets in each previous frame)
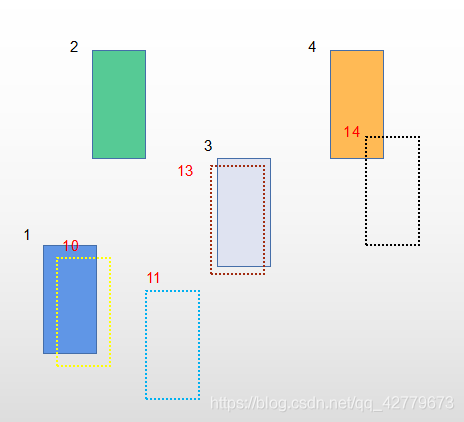
As shown in Figure 2, the tracking result and ground truth in a frame are shown. Here, the dotted line is our tracking result, and the solid line is filled with ground truth. Because it is a MOT data set, the results are all with id number, the black is the id number in ground truth, and the red is the id number of tracking result.
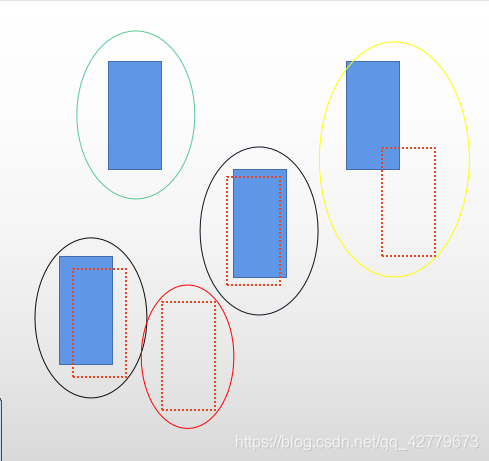
First of all, it should be clear that MOTA statistics is the final output result, that is, when doing multi-target tracking, we must associate the data between the detection object and the tracking object in each frame to obtain the final detection and tracking object. Therefore, TP, FP and FN here are the final results of the correlation success. In the tracking results we output, there are numbered bbox in each frame, as shown in Figure 2. When calculating the indicators FP, TP and FN, we think that the numbered bbox and the numbered ground truth in each frame are calculated. At the same time, the operation involved here must be the detection and tracking object with successful data association in each frame!!! Figure 3 shows the result of removing the serial number. The dotted line is the detection tracking object in the output tracking result, and the solid line is filled with ground truth.
MOTA:
First, let's talk about TP, FP, FN and TN in the confusion matrix. I personally remember that it is divided into two parts: the first part is T/F, the second part is P/N, the second part indicates whether we predict P or N, and the first part indicates whether we predict right or wrong according to the prediction of the first part. Just like here, we think this result is a goal. In fact, there is a ground truth here, which is a TP
-
TP: the IOU of a detection tracking object and a ground truth with successful data association is greater than α, That is, our algorithm thinks that this target is what we want to track, and it is exactly consistent with the growth truth. As shown in Figure 3, the two targets are circled by black circles
-
FP: the IOU of a detection tracking object with successful data association and any ground truth is less than α, That is, our algorithm thinks that this target is what we want to track, but there is no ground truth here. The red circle in Figure 3 encloses the target
-
FN: IOU of a ground truth successfully associated with any data is less than α, That is, our algorithm doesn't think there is a target we want to track, but in fact there is a target. That is, the target circled by the green circle in Figure 3.
-
IDSW:
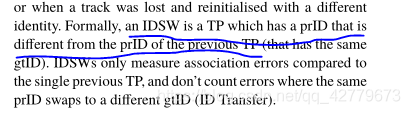
First of all, IDSW only targets TP, that is, it is tracked that there are targets here, and in fact there are. In short: the number of times a gtID changes in the final result.
Figure 4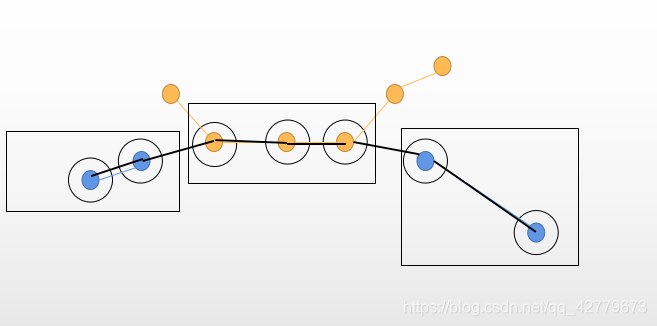
Here, figure 4 is used to explain. A diagram is drawn based on Figure 1. For a better explanation, the black unfilled circle represents the gt track of an id, the blue filled circle and yellow filled circle represent the results of two different IDS in the output result, and the black rectangular frame is TP, because the output result matches gt. In this figure, IDSW is 2, which changes from blue id to yellow id, and then back to blue id. as mentioned above, the prID value of a TP is different from that of the previous TP, that is, it is an IDSW, so I understand it should be 2 here.
Problem: the IDSW is large, so the tracking effect may not be good. For example
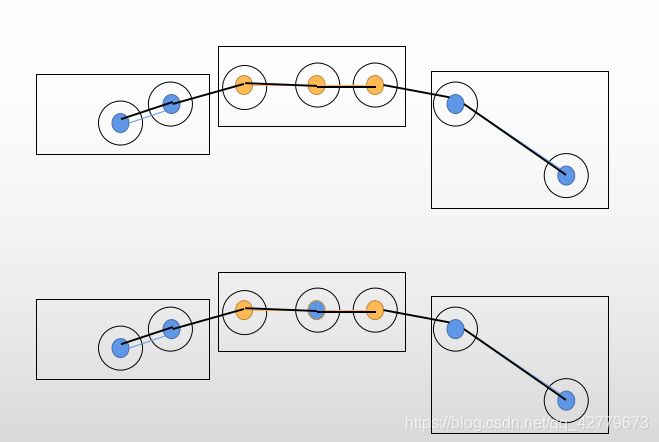
As reflected in the above figure, the TP, FP and FN of the upper and lower groups are the same, but the IDSW below is 4 and the IDSW above is 3. Instead, the MOTA calculation result is better above. I think the following is obviously better. -
TPs, FPs and FNs are just the sum of all the results.
IDF1
IDF1 considers the problem of track level. Formula in paper 3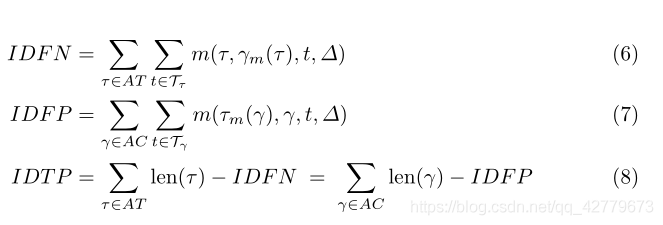
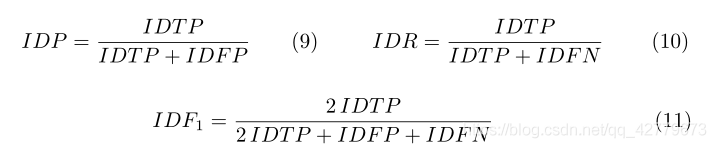
And explanation. I don't feel that the understanding is particularly thorough. Here, I analyze the specific steps in combination with the evaluation code provided by MOTchallenge's official website. First, summarize my personal understanding after reading the code: first, we need to calculate the similarity between the output result and gt in each frame through IOU (calculated with IOU, the same as that in MODA), and then it will be greater than the threshold α It is considered to be the detection and tracking object on the association. Find the association relationship between tracker and gt in the final result, calculate the number of failed objects, and calculate the following indicators.
- IDTP
- IDFP
- IDFN
Specific code analysis:
Some values in data
data ['num_tracker_dets']: detection results in tracking results
Data ['num_gt_dets']: no GT with test results in the label data
data ['num_tracker_id s']: the number of IDS in the tracking result
data ['num_gt_id s']: number of IDS in GT
data ['gt_id s']: stores all IDS in each frame
data ['tracker_id s']: stores all IDS in each frame of the tracking result
data ['similarity_scores']: the similarity calculation result of tracker and gt in each frame. Each object in the list is the similarity calculation result of one frame - a two-dimensional matrix
def eval_sequence(self, data):
"""Calculates ID metrics for one sequence"""
# Initialise results
res = {}
for field in self.fields:#k: Indicator, v: value (currently 0)
res[field] = 0
# Return result quickly if tracker or gt sequence is empty
if data['num_tracker_dets'] == 0:
res['IDFN'] = data['num_gt_dets']
return res
if data['num_gt_dets'] == 0:
res['IDFP'] = data['num_tracker_dets']
return res
# Variables counting global association
potential_matches_count = np.zeros((data['num_gt_ids'], data['num_tracker_ids']))#Create a dimension of gt_id number * an array of id numbers of output results. The initial value is 0. This array is used to record a pair of gt_id and tracker_ Number of id matches (IOU greater than threshold)
gt_id_count = np.zeros(data['num_gt_ids'])#Here is to generate a length equal to GT_ A one-dimensional array of ID numbers, which is used to record each gt_id the number of frames in the video
tracker_id_count = np.zeros(data['num_tracker_ids'])
#Here is to generate a length equal to the tracker_ A one-dimensional array of ID numbers, which is used to record each tracker_id the number of frames in the video
import pdb
# First loop through each timestep and accumulate global track information.
for t, (gt_ids_t, tracker_ids_t) in enumerate(zip(data['gt_ids'], data['tracker_ids'])):#Here is the id to traverse frame by frame, gt_ ids_ T is all IDs of each frame in gt
# Count the potential matches between ids in each timestep
matches_mask = np.greater_equal(data['similarity_scores'][t], self.threshold)#data[similarity_scores][t] is the similarity between each track and gt in frame T, which is a two-dimensional matrix
match_idx_gt, match_idx_tracker = np.nonzero(matches_mask)#Here, the row number and column number of non-zero are returned, that is, the number of gt and tracker, that is, the gt tracker pair whose similarity is greater than the threshold.
potential_matches_count[gt_ids_t[match_idx_gt], tracker_ids_t[match_idx_tracker]] += 1#Count the matching times of each pair
# Calculate the total number of dets for each gt_id and tracker_id.
gt_id_count[gt_ids_t] += 1#Here is to increase the id by 1 and record the number of occurrences
tracker_id_count[tracker_ids_t] += 1
pdb.set_trace()
# Calculate optimal assignment cost matrix for ID metrics
num_gt_ids = data['num_gt_ids']#Number of IDS in gt
num_tracker_ids = data['num_tracker_ids']
#The following operation is difficult to understand for the first time, but it is really clever!!!! If you don't understand one of the steps, you can follow my notes first.
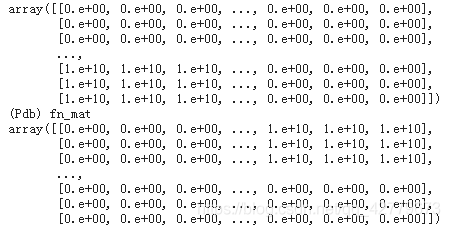
fp_mat = np.zeros((num_gt_ids + num_tracker_ids, num_gt_ids + num_tracker_ids))
fn_mat = np.zeros((num_gt_ids + num_tracker_ids, num_gt_ids + num_tracker_ids))#Generate a size of: num_gt_ids + num_tracker_ids*num_gt_ids + num_tracker_ids, matrix with all values of 0
fp_mat[num_gt_ids:, :num_tracker_ids] = 1e10#Change the lower left part of the matrix to the 10th power of 10
fn_mat[:num_gt_ids, num_tracker_ids:] = 1e10#Change the upper right part of the matrix to the 10th power of 10
pdb.set_trace()
for gt_id in range(num_gt_ids):
fn_mat[gt_id, :num_tracker_ids] = gt_id_count[gt_id]
fn_mat[gt_id, num_tracker_ids + gt_id] = gt_id_count[gt_id]##The function of this line of code is not quite understood. Why should a diagonal matrix be formed behind it??? After the final addition, it is undoubtedly the largest, and it is impossible to match
#Last fn_mat format: if the number of columns in each row is less than the tracking object, it is gt. If it is greater than, it is a diagonal matrix, and the diagonal is the corresponding gt_id_counts, everywhere else is 10 to the power of 10
for tracker_id in range(num_tracker_ids):
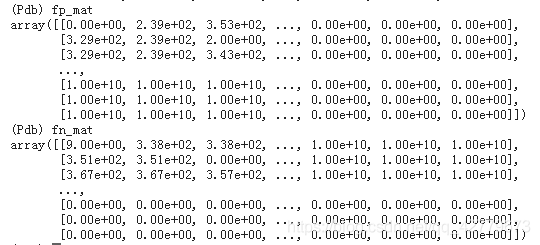
fp_mat[:num_gt_ids, tracker_id] = tracker_id_count[tracker_id]
fp_mat[tracker_id + num_gt_ids, tracker_id] = tracker_id_count[tracker_id]
#Finally, fp format is for each column. The number of rows less than gt is the tracker number, and the number greater than gt is a diagonal matrix
#FP and FN are output with num in the upper left corner_ gt_ ids*num_ tracker_ IDS has value
#The following two lines as like as two peas, I would like to say my opinion that IDFN is for GT, that is, I want to calculate the GT which is not matched, and IDFP is also for tracker. This explains why the id number of each GT should be recorded in fn above. The number of frames on each pair of GT tracker matches is subtracted below, fn_ Mat [: num_gt_ids,: num_tracker_ids] corresponds to the number of frames on which no pair of tracker GT does not match, FP_ Same with mat.
fn_mat[:num_gt_ids, :num_tracker_ids] -= potential_matches_count
fp_mat[:num_gt_ids, :num_tracker_ids] -= potential_matches_count
pdb.set_trace()
#The language expression ability is not very good. You can look at my debugging results and imagine.
    # Hungarian algorithm
    match_rows, match_cols = linear_sum_assignment(fn_mat + fp_mat)#Through the above explanation, it is not difficult to understand that among all the tracker gt pairs, the combinations with the least unmatched (the sum of unmatched gt and unmatched tracker) complete the problem of tracker gt allocation. I think it is to find the tracker gt pair with the highest coincidence

    #At this time, the upper left of the matrix is num_gt_ids*num_tracker_ids, the upper right is a diagonal matrix with non diagonal elements to the power of ten. The lower left is the same, and the lower right is all 0. Therefore, the matching here must be in the upper left, and the lower half must be 0. Therefore, after the final sum, it is equivalent to considering the upper left part of the value.

    # Accumulate basic statistics
    res['IDFN'] = fn_mat[match_rows, match_cols].sum().astype(np.int)
    res['IDFP'] = fp_mat[match_rows, match_cols].sum().astype(np.int)
    res['IDTP'] = (gt_id_count.sum() - res['IDFN']).astype(np.int)

    # Calculate final ID scores
    res = self._compute_final_fields(res)
    return res
At present, I pay more attention to the MOTA and IDF1 indicators. The latest HOTA indicators have not been carefully studied, and they will be updated if used in the future. 2021.8. ten
reference:
- Luiten J, Osep A, Dendorfer P, et al. Hota: A higher order metric for evaluating multi-object tracking[J]. International journal of computer vision, 2021, 129(2): 548-578.
- Bernardin K, Stiefelhagen R. Evaluating multiple object tracking performance: the clear mot metrics[J]. EURASIP Journal on Image and Video Processing, 2008, 2008: 1-10.
- Ristani E , Solera F , Zou R S , et al. Performance Measures and a Data Set for Multi-Target, Multi-Camera Tracking[C]// European Conference on Computer Vision. Springer, Cham, 2016.
MOT official website evaluation index source code: https://github.com/dendorferpatrick/MOTChallengeEvalKit