Introduction to MPAndroidChart - every bit of HorizontalBarChart. MPAndroidChart_ About the line chart MPAndroidChart_ The pie chart thing MPAndroidChart_ Dynamic histogram MPAndroidChart_ About the horizontal bar chart MPAndroidChart_ Parallel bar chart, and how to click to hide unwanted items. MPAndroidChart_ Radar chart and custom label color
Horizontal bar chart? That is, the inverted histogram can be simply understood as rotating the normal chart 90 degrees clockwise, and the corresponding relationship between x-axis and y-axis is as follows.
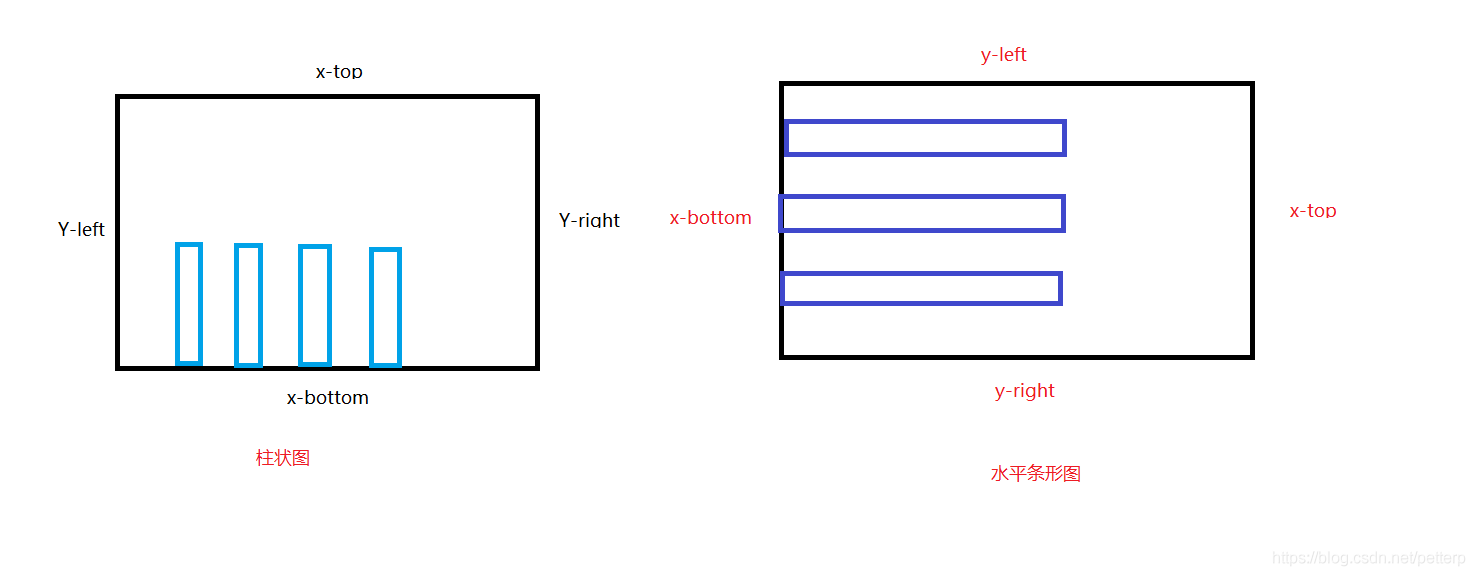
It's simple and clear. It's just a turn. Well, now I'm familiar with its related methods. In fact, it's no different from the histogram...
Attach the code directly, and the corresponding comments are also included. If you don't understand, you can see my other articles. Some methods are universal, so there is no need to demonstrate them again.
public class MainActivity extends AppCompatActivity {
    private HorizontalBarChart chart;

    @Override
    protected void onCreate(Bundle savedInstanceState) {
        super.onCreate(savedInstanceState);
        setContentView(R.layout.activity_main);
        chart = findViewById(R.id.chart);

        XAxis xAxis = chart.getXAxis();
        //Cancel x-axis horizontal line
        xAxis.setDrawAxisLine(true);
        //Cancel x-axis vertical line
        xAxis.setDrawGridLines(false);
        //Set the x axis at the bottom
        xAxis.setPosition(XAxis.XAxisPosition.BOTTOM);
        //Display 3 labels (not necessarily accurate, please bring true if you want to display accurately)
        xAxis.setLabelCount(3);
        // Maximum length of x-axis 3f (pay attention to its relationship with BarEntry(x,y) and X when customizing labels)
        xAxis.setAxisMaximum(3);
        // x axis label font size
        xAxis.setTextSize(20f);
        //Custom X axis
        final List<String> list=new ArrayList<>();
        list.add("yesterday");
        list.add("today");
        list.add("tomorrow");
        xAxis.setValueFormatter(new IAxisValueFormatter() {
            @Override
            public String getFormattedValue(float value, AxisBase axis) {
                return  value>2?"":list.get((int) value);
            }
        });

        //When defining the y-axis, you need to set both sides instead of disabling setEnabled directly. Otherwise, the data will not be displayed occasionally
        YAxis left = chart.getAxisLeft();
        left.setAxisMinimum(0);
        left.setDrawGridLines(false);
        left.setDrawAxisLine(false);


        YAxis right = chart.getAxisRight();
        right.setDrawGridLines(false);
        right.setDrawAxisLine(true);
        right.setTextSize(20f);
        right.setLabelCount(11);
        right.setAxisMinimum(0);
        // When customizing the length of the entry (the maximum relation between the entry and the x-axis of the entry, and the x-axis of the entry)
        right.setAxisMaximum(100f);

        //Custom Y axis
        final List<String> listY = new ArrayList<>();
        for (int i = 0; i <= 100; i += 10) {
            listY.add(i + "%");
        }
        right.setValueFormatter(new IAxisValueFormatter() {
            @Override
            public String getFormattedValue(float value, AxisBase axis) {
                return value>100?"":listY.get((int) value/10);
            }
        });


        //Offset the bottom of the chart upward by 10f
        chart.setExtraBottomOffset(10);
        //Shift the right side of the chart to the left by 10f
        chart.setExtraRightOffset(10);
        //Disable description
        chart.getDescription().setEnabled(false);
        //Disable legend
        chart.getLegend().setEnabled(false);

        //Random 3 numbers
        setData(3);
    }

    private void setData(int postion) {
        List<BarEntry> list = new ArrayList<>();
        for (int i = 0; i < postion; i++) {
            list.add(new BarEntry(i, (float) (Math.random() * 101)));
        }

        BarDataSet set = new BarDataSet(list, "");
        //Suppress labels
        set.setDrawValues(false);
        //Set multiple colors. If the x length is greater than the number of colors, the colors will be assigned randomly
        set.setColors(Color.RED,Color.BLACK,Color.BLUE);
        BarData data = new BarData(set);
        //Sets the width of the axis
        data.setBarWidth(0.4f);
        chart.setData(data);
        chart.invalidate();
    }

}
Finally, let's talk about the points needing attention when customizing the X and Y axes:
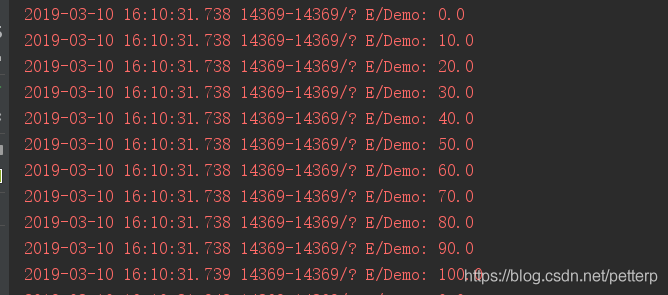
Note that the comments when I set the maximum length of x-axis and y-axis in the above code are closely related to X and Y in BarEntry(x,y). Generally, we don't need to set the labels of X and Y axes, but sometimes the requirements need these values to be customized and unchanged, just like the percentage in the Demo above. Let's first talk about the setLabelCount method, which sets the number of displayed tags. But not necessarily accurate setAxisMaximum is related to the size of X. when MPandroidchart adds data to the chart, because x is not a fixed size, it will specify the display of labels with the maximum x value and the number of labels each time it is drawn, and the value will increase from 0 and execute the labels several times. The same goes for the y-axis. As shown in the figure:
Therefore, if we want to customize the x-axis or y-axis, we must pay attention to the maximum length of the x-axis or y-axis. Only by setting the number of labels can we be more handy.
3.12 supplement
I found a problem when using it today. Why is my y-axis data not displayed occasionally? The reason is that the minimum y-axis length of one side is not set. When using other graphs, we can directly disable setEnabled. But in the horizontal chart, this is absolutely impossible. The reason is that the horizontal chart needs to determine a point on your two y axes to locate, but we usually set only one axis, so the data points will not be displayed.