Introduction to MPAndroidChart - bit by bit of BarChart's parallel histogram. MPAndroidChart_ About the line chart MPAndroidChart_ The pie chart thing MPAndroidChart_ Dynamic histogram MPAndroidChart_ About the horizontal bar chart MPAndroidChart_ Parallel bar chart, and how to click to hide unwanted items. MPAndroidChart_ Radar chart and custom label color
I met the parallel bar chart of MP in the competition yesterday. There are not many records on this aspect on the Internet, so let's do a tutorial today.
Let's look at the simple requirements sketch first
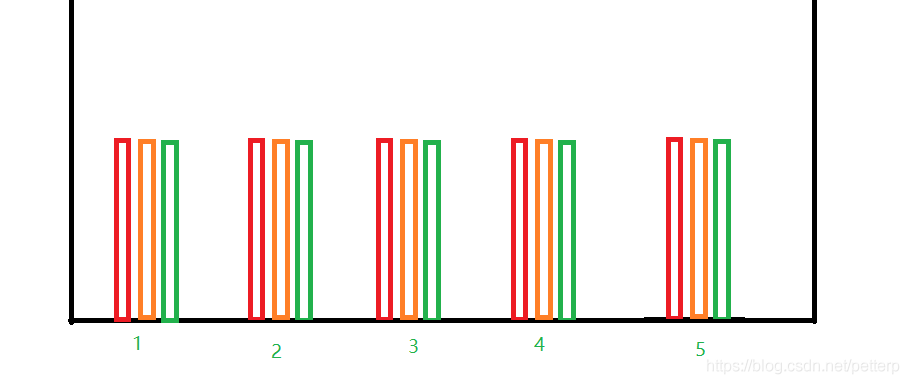
Well, now let's start the code. Where we need to pay special attention, we will highlight the reminder.
public class Main2Activity extends AppCompatActivity {
    private BarChart chart;
    private CountDownTimer count;
    @Override
    protected void onCreate(Bundle savedInstanceState) {
        super.onCreate(savedInstanceState);
        setContentView(R.layout.activity_main2);
        chart=findViewById(R.id.chart);
        info();
        count=new CountDownTimer(Integer.MAX_VALUE,2000) {
            @Override
            public void onTick(long millisUntilFinished) {
                setData();
            }

            @Override
            public void onFinish() {

            }
        }.start();
    }

    private void info(){
        XAxis xAxis=chart.getXAxis();
        xAxis.setDrawGridLines(false);
        xAxis.setPosition(XAxis.XAxisPosition.BOTTOM);
        xAxis.setLabelCount(5);
        //Sets the minimum value of the x-axis
        xAxis.setAxisMinimum(0f);
        //Sets the maximum value of the x-axis
        xAxis.setAxisMaximum(5f);
        final String[] data={"Monday","Tuesday","Wednesday","Thursday","Friday"};
        //Label centered
        xAxis.setTextSize(25f);
        xAxis.setCenterAxisLabels(true);
        //Custom x-axis
        xAxis.setValueFormatter(new IAxisValueFormatter() {
            @Override
            public String getFormattedValue(float v, AxisBase axisBase) {
                return data[(int) Math.abs(v%5)];
            }
        });

        YAxis left=chart.getAxisLeft();
        left.setAxisMinimum(0f);
        left.setAxisMaximum(6f);
        left.setLabelCount(6);
        //Set font size
        left.setTextSize(25f);
        //Set the width of the vertical line on the left side of the y axis. If it is not set, the vertical line will not be displayed when customizing the label
        left.setAxisLineWidth(1f);
        //Hide the grid line on the left of Y axis
        left.setDrawGridLines(false);
        final String[] setY={"","open","Slow down","traffic jam","General congestion","Severe congestion"};
        left.setValueFormatter(new IAxisValueFormatter() {
            @Override
            public String getFormattedValue(float v, AxisBase axisBase) {
                return v>=6?"":setY[(int) v];
            }
        });

        YAxis right=chart.getAxisRight();
        right.setDrawGridLines(false);
        right.setAxisMinimum(0f);
        right.setTextSize(25f);
        right.setAxisMaximum(5f);

        //Set chart compilation to avoid incomplete display of x-axis labels
        chart.setExtraBottomOffset(10);
        //Disable legend
        chart.getLegend().setEnabled(false);
        //Disable description
        chart.getDescription().setEnabled(false);
    }

    private void setData(){
        List<BarEntry> list1=new ArrayList<>();
        List<BarEntry> list2=new ArrayList<>();
        List<BarEntry> list3=new ArrayList<>();
        for (int i=0;i<5;i++){
            list1.add(new BarEntry(i, (float) (Math.random()*5)));
            list2.add(new BarEntry(i, (float) (Math.random()*5)));
            list3.add(new BarEntry(i, (float) (Math.random()*5)));
        }
        BarDataSet set1=new BarDataSet(list1,"");
        BarDataSet set2=new BarDataSet(list2,"");
        BarDataSet set3=new BarDataSet(list3,"");
        set1.setColor(Color.RED);
        set2.setColor(Color.BLUE);
        set3.setColor(Color.GREEN);

        BarData data=new BarData(set1,set2,set3);
        //Space between histograms within a group
        float barspace=0.05f;
        //Space between groups
        float groupspcae=0.3f;
        //Width of histogram
        float barWidth=(1-0.3f-0.05f*3)/3;
        //Sets the width of the histogram
        data.setBarWidth(barWidth);
        //(starting point, group interval, intra group interval)
        data.groupBars(0f,groupspcae,barspace);

        //The above calculation formula is graph group interval + (histogram interval * number of histogram) + sub histogram width * number of histogram in each group = 1f
        //The simple calculation is that the width of sub histogram = (1f graph group interval - (histogram interval * number of histograms)) / the number of histograms in each group

        //set up
        chart.setData(data);
        //Refresh layout
        chart.invalidate();
    }

    @Override
    protected void onDestroy() {
        super.onDestroy();
        if (count != null) {
            count.cancel();
            count=null;
        }
    }
}
Look at the actual renderings
Now, let's implement how to click to hide the corresponding item.
Here's the idea. Thank my studio classmates for their simplicity and rudeness:
Click the corresponding button to set the color of the corresponding histogram to white. It's a more clever way.
My idea at that time was to retain the data, then add the mark bit, change the data at the corresponding position to 0 each time, and then refresh the layout. However, the List data is always changed, but the chart refresh directly deletes a group of data. I'm very puzzled. I tried for a whole morning and couldn't find the reason. If any of you have a better idea, you are welcome to say it
The following details need attention: The background color must be changed to white. The default background color is not pure white. Grid lines need to be disabled, otherwise the effect is very embarrassing. You need to hide the label display, otherwise the color of the histogram is gone and the label is still there. Of course, you can also customize the display of the corresponding label to "" or disable it.
Supplement 4.17: it can also be realized by directly changing the data and then refreshing the layout. At that time, a wrong value was changed.
Let's start with the code
public class Main2Activity extends AppCompatActivity implements View.OnClickListener {
    private BarChart chart;
    private CountDownTimer count;
    private BarDataSet set1;
    private BarDataSet set2;
    private BarDataSet set3;
    //Marker bit
    private boolean mode1 = false, mode2 = false, mode3 = false;

    @Override
    protected void onCreate(Bundle savedInstanceState) {
        super.onCreate(savedInstanceState);
        setContentView(R.layout.activity_main2);
        chart = findViewById(R.id.chart);
        info();
        //timer
        count = new CountDownTimer(Integer.MAX_VALUE, 2000) {
            @Override
            public void onTick(long millisUntilFinished) {
                setData();
            }

            @Override
            public void onFinish() {

            }
        }.start();
    }


    private void info() {
        XAxis xAxis = chart.getXAxis();
        xAxis.setDrawGridLines(false);
        xAxis.setPosition(XAxis.XAxisPosition.BOTTOM);
        xAxis.setLabelCount(5);
        //Sets the minimum value of the x-axis
        xAxis.setAxisMinimum(0f);
        //Sets the maximum value of the x-axis
        xAxis.setAxisMaximum(5f);
        final String[] data = {"Monday", "Tuesday", "Wednesday", "Thursday", "Friday"};
        //Label centered
        xAxis.setTextSize(25f);
        xAxis.setCenterAxisLabels(true);
        //Custom x-axis
        xAxis.setValueFormatter(new IAxisValueFormatter() {
            @Override
            public String getFormattedValue(float v, AxisBase axisBase) {
                return data[(int) Math.abs(v % 5)];
            }
        });

        YAxis left = chart.getAxisLeft();
        left.setAxisMinimum(0f);
        left.setAxisMaximum(6f);
        left.setLabelCount(6);
        //Set font size
        left.setTextSize(25f);
        //Set the width of the vertical line on the left side of the y axis. If it is not set, the vertical line will not be displayed when customizing the label
        left.setAxisLineWidth(1f);
        //Hide the grid line on the left of Y axis
        left.setDrawGridLines(false);
        final String[] setY = {"", "open", "Slow down", "traffic jam", "General congestion", "Severe congestion"};
        left.setValueFormatter(new IAxisValueFormatter() {
            @Override
            public String getFormattedValue(float v, AxisBase axisBase) {
                return v >= 6 ? "" : setY[(int) v];
            }
        });

        YAxis right = chart.getAxisRight();
        right.setDrawGridLines(false);
        right.setAxisMinimum(0f);
        right.setTextSize(25f);
        right.setAxisMaximum(5f);

        //Set chart compilation to avoid incomplete display of x-axis labels
        chart.setExtraBottomOffset(10);
        //Disable legend
        chart.getLegend().setEnabled(false);
        //Disable description
        chart.getDescription().setEnabled(false);
        chart.setBackgroundColor(Color.WHITE);

        findViewById(R.id.hide_red).setOnClickListener(this);
        findViewById(R.id.hide_blue).setOnClickListener(this);
        findViewById(R.id.hide_gre).setOnClickListener(this);
    }

     private void setData() {
        List<BarEntry> list1 = new ArrayList<>();
        List<BarEntry> list2 = new ArrayList<>();
        List<BarEntry> list3 = new ArrayList<>();
        for (int i = 0; i < 5; i++) {
            list1.add(new BarEntry(i, (float) (Math.random() * 5)));
            list2.add(new BarEntry(i, (float) (Math.random() * 5)));
            list3.add(new BarEntry(i, (float) (Math.random() * 5)));
        }
        set1 = new BarDataSet(list1, "");
        set2 = new BarDataSet(list2, "");
        set3 = new BarDataSet(list3, "");
        setHide(mode1, set1, Color.RED);
        setHide(mode2, set2, Color.BLUE);
        setHide(mode3, set3, Color.GREEN);
        BarData data = new BarData(set1, set2, set3);
        //Space between histograms within a group
        float barspace = 0.05f;
        //Space between groups
        float groupspcae = 0.3f;
        //Width of histogram
        float barWidth = (1 - 0.3f - 0.05f * 3) / 3;
        //Sets the width of the histogram
        data.setBarWidth(barWidth);
        //(starting point, group interval, intra group interval)
        data.groupBars(0f, groupspcae, barspace);

        //The above calculation formula is graph group interval + (histogram interval * number of histogram) + sub histogram width * number of histogram in each group = 1f
        //The simple calculation is that the width of sub histogram = (1f graph group interval - (histogram interval * number of histograms)) / the number of histograms in each group

        //set up
        chart.setData(data);
        //Refresh layout
        chart.invalidate();
    }


    //Set the histogram color to white
    private void setHide(boolean mode, BarDataSet set, int color) {
        if (mode) {
            set.setColor(Color.WHITE);
        } else {
            set.setColor(color);
        }
        set.setDrawValues(false);
    }

    @Override
    public void onClick(View v) {
        switch (v.getId()) {
            case R.id.hide_red:
                mode1 = true;
                set1.setColor(Color.WHITE);
                chart.invalidate();
                break;
            case R.id.hide_blue:
                mode2 = true;
                set2.setColor(Color.WHITE);
                chart.invalidate();
                break;
            case R.id.hide_gre:
                mode3 = true;
                set3.setColor(Color.WHITE);
                chart.invalidate();
                break;
        }
    }

  @Override
    protected void onDestroy() {
        super.onDestroy();
        if (count != null) {
            count.cancel();
            count = null;
        }
    }

}
That's the effect. If there is a better solution, you are also welcome to tell me.